
 ?Mathematical formulae have been encoded as MathML and are displayed in this HTML version using MathJax in order to improve their display. Uncheck the box to turn MathJax off. This feature requires Javascript. Click on a formula to zoom.
Abstract
Using data of autumn (September–November) Palmer Drought Severity Index (PDSI) observed at 61 weather observation stations for 1974–2013 provided by Korea Meteorological Administration (KMA), the present study applies the statistical change-point analysis to the PDSI time-series in order to determine variability of autumn drought in Korea. The study result shows a trend that autumn drought in Korea has been weakened since 1998. This weakening trend is statistically significant at the 90% confidence level. Thus, a difference in autumn mean between 1998–2013 (PDSI: –1.6, which means ‘wetness’ condition) and 1974–1997 periods (PDSI: –0.6, which means ‘drought’ condition) is analyzed in order to determine the cause of the weakening of autumn drought in Korea in recent years. The analysis on 850 hPa stream flows shows that the Mascarene high (MH) is strengthened in the southeast sea of Madagascar and anomalous northeasterlies blown from this anomalous anticyclonic circulation are moved to the north along the eastern coast of Africa as the cross-equatorial flows and then move from India to the east towards the South China Sea (SCS) by the anomalous cyclone (Arabian low, AL) located in the south sea of the Arabian Peninsula. Then, the anomalous flows move to the north direction towards Korea and Japan by the anomalous anticyclone (western North Pacific subtropical high, WNPSH) located in the east of Japan and anomalous cyclone located in the East Asia continent thereby showing clear anomalous southerlies in those regions. The anomalous pressure system pattern of west low and east high type is a typical pressure system pattern revealed during summer in East Asia. That is, the anomalous southerlies played an important role in supplying warm and humid airs in the low latitude to mid-latitude regions in East Asia including Korea and Japan. In addition, the predictability for autumn drought in Korea is diagnosed using three anomalous pressure systems (MH, AL, WNPSH).
1. Introduction
A dry period in autumn is weaker than that in winter, but if the dry condition in summer continues up to the following late spring, it could result in damage to a number of industries including agriculture due to the lack of water resources that is why a dry period in autumn is regarded as important. In 2000, autumn precipitation in Korea was <70% of normal precipitation at the same period around the country, which continued a dry condition. In particular, northwestern and southwestern regions in Korea experienced a severe lack of precipitation <50% of the normal precipitation. Furthermore, in 2001, most regions in Korea except for Jeju Island had <50% of normal precipitation and thus the minimum precipitation was recorded at 58 stations out of total 72 weather observation stations around the country since 1904 when the country started weather observations. On the contrary, exceptionally a great deal of rainfall of 447.3 mm was recorded as an average for 12 weather observation stations in 2003, revealing much interannual variation in autumn precipitation. Note that annual mean rainfall in Korea is 1300 mm.
There have been studies on teleconnection of drought occurrence (Jun et al., Citation2008; Bothe et al., Citation2012; Kim et al., Citation2012). Lee (Citation1999) analyzed a relationship between Palmer Drought Severity index (PDSI) and El Nino-Southern Oscillation (ENSO) and found that droughts in Korea started and continued from the year when El Niño was finished, and Cha et al. (Citation1999) claimed that increase (decrease) in rainfall occurred at the time of El Niño (La Niña). On the contrary, Rajagopalan et al. (Citation2000) pointed out that droughts in the USA was related to the distribution of sea surface temperature through teleconnection between ENSO and sea surface temperature but not strongly related to ENSO, and Byun et al. (Citation2001) suggested that a certain region in Asia would experience drought in El Niño years and La Niña years and those regions were different annually according to intensities of El Niño (La Niña) and thus droughts were not significantly related through study on correlation between Niño-3 anomalies and droughts in Asia. Kim et al. (Citation2017) conducted a correlation analysis of global atmospheric circulation patterns and space-time changes in droughts in Korea. The analysis of the contemporaneous correlation between precipitation and atmospheric teleconnection patterns showed a higher correlation between precipitation in the Global Precipitation Climatology Project (GPCP) and the West Pacific (WP) pattern in spring within East China, Kyushu Island and South Korea.
Historically, Korea has drought and flooding, which is two types of disasters that occur periodically. Both of them occur at a different time with different cycle and trend. In particular, drought seems to occur infrequently with longer interval compared to that of flooding but damage due to drought occurs everywhere in Korea in every year although its damage size or occurrence region is less than that of flooding.
There are two types of method to evaluate drought quantitatively: a method that evaluates drought by directly utilizing hydrologic data such as precipitation and runoff and a method using drought indexes. In order to analyze drought statistically, Chang et al. (Citation2004) derived spatial characteristics of drought through empirical orthogonal function (EOF) analysis after calculating the Standard Precipitation Index (SPI) using daily precipitation data from 59 weather observation stations under the Korean Meteorological Administration (KMA). Kim et al. (Citation2008) calculated the extreme index by using meteorological data and then analyzed past data in weather observation stations based on the index to verify the trend of weather pattern that rainfall amount was increased over time. On the other hand, the frequency of rainfalls was reduced and rainfall amount in summer was more concentrated than in autumn. Kim (Citation2006) employed statistical methods, which can be used in hydrometeorological data analysis, such as change-point analysis method and correlation analysis method using linear trend analysis technique, periodical analysis technique and eigenvalue technique in order to utilize statistical techniques accurately and conveniently according to the study purpose as well as introducing a representative method for each analysis technique. The present study applies the statistical change-point analysis to the PDSI time-series in order to determine variability of autumn drought in Korea. Choi et al. (Citation2017) applied a statistical change-point analysis to the time-series for spring drought in Korea using the PDSI in order to investigate the deepening of spring drought in Korea.
For studies on monitoring and forecasting drought by utilizing drought indexes, Lee et al. (Citation2006a) selected drought indexes such as PDSI, SPI and modified surface water supply index (MSWSI) on a monthly basis by utilizing various hydrometeorological data to develop a drought monitoring system and analyzed the accuracy of quantitative reproduction of past droughts thereby verifying the validation as a drought monitoring index. Lee et al. (Citation2006b) advanced the above index and then developed an integrated drought index (drought-related total information system) to evaluate drought quantitatively and predict future drought as developing.
For studies on the periodicity analysis of hydrological time-series, Kwon and Moon (Citation2005a) introduced a wavelet transform analysis method and evaluated the applicability to hydrological time-series. Kwon and Moon (Citation2005b) also conducted correlation analysis on low frequency of PDSI and ENSO index. To do this, they conducted cross wavelet transform and Multi-Channel Singular Spectrum Analysis (MSSA; Rangelova et al., Citation2012).
For studies on the trend analysis of hydrological time-series, a number of statistical verification methods have been utilized. For example, Khadr et al. (Citation2009) studied a trend of drought using the SPI with regard to droughts around Ruhr River watershed and a number of Korean scholars have also applied various statistical methods to verify the trend of meteorological data such as precipitation and air temperature.
In the present study, the PDSI was used to analyze long-term variability of autumn drought in Korea. The PDSI is a meteorological drought index that has been widely used around the world (Briffa et al., Citation1994; Cook et al., Citation1999; Heim, Citation2002; Lloyd-Hughes and Saunder, Citation2002; Ntale and Gan, Citation2003; Cook et al., Citation2004; Dai et al., Citation2004; Zou et al., Citation2005; D’Arrigo et al., Citation2006; van der Schrier et al., Citation2006). In general, much attention has been paid to ideal development of continental anticyclone as a main cause that incurs autumn drought in Korea but few studies have been conducted on such subject. Moreover, previous studies have rarely dealt with long-term variation in autumn precipitation in Korea. Therefore, the present study investigated characteristics of large-scale circulation related to long-term variation in autumn drought in Korea using the PDSI in order to diagnose predictability and understanding on autumn drought in Korea.
In Section 2, materials and analysis methods are introduced and in Section 3, a time-series of autumn drought in Korea is analyzed. In Section 4, causes of weakening autumn drought in Korea in recent years are investigated and in Section 5, predictability of autumn drought in Korea is discussed. In Section 6, the study results are summarized.
2. Data and methods
2.1. Data
The present study employed PDSI observed at 61 weather observation stations for 40 years from 1974 to 2013 provided by KMA. The reason for the use of data after 1974 in PDSI was because modernization on meteorological observation has occurred rapidly since 1974 (Choi et al., Citation2010).
The PDSI is a drought index developed by Palmer (Citation1965). It was calculated by taking precipitation, evaporation, runoff and soil moisture content into consideration comprehensively to which accumulated effects of meteorologically estimated precipitation and real precipitation were considered by introducing the water balance model (Thornthwaite and Hare, Citation1959). The PDSI is a drought index that analyzes a long-term drought level quantitatively since it is not affected by short-term wet conditions. It has an advantage of evaluation on drought level based on criteria whether real water supply is more or less than water supply required meteorologically. The present study also used reanalysis data of the PDSI provided by the National Centers for Environmental Prediction-National Center for Atmospheric Research (NCEP-NCAR) to examine the condition of the autumn drought in East Asia. The data have also horizontal space resolution of 2.5° × 2.5° and applicable up until now since 1870. The classification of drought according to the PDSI is shown in Table .
Table 1. Classification of Palmer Drought Severity Index (PDSI).
Also, this study used the variables of geopotential height (gpm), zonal and meridional winds (ms−1), precipitable water (kg m−2), air temperature (°C) and specific humidity (g kg−1) data from NCEP-NCAR reanalysis 1 in 1974 to 2013 (Kalnay et al., Citation1996; Kistler et al., Citation2001). This NCEP-NCAR reanalysis 1 data consisted of spatial resolution such as latitude and longitude 2.5° × 2.5° and 17 vertical levels (specific humidity is 16 vertical levels and precipitable water are 1 level). Also, velocity potential consisted of grid box such as latitude and longitude 192 × 94 and five sigma levels. In addition, Gaussian grid-based ground heat net flux (W m−2) and snow depth (water equivalent of accumulated snow depth, WEASD, kg m−2) were used. Wang et al. (Citation2010) mentioned that NCEP-NCAR re-analysis 1 data may have systematic errors in the meridional wind in the period before 1980 and so they also used the 40-year European Centre for Medium-Range Weather Forecasts (ECMWF) Re-analysis (ERA-40; Uppala et al., Citation2005) to compare with the results from NCEP-NCAR reanalysis 1 dataset. As a result, they showed that two dataset are nearly same in temporal homogeneity.
The NOAA Extended Reconstructured monthly Sea Surface Temperature (SST) (Reynolds et al., Citation2002), available from the same organization, was also used. The data have a horizontal resolution of 2.0° × 2.0° latitude-longitude and are available for the period of 1854 to the present day. The different results may be showed if we use other SST datasets in addition to the one from NOAA. He et al. (Citation2015) used NOAA Extended Reconstructed SST V3 (ERSST V3) and the Hadley Centre Sea Ice and Sea Surface Temperature dataset (HadISST; Rayner et al., Citation2003) to detect the decadal change in the tropical cyclone (TC) activity over the western North Pacific in the late 1990s. As a result, they confirmed that spatial and temporal variations of SST between the two dataset are nearly consistent.
In addition, the Climate Prediction Center (CPC) Merged Analysis of Precipitation (CMAP) data (Xie and Arkin, Citation1997) was employed and the horizontal spatial resolution of which is the same as the NCEP-NCAR reanalysis dataset. This data is based on the monthly average and is available from 1979 to the present day. The CMAP data, which is global precipitation data that covers the ocean, are derived by merging rain gauge observations, five different satellite estimates and numerical model outputs.
The TC data were obtained from the best track archives of Regional Specialized Meteorological Center (RSMC)-Tokyo Typhoon Center. This data consist of TC names, longitude and latitude positions, minimum surface central pressures and maximum sustained wind speeds (10-min average maximum winds to nearest 5kts), which were measured every 6 hours from 1974 to 2013. The TCs were divided into four categories based on their maximum sustained surface wind speeds (MSSWS), namely tropical depression (MSSWS <17 ms−1), tropical storm (17 m s−1 ≤ MSSWS ≤24 m s−1), severe tropical storm (25 m s−1 ≤ MSSWS ≤32 m s−1) and typhoon (MSSWS ≥33 m s−1). In addition to the above four categories, the extratropical cyclones (ETs) transformed from TCs were included in the analysis. This is because ETs also cause a huge loss of life and property in the mid-latitudes of East Asia.
2.2. Methods
This study used the Student’s t test to determine significance (Wilks, Citation1995). In case that two independent time-series follow a t distribution and their time averages are denoted as and
, respectively, the t-statistic is given by
where,
and
are standard deviations, and
and
are numbers of the two time-series, respectively. From the above formula, if the absolute value of t is greater than threshold values with a level of significance, the null hypothesis would be rejected at the
(×100)% significance level.
In order to determine whether a year of climate regime shift was present in the time-series of the autumn PDSI, the statistical change-point analysis was applied to the time-series. Once the analysis method is applied, t value is calculated and a year which has the largest absolute value of t means that there was a climate regime shift in that year. Because this variable does not follow a Poisson distribution, we use a different method to detect climate regime shifts in PDSI time series: using a log-linear regression model in which a step function is expressed as an independent variable. If the estimated slope is at least twice as large as its standard error, one may reject the null hypothesis (i.e. which the slope being zero) at the 5% significance level. More information about this statistical method can be found in Elsner et al. (Citation2000), Chu (Citation2002), and Ho et al. (Citation2004).
In the present study, autumn refers to September to November.
3. Analysis of time-series of autumn drought in Korea
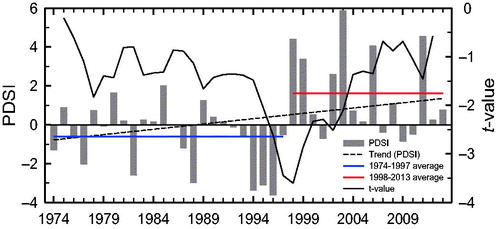
Figure shows the time-series of autumn drought averaged for 61 weather observation stations in Korea using the PDSI for the recent 40 years. Overall, this time-series shows a clear interannual and interdecadal variation as well as a weakening trend of drought (dashed line). This weakening trend is statistically significant at the 90% confidence level. In order to determine whether a year of climate regime shift is present in the time-series, statistical change-point analysis was applied to this time-series (solid line). As a result, an absolute value of the largest t was existed at 1998. A mean PDSI during 1974–1997 period was –0.6 (blue line), which was classified as ‘drought’ phase according to the classification table of drought intensity in the PDSI (Palmer, Citation1965) (Table ). On the other hand, a mean PDSI during 1998–2013 period was 1.6 (red line), which was classified as ‘wetness’ phase in the classification table of drought intensity in the PDSI. A difference of PDSI between two periods is about 2 and this difference is statistically significant at the 95% confidence level. Therefore, the analysis period of 40 years can be divided into two periods: ‘drought period’ during 1975–1997 and ‘wetness period’ during 1998–2013. Thus, a difference in autumn mean between 1998–2013 and 1974–1997 periods was analyzed in order to determine the cause of the weakening of autumn drought in Korea since late 1990s.
Figure 1. Time series of autumn (September–November) Palmer Drought Severity Index (PDSI) averaged for 61 weather observation stations in Korea (bar graph) and the result (t-value) of statistical change-point analysis (solid line).
4. Differences between 1998–2013 and 1974–1997
4.1. Atmospheric circulations
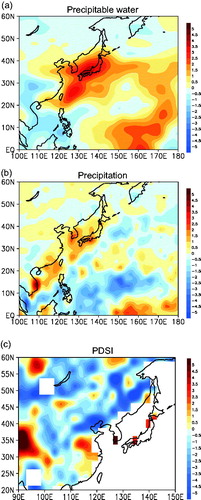
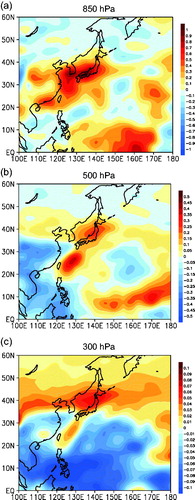
The present study analyzed a difference in precipitation between two periods (Fig. and ). In the precipitable water, positive anomalies were revealed in the western North Pacific and mid-latitude regions in East Asia (Fig. ). In particular, a center of the positive anomalies was linked from the east sea of Taiwan to Korea and Japan in the southwest and northeast directions. The spatial distribution of the difference in precipitation between two periods due to the spatial distribution of precipitable water showed a center of positive anomalies in the southwest and northeast directions from the South China Sea (SCS) and southern region in China to Korea and Japan through the East China Sea (Fig. ). Thus, water vapor in the atmosphere is more abundant during autumn in the 1998–2013 period thereby weakening droughts. The weakening of autumn drought in Korea for 1998–2013 can be viewed from the spatial distribution of the difference in PDSI between two periods (Fig. ). Negative anomalies were strengthened in most regions in East Asia continent, indicating deepening autumn drought during 1998–2013 period. In contrast, positive anomalies were revealed in southeast and central east regions in China as well as Korea and Japan. Although spatial resolution was coarse, a center of the positive anomalies was located in Korea.
Figure 2. Differences in (a) precipitable water, (b) precipitation, and (c) PDSI between 1998–2013 and 1974–1997. Units are kg m−2 for precipitable water and ms−1 for precipitation.
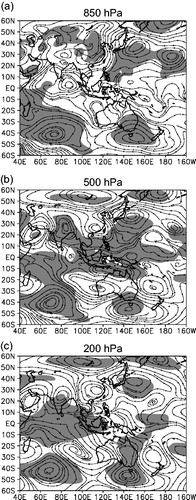
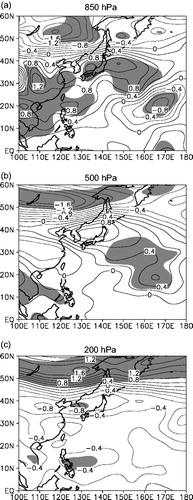
A difference in large-scale atmospheric circulations between the two periods was analyzed to determine the cause of weakening of autumn drought in Korea in 1998–2013 period (Fig. ). First, anomalous anticyclonic circulations were strengthened in the southeast sea of Madagascar at 850 hPa level (Fig. ). This anomalous anticyclone is defined as Mascarene high (MH; Xue et al., Citation2004). Anomalous northeasterlies blown from this anomalous anticyclonic circulation move to the north along the eastern coast of Africa as cross-equatorial flows and then move to the east toward the SCS from India. Then, the anomalous flows move to the north direction toward Korea and Japan by the anomalous anticyclone located in the east of Japan and anomalous cyclone located in East Asia continent thereby showing clear anomalous southerlies in those regions. The anomalous pressure system pattern of west low and east high type is a typical pressure system pattern revealed during summer in East Asia. That is, the anomalous southerlies play a role in supplying warm and humid airs in the low latitude to mid-latitude regions in East Asia including Korea and Japan. Therefore, autumn drought was weakened in Korea during autumn in 1998–2013 period due to the sufficient provision of the warm and humid airs. Anomalous anticyclone is strengthened in the southeast sea of Madagascar at 500 hPa level as well and typical summer anomalous pressure system pattern, which is a west low and east high type, is formed in regions of East Asia so that Korea is affected by the anomalous southerlies (Fig. ). This anomalous pressure system pattern of west low and east high type is linked from the Arabian Peninsula as a type of anomalous wave train pattern. A spatial distribution of the anomalous pressure systems at 200 hPa level is similar to that at 500 hPa level (Fig. ). Anomalous anticyclone is strengthened in the southeast sea of Madagascar and typical summer anomalous pressure system pattern, which is a west low and east high type, is formed in regions of East Asia so that Korea is affected by the anomalous southerlies. The anomalous pressure system pattern of west high and east low type is linked from the Arabian Peninsula as a type of anomalous wave train pattern.
Figure 3. Same as in Fig. 2, but for (a) 850 hPa, (b) 500 hPa, and (c) 200 hPa stream flows. Shaded areas are significant at the 95% confidence level.
On the other hand, analysis on difference in 850 hPa stream flows between the two periods shows that anomalous southerlies strengthened in the mid-latitude region in East Asia is generated from MH located in the southeast sea of Madagascar. Thus, a correlation map between autumn PDSI in Korea and autumn 850 hPa geopotential height for the recent 40 years is analyzed in order to determine whether a significant correlation between autumn drought in Korea and MH is existed (Fig. ). Negative correlations are revealed in Asia continent and Maritime Continent. In particular, a center of the negative correlation is located in the Arabian Peninsula. This indicates that when the anomalous cyclone is strengthened in the Arabian Peninsula, autumn drought in Korea becomes weaker. A formation of such correlation reflects that strong anomalous cyclonic circulations are located in the Arabian Peninsula as shown in the analysis on differences in 850 hPa stream flows between the two periods. On the other hand, positive correlations are revealed from the southeast sea of Madagascar to the western North Pacific via the southern sea in Australia. In particular, a center of the positive correlation in the western North Pacific is located at Manchuria. This indicates that when the anomalous anticyclone is strengthened in the western North Pacific, autumn drought in Korea becomes weaker. A formation of such correlation reflects that anomalous anticyclonic circulations are located in the east sea of Japan as shown in the analysis on differences in 850 hPa stream flows between the two periods. A center of the highest positive correlation in the analysis area is revealed in a region where MH was located. Up to 0.7 of the positive correlation coefficient is revealed and the correlation coefficient is significant at the 99% confidence level. This means that the stronger the anomalous anticyclone (MH), the weaker the autumn drought in Korea.
Figure 4. (a) spatial distribution of correlation coefficient between autumn PDSI in Korea and geopotential height at 850 hPa, (b) time series of autumn PDSI in Korea (solid line) and geopotential height averaged over 50°S–30°S and 50°–100°E in (a) (dotted line), and (c) the result of statistical change-point analysis on geopotential height averaged over 50°S–30°S and 50°–100°E.
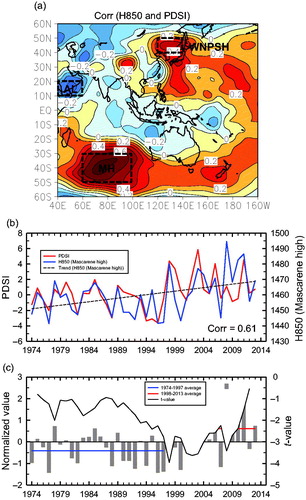
Thus, time-series of autumn PDSI in Korea and autumn 850 hPa geopotential height averaged over the highest positive correlation region (50°S-30°S, 50°–100°E) are analyzed in Fig. . The 850 hPa geopotential height tends to increase and this increasing trend is significant at the 95% confidence level (dashed line). Furthermore, clear interannual and interdecadal variations are revealed. In particular, two variables have a clear in-phase relationship. Therefore, a positive correlation of 0.61 between the two variables is revealed and this correlation is significant at the 99% confidence level. This indicates that as MH is strengthened, autumn drought becomes weaker in Korea as explained in the above.
The statistical change-point analysis is applied to this time-series in order to determine whether a climate regime shift is also existed around 1998 even in the normalized time-series with respect to 850 hPa geopotential height (Fig. ). It is seen that an absolute value of the largest t is also existed in 1998 (solid line). A mean value in the 1974–1997 period is –0.41 and a mean value in the 1998–2013 period is 0.61, revealing about 1 of difference between the two periods. This difference is statistically significant at the 95% confidence level.
4.2. Atmospheric, oceanic and land surface conditions
A difference in air temperature between the two periods is analyzed to determine the atmospheric condition during autumn in Korea in the 1998–2013 period (Fig. ). Cold anomalies are revealed in the northern region of 40°N at 850 hPa and 500 hPa levels whereas warm anomalies are revealed in the southern region of 40°N (Fig. and ). In particular, a center of the warm anomalies is located from the central region in China to the east sea of Japan via Korea. An opposite spatial distribution is revealed at 200 hPa level compared to that at 850 and 500 hPa levels (Fig. ). That is, warn anomalies are revealed in the northern region of 45°N whereas cold anomalies are revealed in the southern region of 45°N. In particular, a center of the cold anomalies is located from the central region in China to the east sea of Japan via Korea. Thus, warm anomalies are dominant at the middle and lower troposphere where cold anomalies are clearly seen at the upper troposphere so that vertical thermal instability is developed, indicating high likelihood of formation of precipitation during autumn in Korea in the 1998–2013 period.
Figure 5. Same as in Fig. 2, but for air temperature. Shaded areas are significant at the 95% confidence level.
A difference in specific humidity between the two periods reveals that positive anomalies are shown at all levels of the troposphere from the central and northern region in China to the east sea of Japan via Korea (Fig. ). This is because anomalous flows supply warm and humid airs in the low latitude to regions around Korea as anomalous southerlies are strengthened further at regions around Korea during autumn in the 1998–2013 period as analyzed in the above.
Figure 6. Same as in Fig. 2, but for specific humidity.
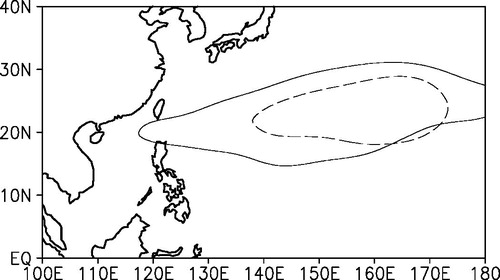
The result in the previous analysis, in which anomalous anticyclone is strengthened in the east sea of Japan during autumn in the 1998–2013 period and high positive correlation of the autumn PDSI in Korea with 850 hPa geopotential height near Manchuria is revealed, means that the WNPSH is strengthened further during autumn in the 1998–2013 period. Therefore, this study analyzes the development intensity of the WNPSH between two periods (Fig. ). Here, the WNPSH is defined as a region which has more than 5,870 gpm at 500 hPa level. The WNPSH in the 1998–2013 period is not only extended to the west up to the southern sea in Taiwan but also develops in the south and north direction (solid line). On the contrary, the WNPSH in the 1974–1997 period is not only contracted to the east of 135°E but also weakened in the south and north direction (dashed line). Thus, warm and humid airs in the low latitude during autumn in the 1998–2013 period, in which the WNPSH is strengthened further in Korea, are easily supplied to Korea via the WNPSH.
Figure 7. Spatial distribution of western North Pacific subtropical high (WNPSH) in 1998–2013 (solid line) and 1974–1997 (dashed line). Here, the WNPSH is defined as areas that geopotential height at 500 hPa is >5870 gpm.
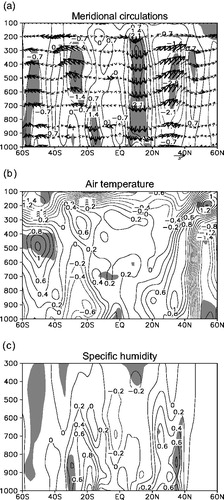
In order to determine the characteristics of the vertical atmospheric conditions around Korea, a difference in vertical meridional atmospheric circulations averaged over 125°–135°E, which is a longitudinal zone where Korea is located, between the two periods is analyzed (Fig. ). In the 0°–20°N latitudinal zone, anomalous downward flows are developed strongly at all levels of the troposphere, which reflects the strengthening of the WNPSH as analyzed in the above. In contrast, in the 20°–40°N latitudinal zone where Korea is located, anomalous upward flows are strongly developed at all levels of the troposphere and the anomalous flows are significant at the 90% confidence level. In particular, it is found that anomalous upward flows are derived by anomalous southerlies. Thus, drought is further weakened by the anomalous upward flows developed further in regions around Korea during autumn in the 1998–2013 period. In contrast, anomalous downward flow developed around 40°S is related to MH. In the difference in air temperature between the two periods, warm anomalies are strengthened at the middle and lower troposphere around the latitudinal zone (20°–40°N) whereas cold anomalies are strengthened at the upper troposphere, verifying that vertical thermal instability is further strengthened around Korea during autumn in the 1998–2013 period (Fig. ). The difference in specific humidity between the two periods shows that positive anomalies are revealed at all levels of the troposphere in the latitudinal zone (20°–40°N) around Korea, indicating humidity is plentiful that can be followed by precipitation at all levels of the troposphere around Korea during autumn in the 1998–2013 period (Fig. ).
Figure 8. Composite differences of latitude–pressure cross section of (a) vertical velocity (contours) and meridional circulations (vectors), (b) air temperature, and (c) specific humidity averaged along 125°–135°E between 1998–2013 and 1974–1997 for September–November. The values of vertical velocity are multiplied by −100. Bold arrows and shaded areas are significant at the 90% confidence level. Contour intervals are 0.7−2 hPa s−1 for vertical velocity, 0.2 °C for air temperature, and 0.2 g kg−1 for specific humidity, respectively.
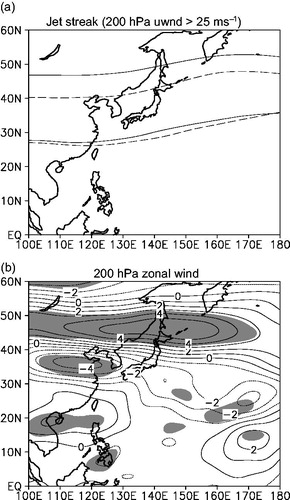
In general, the upper tropospheric jet strengthens convergence to form upward flows thereby being able to induce precipitation (Liang and Wang Citation1998; Lau and Nath, Citation2000). Therefore, the present study analyzes the development extent of the upper tropospheric (200 hPa) jet between the two periods (Fig. ). The jet streak (solid line) in the 1998–2013 period is developed in the farther north than the jet streak (dashed line) in the 1974–1997 period. This is because the WNPSH in the former period is farther developed in the north direction. Thus, it can be known that anomalous upward flows are likely to be developed in Korea during autumn in the 1998–2013 period in which the upper tropospheric jet is developed in the farther north. The upper tropospheric jet developed further during autumn in the 1998–2013 period can be seen more clearly in the analysis on the difference in 200 hPa zonal wind between the two periods (Fig. ). Positive anomalies are developed from Lake Baikal to the south of Kamchatka Peninsula via Manchuria whereas negative anomalies are strengthened from the central region in China to the east sea of Japan via Korea. This indicates that the upper tropospheric jet is farther developed in the north direction during autumn in the 1998–2013 period.
Figure 9. Spatial distributions of (a) jet streak in 1998–2013 (solid line) and 1974–1997 (dashed line) and (b) difference in 200 hPa zonal wind between 1998–2013 and 1974–1997 for September–November. Contour interval in (b) is 1 ms−1. Shaded areas in (b) are significant at the 95% confidence level.
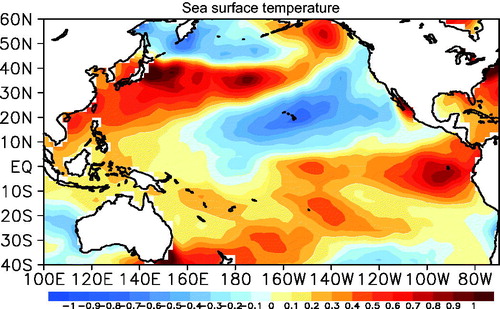
The condition of the ocean can also influence the stability of the atmosphere at the lower troposphere. Thus, a difference of SST between the two periods is analyzed in the present study (Fig. ). Warm SST anomalies are strengthened in the southeastern sea of Australia from the offshore of Peru, cold SST anomalies are strengthened in the subtropical central Pacific from the west sea of North America, and warm SST anomalies are strengthened again from the south sea of Alaska to the coast in East Asia. That is, a spatial distribution of wave train pattern is shown from the south sea to the north sea in the Pacific. In particular, most waters in East Asia during autumn in the 1998–2013 period have warm SST anomalies thereby supplying warm and humid airs to the lower troposphere, resulting in instability at the entire troposphere.
Figure 10. Same as in Fig. 2, but for sea surface temperature.
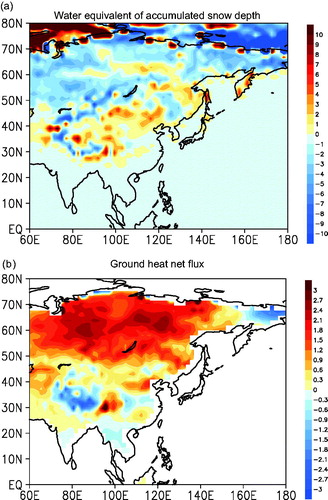
As analyzed in the above, a difference in snow depth during autumn season between the two periods is analyzed in order to know the reason for the strengthening of anomalous pressure system pattern as west low and east high type in East Asia in recent years (Fig. ). The analysis result shows that many regions in Eurasia have negative anomalies. Snow not only reflects solar heat due to the albedo effect but also absorbs latent heat from surrounding air when snow is melted due to solar heat thereby playing a role in cooling the air in the surrounding area. However, the albedo effect is not expected because snow is less during autumn in the 1998–2013 period in the present study. Therefore, a difference in ground heat net flux between the two periods is analyzed in order to determine whether regions in East Asia are heated due to the negative anomalies in snow depth revealed in many regions in East Eurasia (Fig. ). As expected, the analysis result shows that most regions in Eurasia have warm anomalies. The anomalous thermal low is formed in the East Asia continent due to the heating in the continent of East Asia and anomalous high is developed in the western North Pacific where specific heat is rather low. As a result, anomalous pressure system pattern of west low and east high type is further strengthened in East Asia during autumn in the 1998–2013 period thereby forming anomalous southerlies that supply warm and humid airs to Korea.
Figure 11. Same as in Fig. 2, but for (a) water equivalent of accumulated snow depth (WEASD) and (b) ground heat net flux (GFLUX). Units are kg m−2 in (a) and W m−2 in (b).
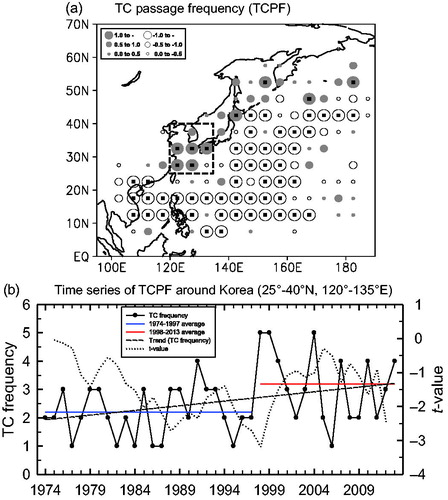
Drought may be relieved effectively due to precipitation accompanied with TCs. Thus, a difference in TC passage frequency between the two periods is analyzed in the present study (Fig. ). TCs in autumn during 1974–1997 period show a movement pattern that is passed from the sea to the east of the Philippines toward the Indochinese Peninsula via SCS or from the far east sea of the Philippines toward the far east sea of Japan in the north direction. Thus, it can be known that a lack of precipitation is likely to occur due to TCs in Korea during autumn in the 1974–1997 period, which is regarded as ‘drought period’. On the other hand, TCs in autumn in the 1998–2013 period show a pattern that moves from the East China Sea toward Korea and Japan in the northward direction. This is because the WNPSH is farther developed toward Korea as explained in the above. Accordingly, it is found that precipitation is more plentiful due to TCs in Korea during autumn in the 1998–2013 period. In addition, a time-series of TC frequency that affected Korea during autumn is analyzed (Fig. ). The TCs that affected Korea during autumn in the present study are defined as TCS that passed the region (dashed line box in Fig. ) in 25°–40°N and 120°–130°E. A TC frequency that affected Korea during autumn for the recent 40 years tends to increase (dashed line) and this trend is significant at the 90% confidence level. The statistical change-point analysis is applied to the time-series of TC frequency that affected Korea during autumn in order to determine whether a climate regime shift is also existed in 1998 in the time series as analyzed in the above (dotted line). An absolute value of the largest t is present in 1998 as expected. Therefore, the analysis period of 40 years in total can be divided into a low frequency period of TCs in 1974–1997 and a high frequency period of TCs in 1998–2013. A mean number of 1974–1997 period is 2.2 TCs (blue line) whereas a mean number of 1998–2013 period is 3.2 TCs (red line), resulting in 1 TC difference between the two periods. This difference is statistically significant at the 90% confidence level. Thus, drought can become worse since TC frequency that affected Korea during autumn in the 1974–1997 is low whereas a likelihood of drought can be lower slightly due to high TC frequency that affected Korea during autumn in the 1998–2013 period. Although not indicated in the figure, a positive correlation is revealed between TC frequency that affected Korea during autumn for 40 years and autumn PDSI in Korea as 0.32, which was significant at the 90% confidence level.
Figure 12. (a) Differences in the mean TC passage frequencies (TCPF) between 1998–2013 and 1974–1997 for September–November within each 5°×5° latitude-longitude grid box. Small solid rectangles indicate that the differences are significant at the 95% confidence level and (b) time series of TCPF (dot with closed circle) around Korea (25°–40°N and 120°–135°E) (dashed line in (a)) and its result on statistical change-point analysis (dotted line).
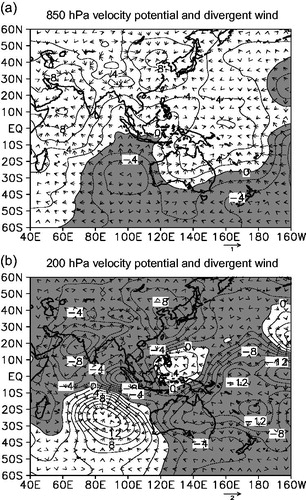
In addition, a difference in global-scale atmospheric circulations (velocity potential and divergent wind fields) between the two periods is analyzed in order to determine the reason for the weakening of autumn drought in Korea since 1998 (Fig. ). A strong anomalous divergence is present in the sea in the west of Australia (the east of Madagascar) at 850 hPa level (Fig. ). This is related to the development of MH as explained in the above. The anomalous convergence is present in the south sea in the Arabian Peninsula, which is related to the strengthening of anomalous cyclone in the region as explained in the above. In the regions in East Asia, anomalous convergence is strengthened. The velocity potential and divergent wind fields at 200 hPa level have the opposite spatial distribution to that at 850 hPa level (Fig. ). Anomalous convergence is present in the west sea of Australia (the east of Madagascar) where strong anomalous divergence is present at 850 hPa level, and anomalous divergence is present at the south sea in the Arabian Peninsula and East Asia regions. Thus, global-scale atmospheric circulations, in which airs ascend in regions in East Asia and south sea in Arabia are moved to the southward and converge and then descend in the west sea of Australia (the east of Madagascar), are further developed during autumn in the 1998–2013 period.
Figure 13. Same as in Fig. 2, but for (a) 850 hPa velocity potential and divergent wind) and (b) 200 hPa velocity potential and divergent wind. Shaded areas denote negative anomalies. Contour interval is 2 m2s−110−6.
5. Diagnosis of predictability for autumn drought in Korea
In Fig. , three regions were revealed as high positive and negative correlations between autumn PDSI in Korea and 850 hPa geopotential height as follows: MH area (50°S-30°S, 60°–110°E), Arabian low (AL) area (10°–20°N, 40°–60°E), WNPSH area (40°–50°N, 120°–140°E). Therefore, a new index can be made that can represent autumn drought in Korea as presented in the below equation using the normalized 850 hPa geopotential height in the three regions.
In the equation, ‘norm’ refers to normalization, 850 hPa gpm refers to geopotential height at 850 hPa level, MH, AL and WNPSH refer to MH area, AL area and WNPSH area. A time-series of new index (ADKI, thick dashed line) produced via the above equation and a time-series of autumn PDSI (thick solid line) in Korea are compared (Fig. ). The ADKI time-series shows clear interannual and interdecadal variations. The ADKI for the recent 40 years shows an increasing trend and this increasing trend is statistically significant at the 90% confidence level. The two time-series show a clear in-phase relationship and have a high positive correlation of 0.82 between the two variables. This correlation is statistically significant at the 99% confidence level.
Figure 14. Time series of autumn (September–November) Palmer Drought Severity Index (PDSI) in Korea (thick solid line), model (thick dashed line), and the result (t-value) of statistical change-point analysis on model (thick grey line).
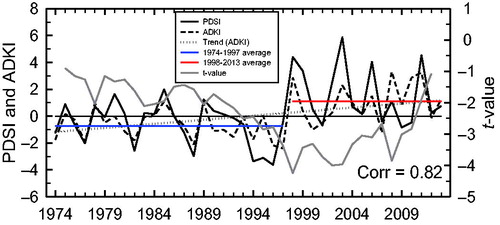
In order to determine whether a climate regime shift is present in 1998 even in the ADKI time-series, the statistical change-point analysis is applied to this time-series (thick grey line). The analysis result shows that an absolute value of the largest t is present in 1998 and the analysis period of a total of 40 years is divided into two: low index period of 1974–1997 and high index period of 1998–2013. A mean number of 1974–1997 period is –0.72 (blue line) whereas a mean number of 1998–2013 period is 1.1 (red line), resulting in a difference of around two between the two periods. This difference is statistically significant at the 90% confidence level. Thus, the ADKI reflects well not only interannual variation of the PDSI but also interdecadal variation. Predictability presupposes a time-lag and it is not very well applicable. So, the index will only be useful if it persists for some months.
As for the predictability of autumn drought in Korea using this new index, if the dynamical seasonal forecasting model produces forecasting synoptic fields in autumn in advance, it is expected to produce a prediction index of autumn drought in Korea by substituting the forecasted 850 hPa geopotential height field to the equation for the ADKI without using complicated variables (precipitation, evaporation, runoff, soil moisture content and so on) for PDSI.
6. Summary and conclusion
The present study applied the statistical change-point analysis to the PDSI time-series in order to diagnose the variability of autumn drought in Korea using the PDSI. The study result showed a trend that drought in autumn in Korea has been weakened since 1998. This weakening trend is statistically significant at the 90% confidence level. Thus, a difference in autumn mean between 1998–2013 and 1974–1997 periods was analyzed in order to determine the cause of the weakening of autumn drought in Korea in recent years. If the analysis of the PDSI was extended to regions in East Asia, positive anomalies were revealed from the east region in China to Korea and Japan whereas negative anomalies were strengthened in the rest of regions in East Asia. This was because plentiful precipitation and water vapor were revealed from the central region of China to Korea and Japan in the analysis on precipitable water.
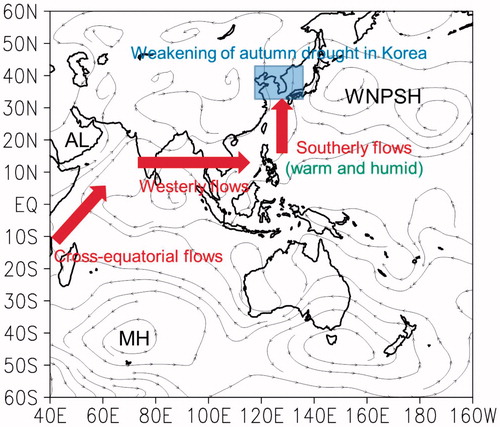
The analysis on 850 hPa stream flow showed that the MH was strengthened in the sea of the southeast of the island of Madagascar and anomalous northeasterlies blown from the anomalous anticyclonic circulations were moved to the north along the eastern coast in Africa as the cross-equatorial flows and then moved from India to the east towards the SCS by the anomalous cyclone (AL) located in the south sea of the Arabian Peninsula. Then, the anomalous flows moved to the north direction toward Korea and Japan by the anomalous anticyclone (WNPSH) located in the east of Japan and anomalous cyclone located in the East Asia continent thereby showing clear anomalous southerlies in those regions. The anomalous pressure system pattern of west low and east high type was a typical pressure system pattern revealed during summer in regions in East Asia. That is, the anomalous southerlies played a role in supplying warm and humid airs in the low latitude to mid-latitude regions in East Asia including Korea and Japan (Fig. ).
Figure 15. Schematic illustration of anomalous atmospheric circulation patterns related to the weakening of autumn drought in Korea since 1998.
Thus, a correlation map between autumn PDSI in Korea and 850 hPa geopotential height was analyzed in order to determine whether the autumn PDSI in Korea was related to MH, AL and WNPSH. A large positive correlation was found in the southeast sea of Madagascar and Manchuria and a high negative correlation was positioned in the south sea of the Arabian Peninsula. This indicated that as MH, AL and WNPSH were strengthened, autumn drought in Korea became weaker. Thus, the statistical change-point analysis was applied to a time-series of MH which had the highest correlation among three pressure systems. The analysis result showed that a climate regime shift was present in 1998 and MH was rapidly strengthened since 1998.
In addition, warm anomalies were revealed at the middle and lower troposphere in regions around Korea and cold anomalies at the upper troposphere so that vertical thermal instability was strengthened at the troposphere in regions around Korea. Furthermore, specific humidity showed positive anomalies at all levels of the troposphere in regions around Korea, revealing a humid condition at all levels of the troposphere. Moreover, upper tropospheric jet was developed in regions around Korea due to the strengthening of the WNPSH. Therefore, anomalous upward flows were formed due to the strengthening of convergence in the lower troposphere thereby inducing precipitation. In addition, most waters in East Asia had warm SST anomalies thereby supplying warm and humid airs to the lower troposphere, resulting in instability in the entire troposphere.
A snow depth in autumn was analyzed to determine the cause of strengthening the anomalous pressure system pattern of west low and east high type in East Asia. The analysis result showed that negative anomalies were revealed in many regions in Eurasia so that the albedo effect cannot be expected. Therefore, analysis results on the ground heat net flux showed that warm anomalies were revealed in most regions of Eurasia. The anomalous thermal low was formed in the East Asia continent due to the heating in the continent and anomalous high was developed in the western North Pacific where specific heat was rather low thereby further strengthening an anomalous pressure system pattern of west low and east high type in regions in East Asia during autumn in the 1998–2013 period.
The present study analyzed a difference in TC passage frequency between the two periods. TCs in autumn during 1974–1997 period showed a movement pattern that was passed from the sea to the east of the Philippines toward the Indochinese Peninsula via SCS or from the far east sea of the Philippines toward the far east sea of Japan in the north direction. On the other hand, TCs in autumn in the 1998–2013 period showed a pattern that moved from the East China Sea toward Korea and Japan in the northward direction. This was because the WNPSH was farther developed toward Korea as explained in the above. Accordingly, it was found that precipitation was more plentiful due to TCs during autumn in the 1998–2013 period. In addition, a time-series of TC frequency that affected Korea during autumn season was analyzed. A climate regime shift was present in 1998 in the time-series of TC frequency that affected Korea during autumn so that analysis period of total of 40 years can be divided into a low frequency period of 1974–1997 and a high frequency period of 1998–2013. Thus, drought can become worse since TC frequency that affected Korea during autumn in the 1974–1997 was low whereas a likelihood of drought can be lower slightly due to high TC frequency that affected Korea during autumn in the 1998–2013 period.
A new index (ADKI) was created that can represent autumn drought in Korea using the previously defined MH, AL and WNPSH and a climate regime shift was also existed in 1998 in the time-series in the new index. Thus, the index reflected well not only interannual variation of the autumn PDSI in Korea but also interdecadal variation. Thus, if the dynamical seasonal forecasting model produces forecasting fields on autumn in advance, it was expected to produce a prediction index of autumn drought in Korea by substituting the forecasted 850 hPa geopotential height field to the equation for the ADKI.
Disclosure statement
No potential conflict of interest was reported by the authors.
Additional information
Funding
References
- Bothe, O., Fraedrich, K. and Zhu, X. H. 2012. Tibetan Plateau summer precipitation: covariability with circulation indices. Theor. Appl. Climatol. 108, 293–300. doi:10.1007/s00704-011-0538-1.
- Briffa, K. R., Jones, P. D. and Hulme, M. 1994. Summer moisture variability across Europe, 1892–1991: an analysis based on the Palmer Drought Severity Index. Int. J. Climatol. 14, 475–506. doi:10.1002/joc.3370140502.
- Byun, H. R., Kang, K. A. and Kim, K. H. 2001. Correlations between Nino-3 anomalies and Asian drought and flood. J. Korean Meteor. Soc. 37, 453–464.
- Cha, E. J., Jhun, J. G. and Chung, H. S. 1999. A study on characteristics of climate in South Korea for El Niño/La Niña years. J. Korean Meteor. Soc. 35, 98–117.
- Chang, Y. G., Kim, S. D. and Choi, K. W. 2004. A study on the spatial characteristics of drought using SPI and EOF analysis. In: Conference of Korean Society of Civil Engineering, Korean Water Resources Association, Seoul, Korea, pp. 4897–4902.
- Choi, J. W., Cha, Y., Kang, S. D. and Shim, C. S. 2017. Interdecadal variation in Korean spring drought in the early 1990s. Dyn. Atmos. Ocean 78, 165–177. doi:10.1016/j.dynatmoce.2017.04.004.
- Choi, K. S., Moon, J. Y., Kim, D. W., Byun, H. R. and Kripalani, R. H. 2010. The significant increase of summer rainfall occurring in Korea from 1998. Theor. Appl. Climatol. 102, 275–286. doi:10.1007/s00704-010-0256-0.
- Cook, E. R., Meko, D. M., Stahle, D. W. and Cleaveland, M. K. 1999. Drought reconstructions for the continental United States. J. Climate 12, 1145–1162. doi:10.1175/1520-0442(1999)012<1145:DRFTCU>2.0.CO;2.
- Cook, E. R., Woodhouse, C. A., Eakin, C. M., Meko, D. M. and Stahle, D. W. 2004. Long-term aridity changes in the western United States. Science 306, 1015–1018. doi:10.1126/science.1102586.
- Chu, P. S. 2002. Large-scale circulation features associated with decadal variations of tropical cyclone activity over the central North Pacific. J. Climate 15, 2678–2689. doi:10.1175/1520-0442(2002)015<2678:LSCFAW>2.0.CO;2.
- Dai, A. G., Trenberth, K. E. and Qian, T. 2004. A global dataset of Palmer Drought Severity Index for 1870–2002: relationship with soil moisture and effects of surface warming. J. Hydrometeor. 5, 1117–1130. doi:10.1175/JHM-386.1.
- D’Arrigo, R., Wilson, R., Palmer, J., Krusic, P., Curtis, A. and co-authors. 2006. Monsoon drought over Java, Indonesia, during the past two centuries. Geophys. Res. Lett. 33, L04709. doi:10.1029/2005GL025465.
- Elsner, J. B., Jagger, T. and Niu, X. F. 2000. Changes in the rates of North Atlantic major hurricane activity during the 20th century. Geophys. Res. Lett. 27, 1743–1746.
- He, H., Yang, J., Gong, D., Mao, R., Wang, Y. and co-authors.. 2015. Decadal changes in tropical cyclone activity over the western North Pacific in the late 1990s. Clim. Dyn. 45, 3317–3329. doi:10.1007/s00382-015-2541-1.
- Heim, R. R.Jr. 2002. A review of twentieth-century drought indices used in the United States. Bull. Amer. Meteor. Soc. 83, 1149–1165. doi:10.1175/1520-0477-83.8.1149.
- Ho, C.-H., Baik, J.-J., Kim, J.-H., Gong, D.-Y. and Sui, C.-H. 2004. Interdecadal changes in summertime typhoon tracks. J. Climate 17, 1767–1776. doi:10.1175/1520-0442(2004)017<1767:ICISTT>2.0.CO;2.
- Jun, K. Y., Byun, H. R. and Kim, D. W. 2008. Lag-correlation of Korean drought in East Asia. KMS Atmos. 18, 249–266.
- Kalnay, E., Kanamitsu, M., Kistler, R., Collins, W., Deaven, D. and co-authors. 1996. The NCEP/NCAR 40-year reanalysis project. Bull. Amer. Meteor. Soc. 77, 437–471. doi:10.1175/1520-0477(1996)077<0437:TNYRP>2.0.CO;2.
- Khadr, M., Morgenschweis, G. and Schlenkhoff, A. 2009. Analysis of meteorological drought in the Ruhr Basin by using the standardized precipitation index. World Academy of Science. Eng. Technol. 57, 607–616.
- Kim, K. S. 2006. Statistical method for hydrological-meteorological data analysis. In: Conference of Korean Water Resources Association, Korean Water Resources Association, Seoul, Korea, pp. 373–398.
- Kim, B. K., Kim, B. S. and Kim, H. S. 2008. On the change of extreme weather event using extreme indices. J. Korean Soc. Civil Eng. 28, 41–53.
- Kim, J. S., Jain, S. and Yoon, S. K. 2012. Warm season streamflow variability in the Korean Han River Basin: links with atmospheric teleconnections. Int. J. Climatol. 32, 635–640. doi:10.1029/2012JD017677. doi:10.1002/joc.2290.
- Kim, J. S., Seo, G. S., Jang, H. W. and Lee, J. H. 2017. Correlation analysis between Korean spring drought and large-scale teleconnection patterns for drought forecasting. KSCE J. Civ. Eng. 21, 458. doi:10.1007/s12205-016-0580-8. doi:10.1007/s12205-016-0580-8.
- Kistler, R., Collins, W., Saha, S., White, G., Woollen, J. and co-authors. 2001. The NCEP–NCAR 50-year reanalysis: monthly means CD-ROM and documentation. Bull. Amer. Meteor. Soc. 82, 247–267. doi:10.1175/1520-0477(2001)082<0247:TNNYRM>2.3.CO;2.
- Kwon, H. H. and Moon, Y. I. 2005. Analysis of hydrological time series using wavelet transform. J. Korean Water Res. Assoc. 38, 439–448. doi:10.3741/JKWRA.2005.38.6.439.
- Kwon, H. H. and Moon, Y. I. 2005b. Relationship between PDSI and ENSO. J. Korean Water Res. Assoc. 25, 355–358.
- Lau, N. C. and Nath, M. J. 2000. Impact of ENSO on the variability of the Asian-Australian monsoons as simulated in GCM experiments. J. Climate 13, 4287–4309. doi:10.1175/1520-0442(2000)013<4287:IOEOTV>2.0.CO;2.
- Lee, D. R. 1999. Relationship between ENSO and drought in Korea. J. Water Res. 30, 317–326.
- Lee, J. H., Jeong, S. M., Kim, S. J. and Lee, M. H. 2006. Development of drought monitoring system: 1. Applicability of drought indices for quantitative drought monitoring. J Korean Water Resour. Assoc. 39, 787–800.
- Lee, J. H., Jeong, S. M., Ko, Y. S. and Kim, H. Y. 2006. Development of drought monitoring system: 2. Quantitative drought monitoring and development of drought forecasting method. J Korean Water Resour. Assoc. 39, 801–812.
- Liang, X. Z. and Wang, W. C. 1998. Association between China monsoon rainfall and tropospheric jets. Qj. Royal Met. Soc. 124, 2597–2623. doi:10.1002/qj.49712455204.
- Lloyd-Hughes, B. and Saunder, M. A. 2002. A drought climatology for Europe. Int. J. Climatol. 22, 1571–1592. doi:10.1002/joc.846.
- Ntale, H. K. and Gan, T. Y. 2003. Drought indices and their application to East Africa. Int. J. Climatol. 23, 1335–1357. doi:10.1002/joc.931.
- Palmer, W. C. 1965. Meteorological drought. Research Paper 45. U.S. Dept. of Commerce, 58 pp.
- Rajagopalan, B., Cook, E., Lall, U. and Ray, B. 2000. Spatiotemporal variability of ENSO and SST teleconnections to summer drought over the United States during the twentieth century. J. Climate 13, 4244–4255. doi:10.1175/1520-0442(2000)013<4244:SVOEAS>2.0.CO;2.
- Rangelova, E., Sideris, M. G. and Kim, J. W. 2012. On the capabilities of the multi-channel singular spectrum method for extracting the main periodic and non-periodic variability from weekly GRACE data. J. Geodynamics 54, 64–78. doi:10.1016/j.jog.2011.10.006.
- Rayner, N. A., Parker, D. E., Horton, E. B., Folland, C. K., Alexander, L. V. and co-authors. 2003. Global analyses of sea surface temperature, sea ice and noght marine air temperature since the late nineteenth century. J. Geophys. Res. 108, 4407.
- Reynolds, R. W., Rayner, N. A., Smith, T. M., Stokes, D. C. and Wang, W. 2002. An improved in situ and satellite SST analysis for climate. J. Climate 15, 1609–1625. doi:10.1175/1520-0442(2002)015<1609:AIISAS>2.0.CO;2.
- Thornthwaite, C. W. and Hare, F. K. 1959. Climatic classification in forestry. Unasylva 9, 1–16.
- Uppala, S. M., KÅllberg, P. W., Simmons, A. J., Andrae, U., Bechtold, V. D. C. and co-authors. 2005. The ERA-40 RE-analysis. Qj. Meteorol. Soc. 131, 2961–3012. doi:10.1256/qj.04.176.
- van der Schrier, G., Briffa, K. R., Jones, P. D. and Osborn, T. J. 2006. Summer moisture variability across Europe. J. Climate 19, 2818–2834. doi:10.1175/JCLI3734.1.
- Wilks, D. S. 1995. Statistical Methods in the Atmospheric Sciences. Academic Press, 467 pp.
- Xie, P. and Arkin, P. A. 1997. Global precipitation: a 17-year monthly analysis based on gauge observations, satellite estimates, and numerical model outputs. Bull. Amer. Meteor. Soc. 78, 2539–2558. doi:10.1175/1520-0477(1997)078<2539:GPAYMA>2.0.CO;2.
- Xue, F., Wang, H. J. and He, J. H. 2004. Interannual variability of Mascarene high and Australian high and their influences on East Asian summer monsoon. JMSJ. 82, 1173–1186. doi:10.2151/jmsj.2004.1173.
- Wang, B., Wu, Z., Chang, C. P., Liu, J., Li, J. and co-authors. 2010. Another look at interannual-to-interdecadal variations of the East Asian winter monsoon: the northern and southern temperature modes. J. Climate 23, 1495–1512. doi:10.1175/2009JCLI3243.1.
- Zou, X. K., Zhai, P. M. and Zhang, Q. 2005. Variations in droughts over China: 1951–2003. Geophys. Res. Lett. 32, n/a. L04707. doi:10.1029/2004GL021853.