
 ?Mathematical formulae have been encoded as MathML and are displayed in this HTML version using MathJax in order to improve their display. Uncheck the box to turn MathJax off. This feature requires Javascript. Click on a formula to zoom.
Abstract
The Mediterranean overflow water is one of the most important intermediate-depth water masses in the North Atlantic. To investigate its properties a pre-industrial simulation with the earth system model EC-Earth is used. The multidecadal variability of the outflow is analysed by examining the modelled volume and salt transports through the Strait of Gibraltar as well as different atmospheric patterns (such as the wind pattern and the net freshwater fluxes). The salinity evolution in the main core of the outflow in the mid-Atlantic is also taken into account. The leading empirical orthogonal functions for the modelled salinity 900 m coincided with the modelled distribution of outflow water. The associated principal component showed a multidecadal variability of the salinity field. The variability of the net salt transport through the Strait of Gibraltar showed a similar behaviour where the Atlantic-Mediterranean system manifested two clear states. One of these is when the Mediterranean imports salt from the Atlantic and the other is where salt export to the Atlantic predominates. This result indicates that the Mediterranean Sea acts as a storage of salt alternating between the two states. The negative phase of the North Atlantic oscillation appears to play a role driving the variability of the salt transport and its impact on the overturning circulation in the North Atlantic.
1. Introduction
Dense waters in the ocean play an important role for its thermohaline circulation. These waters are usually formed over the continental shelves or in marginal seas where dry and/or cold conditions through evaporation and cooling processes densify the surface waters. The formation, properties and variability of these dense water masses have a significant impact on the climate. In this study, we examine an important marginal sea where dense water masses are formed, the Mediterranean Sea.
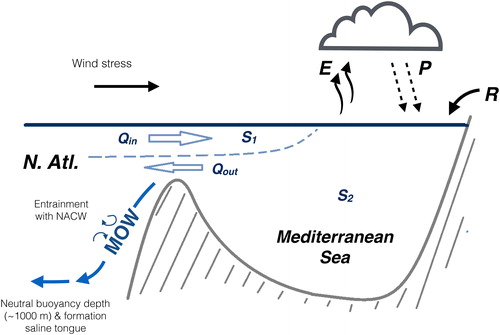
The formation of dense water within this basin can be described by a reverse estuarine circulation. Relatively fresh surface waters from the Atlantic Ocean enter the Mediterranean Sea through the Strait of Gibraltar (SoG). An excess of evaporation (E) over precipitation (P) and river runoff (R) over large areas of the region drives the formation of denser and saline waters. These dense waters leave the Mediterranean Sea as deep currents through the SoG and form a saline tongue in the North Atlantic at mid-depths (see ). This saline pool is known as the Mediterranean overflow water (MOW) and has an impact on the convection of surface waters in the Nordic Seas (Reid, Citation1979; McCartney and Mauritzen, Citation2001; Wu et al., Citation2007; Lozier and Stewart, Citation2008) and on the variability of the Atlantic Meridional Overturning Circulation (AMOC), cf. Artale et al. (2006). Atmospheric fluctuations such as the North Atlantic Oscillation (NAO) have been found to have an important role for the net evaporation over the Mediterranean basin and for controlling the wind pattern at the SoG (Boutov et al., Citation2014).
Fig. 1. Schematic representation of the formation of the Mediterranean overflow water (MOW). The wind stress in the vicinity of the Gulf of Cadiz and the net evaporation (E–P–R) in the Mediterranean basin play an important role in the MOW formation. The volume transport and the mean salinity of the inflow are described by Qin and S1, respectively, whereas the outflow is characterised by Qout and S2.
The interaction between the MOW, AMOC and NAO suggests the existence of feedback mechanisms driven by both the atmosphere and ocean. The main objectives of this study are to understand the multidecadal variability of the MOW and its effects. The present study mainly focuses on the changes of the inflow/outflow transports through the SoG and their direct or indirect contribution to preconditioning surface waters for deep convection. The observations in the area are not of sufficient duration for the purpose of this study as they only cover few cycles of possible multidecadal processes. Instead, results from a climate model will be analysed under pre-industrial conditions.
A region of strong multidecadal variability of both temperature and, in particular, of salinity at a depth of 900 m shows up in the North Atlantic west of the SoG. (This strong signal of variability, computed by Empirical Orthogonal Functions (EOF) decomposition, arises even when the analysis is extended to global scales.) The particular depth and the geographical location suggest that the outflow waters from the Mediterranean Sea are mainly responsible for the variability in the region (see ). This leading EOF will be presented in more detail in Section 4.2. Understanding the possible mechanisms and sources of this variability are the main goals of the present study. The role of anomalies for the volume and, especially, for the salt transport through the SoG and for the MOW variability are discussed in this study. Moreover, the contribution of air-sea interactions (wind stress, freshwater fluxes) on the MOW variability and the effects of the MOW variability for the AMOC are also studied.
The study is structured as follows. Section 2 introduces a short background on the formation of the MOW, the effect of the atmospheric fluctuations and the effect of MOW on the AMOC. Section 3 briefly describes the method, model and dataset used for the investigation. We analyse the variability of the MOW based on EOF decompositions in Section 4, and hereafter examine the multidecadal variability of the volume and salt transports through the SoG. Subsequently an analysis of the effect of the E–P–R and the wind stress on the properties of the MOW and the SoG transports is undertaken. Finally, we discuss the effect of the MOW on the AMOC.
2. Background
2.1. Sources of MOW
The net evaporation (E–P–R) is mostly positive all over the Mediterranean basin except in the vicinity of the main river estuaries, where R is dominant. However, there are two main regions where deep water masses are formed and merge to become the MOW. The Western Mediterranean Deep Water (WMDW) is formed south of the Gulf of Lion located in the northern part of the western basin. This water mass has a characteristic salinity of 38.44 g kg−1 and a temperature of 12.9 °C (Bryden and Stommel, Citation1982; Gascard and Richez, Citation1985). The second important convective water mass, the Levantine Intermediate Water (LIW), is formed in the eastern Mediterranean basin in the region between Rhodes and Cyprus. In this source region this water mass is characterised by T ∼ 16 °C and g kg−1, however, once it reaches the western basin it becomes less warm (T ∼ 14 °C) and saline (
g kg−1). Both the WMDW and the LIW merge in the Alboran Sea forming the MOW with a mean temperature of 13 °C and a salinity greater than 38.4 g kg−1 (Talley, Citation1996; Tanhua et al., Citation2013).
The MOW flows to the Atlantic Ocean through the Strait of Gibraltar where the overflow waters debouch following the continental slope in the Gulf of Cadiz and entrains with the overlying North Atlantic Central Water (NACW). The high density contrast with the NACW keeps the overflow attached to the continental slope. At an approximate depth of 900 m the overflow reaches a neutral buoyancy surface and detaches from the slope. As a consequence of the detachment, the MOW forms a saline tongue which spreads westward and fills the entire North Atlantic central basin at intermediate depths (Price et al., Citation1993; Baringer and Price, Citation1997).
2.2. Wind patterns, E–P–R and MOW properties
For interannual or longer time scales, the MOW properties are strongly linked to changes in wind patterns (mainly in the vicinity of the SoG) and E–P–R patterns.
The wind patterns do not directly change the properties of the MOW but they contribute to modulate the inflow (outflow) through the SoG (Boutov et al., Citation2014). The principal wind pattern in the region close to the SoG is characterised by strong easterly winds, which control the inflow of Atlantic waters into the Mediterranean. An anomaly of the wind pattern both in direction and strength has an impact on the inflow waters. If the net freshwater flux does not change and assuming volume conservation in the basin, an increase (decrease) of the inflow generates an increase (decrease) of the outflow. An example of an anomaly in the wind pattern was observed during 2001 when strong westerlies were measured at the SoG during nine consecutive months. As a result, a significant increase in the inflow was measured. The anomalous outflow brought denser and more saline water to the North Atlantic, hereby increasing the density contrast of the MOW with the surrounding waters in the central Atlantic (Béranger et al., Citation2005; Ruiz et al., Citation2013; Boutov et al., Citation2014).
The variability of E–P–R is the fundamental mechanism for the formation of dense waters and, hence, the MOW. It is driven mainly by changes in E and P over the basin (Boutov et al., Citation2014). The contribution of runoff cycles can be neglected for the time scales considered in this study. Both the variability of the wind patterns and the E–P–R are linked to atmospheric pressure fluctuations in the North Atlantic.
2.3. Contribution of atmospheric pressure fluctuations to the MOW variability
Two important regimes can be distinguished in the North Atlantic (Vautard, Citation1990). The leading regime, which explains almost 30% of the atmospheric fluctuations, is associated with the NAO. This is characterised by a high-pressure system near the Azores islands (Azores High) and a low-pressure system in the vicinity of Iceland (Icelandic Low). The meridional pressure gradient between the two systems sustains westerly winds in the region which vary depending on the strength of the gradient. Weak westerly winds, as a result of a weaker meridional pressure gradient between the two systems, favour wetter conditions in the Mediterranean region. The other regime is related to the Scandinavian Blocking and explains 15% of the atmospheric variability. This blocking event is associated with a strong anticyclone system in northern Europe that deviates wet air masses southwards towards the Mediterranean region.
A combination of the low phase of the NAO (weak westerlies) and a strong Scandinavian Blocking will induce an anomalous increase of precipitation over south Europe. Less dense water will be formed reducing the density contrast with the North Atlantic waters. However, the low phase of the NAO is also associated with an increase in the westerly winds, which yields an anomalous inflow and outflow, and, as previously described, dense water from the deep Mediterranean will leave the basin. The Scandinavian Blocking responsible for changes in the meridional circulation pattern has a smaller effect on the control of the inflow/outflow rates at the strait (Vautard, Citation1990; Boutov et al., Citation2014).
2.4. Influence of the MOW on the North Atlantic
The direct or indirect contribution of the MOW to the formation of deep water in the Nordic seas has been widely discussed in the literature (Reid, Citation1979; McCartney and Mauritzen, Citation2001; Lozier and Stewart, Citation2008). The original hypothesis presented by Reid (Citation1979) proposed an eastern boundary current along the continental slope bringing the MOW northward. The isopycnal surface that passes through the core of the MOW becomes shallower from a depth of 1000 m in the vicinity of the Gulf of Cadiz to 150 m near the Iceland-Scotland ridge with threshold depth of 300 m. As a result, these warm and very saline waters can flow into the Nordic Seas. In a more recent study (McCartney and Mauritzen, Citation2001), the hypothesis of a MOW intrusion of this type was discarded. These authors claimed that the warm and saline waters observed in the North Atlantic are transported by the North Atlantic current from the subtropical regions and distributed into the Labrador and Nordic Seas by the subpolar gyre. The two opposing conjectures were brought together by Lozier and Stewart (Citation2008) who proposed a varying Norwegian-Sea intrusion of the MOW driven by the NAO. The weakening of westerly winds associated with the low phase of the NAO contributes to a zonal contraction of the subpolar gyre. A narrower gyre would allow an northward intrusion of the MOW. The opposite phase strengthens and displaces the subpolar gyre blocking the eastwards penetration of the MOW.
3. Method, model and data
3.1. Method
In this analysis, we will consider the Mediterranean Sea, a semi-closed system which can exchange volume with the North Atlantic through the SoG and with the atmosphere through surface freshwater fluxes. The net volume transport through the SoG can be described by the following relation:
(1)
(1)
where
is the net volume transport (in Sverdrups, 1 Sv
m3 s−1), which is defined as the difference between the inflow, Qin, and outflow, Qout;
is the volume change in the Mediterranean basin, and
is the net surface freshwater flux (see ). Similarly, the net salt transport,
, given in kt s−1 (1 kt
kg) can be calculated from the following equation:
(2)
(2)
where
and S1 are the means of the salt transport and salinity of the inflow (
and S2 for the outflow), and ρ0 is the density of the sea water. The r.h.s. term of EquationEquation (2)
(2)
(2) describes the time change in the total salt content of the Mediterranean Sea. For longer time scales, both the total volume and the total salt content inside the basin are assumed constant (
). Any change of the outflow-water salt content is due to changes in the properties of the inflow or water fluxes at the surface of the basin. Under these assumptions, EquationEquations (1)
(1)
(1) and Equation(2)
(2)
(2) are reduced to the Knudsen (Citation1900) relations:
(3a)
(3a)
(3b)
(3b)
3.2. Model and data
The results of this study are based on a pre-industrial simulation performed with version 2.2 of the Earth system model EC-Earth. This implementation of the model includes an atmosphere-land surface module coupled to an ocean sea-ice module (Hazeleger et al., Citation2010, Citation2012). The ocean general circulation model NEMO version 2 (Madec, Citation2008) is used with the ORCA1 configuration. This consists of a tripolar grid with a 1° horizontal grid resolution, increased to a third of a degree in the equatorial regions. The water column is divided into 42 levels, the vertical resolution increasing monotonically from 5 m near the sea surface to 500 m in the deep ocean. The bottom topography is described by a partial step representation. The horizontal resolution is not eddy permitting, hence the effects of sub-gridscale processes, such as mesoscale eddies, are represented by an isopycnal parametrisation (Gent and McWilliams, Citation1990) and the vertical mixing is described using a turbulent kinetic energy closure scheme (Blanke and Delecluse, Citation1993). The representation of the spreading of dense water is described following the scheme of Beckmann and Döscher (Citation1997) that introduces a diffusive bottom layer scheme that increases the diffusivity between bottom grid boxes.
Two main limitations emerge from the coarse horizontal resolution: (1) the ocean eddies are not resolved by the ocean model and must be parameterised; (2) the SoG is taken to be six times wider than in reality (about 90 km in ORCA1 versus the real 14 km). In order to resolved and represent more realistically the transport through a narrow strait in the model; an artificial, highly viscous boundary layer is introduced that yields reduced transport through the strait (Madec, Citation2008).
All modelling was undertaken with a 1-h time step and the ocean-atmosphere coupling every 3 h. The pre-industrial simulation was the continuation of a 440 year long initial spin-up run with present-day forcing and a greenhouse-gas concentration fixed at, 1850 values following the guidelines of the Coupled Model Intercomparison Project 5 (CMIP5, Taylor et al., Citation2012), for more details see Hazeleger et al. (Citation2012) and Sterl et al. (Citation2012). The first 200 years of the 500 years pre-industrial simulation were excluded from the forthcoming analysis to avoid any possible signal from the spin-up run.
The dataset obtained from the simulation consists of annual mean values of water temperature T, salinity S, and current velocities u and v. Furthermore, the surface wind stresses τx and τy as well as the net freshwater flux are also included in the dataset. The multidecadal variability is strongly linked to low-frequency phenomena. The signal of these processes is relatively small compared with those produced by high-frequency phenomena, but the choice of annual mean data removes the high-frequency signal generated by e.g. tides or baroclinic eddies. However, this filtering also removes the effects of the high-frequency component of the wind stress at the sea surface which has an important role for the MOW variability.
4. Results and discussion
4.1. The MOW representation in the model
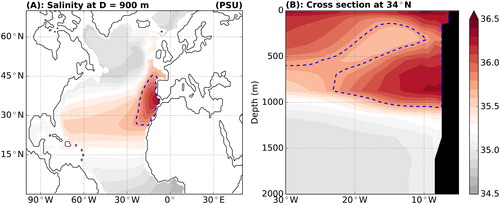
The mean salinity field at 900 m is shown in . The salinity maximum is localised near the SoG with S PSU. The cross section at 34°N showing the saline tongue spreading away from the continental shelf is shown in . If we define the core of MOW as the region with S > 35.75 PSU (blue dashed contours), it covers an area between 26°N and 45°N, and it extends from the eastern boundary to almost 25°W. The location, extension and salinity values of the MOW are similar to observations and outputs from other models. Our results showed a shallower and slightly more saline MOW compare to the results in Lozier and Sindlinger (Citation2009).
Fig. 2. (A) The mean salinity field at a depth of 900 m. The interval between 2 contour lines is 0.1 PSU. (B) Cross section at 34°N showing the saline tongue spreading away from the continental shelf. The core of the MOW is located at around 900 m deep where the average salinity is about 36.3 PSU. The blue dashed contour lines represent the 35.75 PSU isohaline.
4.2. The MOW signal on the leading EOF
The first EOF at a depth of 900 m for the salinity field in the Atlantic basin (including the Mediterranean and Black Sea) is shown in . The spatial distribution of the leading regime is characterised by a strong signal in the eastern Atlantic and explains 69% of the total variability. This region coincides with the maximum salinity area at the same depth. For comparison, the isohalines for 35.5, 35.75 and 36 PSU are displayed (red contours). The isohalines are taken from the mean salinity field over 300 years. The principal component (blue solid line in ) is compared to the salinity evolution at 34°N 14°W (orange line), this location given in the map by a red star. Both time series are normalised by removing the mean values and dividing by their standard deviations.
Fig. 3. EOF analysis of the salinity field at a depth of 900 m. (A) The spatial pattern of the leading EOF explains 69% of the variability in the selected region (N. Atlantic + Mediterranean Sea). The highest variability is confined to the high salinity area in the eastern North Atlantic, especially in the vicinity of the Gulf of Cadiz. The red contours represent the isohalines for 35.5, 35.75 and 36 PSU. (B) The corresponding time series to the leading EOF (blue line) is compared to the salinity evolution at 34°N 14°W at the same depth (orange line). This particular location is given by the red star in the map.
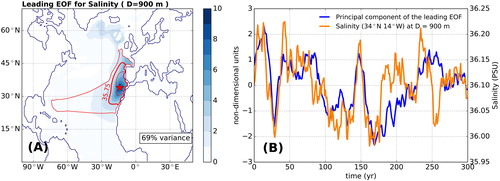
The spatial distribution of the leading state agrees with the location of the MOW. Furthermore, the large percentage of the explained variability highlights the importance of the outflow for the North Atlantic. The associated principal component shows a high correlation with the salinity evolution in the core of the MOW.
4.3. Volume budget
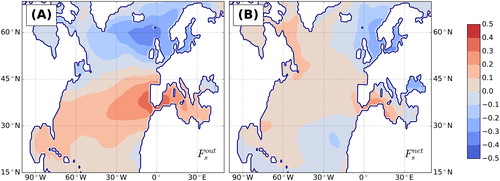
The 10-year running mean of the net SoG volume transport (black solid line) and the integrated E–P–R over the basin (green solid line) are shown in . The mean transport through the SoG, , is 0.023 Sv with a standard deviation of 0.004 Sv. Similarly the mean net freshwater flux integrated over the basin,
, is 0.023 Sv with a standard deviation of 0.003 Sv. The yearly mean netflow described by the grey solid line shows a large variability from year to year from high values around 50 mSv to values near 0 Sv. For time scales greater than 2 years, the residual term, given by
in EquationEquation (1)
(1)
(1) , only represents a very small contribution (
) mSv) and can be considered negligible.
Fig. 4. (A) The net volume transport, , through the Strait of Gibraltar (blue line) defined in EquationEquation (1)
(1)
(1) and the net evaporation, E–P–R, integrated over the Mediterranean basin. The time series have been smoothed with a 10-year running mean filter. The grey solid line represents the yearly mean time series for the net flow. (B) Climatology of the net evaporation over the schematic representation of the Mediterranean region.
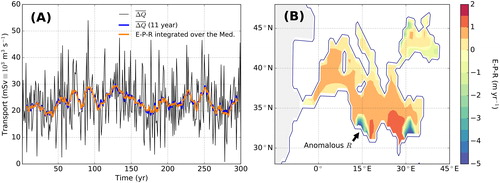
The climatological pattern of is displayed in . These results confirmed that the Levantine Sea in the eastern basin and the southern Gulf of Lion are the areas with maximum
. Contrary to what is stated in the literature (Boutov et al., Citation2014), the contribution and the variability of the river runoff, R, were found to be of the same order of magnitude as the
(not shown). In the model, an anomalously strong and artificial river discharge at the coast of Libya generated an overestimation of R in the basin. This anomaly is a result of an artefact of the model and needs to be taken into account to understand the obtained results. On one hand, the overestimation of R will have an effect on the volume budget (EquationEquations 1
(1)
(1) and Equation3a
(3a)
(3a) ) of the Mediterranean basin as the net freshwater flux to the atmosphere will be reduced. This will have an impact on the net transport,
, through the SoG but not necessarily on the inflow, Qin, and outflow, Qout. On the other hand, an anomalous freshening of the surface may affect the formation and properties of deep waters in the basin. However, the area with the anomalous R is not in the vicinity of the deep water formation regions and a small effect will be assumed in the following.
4.4. Salt budget
Time series of the net salt transport through the SoG are shown in . The grey solid line describes the yearly net salt transport, , while the black solid line describes the 10-year running mean,
. Positive transports (from the Atlantic to the Mediterranean) are indicated by the red-shaded areas, negative (from the Mediterranean to the Atlantic) are given in blue. The mean value of
is 0.006 kt s−1 with a standard deviation of 0.203 kt s−1.
Fig. 5. The total salt transport through the Strait of Gibraltar from the EC-Earth pre-industrial run (solid grey line). The black solid line represents the 10-year running average. The red (blue) shaded areas represent years where the Mediterranean Sea imports (exports) salt from (to) the Atlantic.
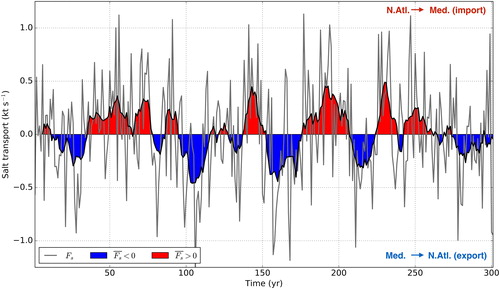
The small mean value of the salt transport describes a situation nearly conforming the Knudsen relation (EquationEquation 3b(3b)
(3b) ), where the input salt transport is compensated by the output transport keeping the total salt content in the basin constant, cf. EquationEquation (2)
(2)
(2) . For shorter time periods, where there is a net inflow or outflow of salt, the contribution to the total salt content of the Mediterranean basin is too small. Over a period of 10 years an average salt transport of 0.5 kt s−1 will contribute with
kg of salt. This result is three orders of magnitude smaller than the total salt content. Therefore, even for shorter time scales the Knudsen relation holds. The time series shows two well-defined states, one with positive transports where the Mediterranean imports salt from the Atlantic, and another where the Mediterranean exports salt to the Atlantic. The system alternates between the two states with a period from a few years up to few decades. These results suggest the possibility of the Mediterranean Sea acting as a temporal storage of salt. These changes in the salt transport could be due to different factors; e.g. an anomalous saline inflow into the basin and/or a weak dense-water formation due to atmospheric conditions favours the positive salt transport and hence the import of salt to the Mediterranean Sea.
Time series for the inflow and outflow were also computed and compared to the salinity variability at the core of the MOW outside the Gulf of Cadiz (34°N 14°W) at a depth of 900 m. Although these results are not represented here, the salinity of the MOW core showed a weak correlation with the net salt transport (r = 0.27) and one even weaker with the outward salt transport (r = 0.12).
4.5. Atmospheric patterns and their effect on MOW properties
Long-term fluctuations of zonal winds are a consequence of a change in the atmospheric regimes (see Section 2). The results showed a significant correlation (r = 0.46) between the outflowing salt transport and the zonal winds (expressed in this study as wind stress) in the Iberian region, cf. . This behaviour confirmed the importance of zonal winds which control the baroclinic component (inflow/outflow) of the transports through the SoG. Moreover, a dipole pattern was observed between the central Atlantic (with a maximum near Iberia) and the North Atlantic (with a maximum south east of Iceland). This pattern and the observed low frequency of the net salt transport suggested the influence of long term atmospheric processes such as the NAO. In the case of the net salt transport (), we observed a lower correlation with the wind field. The spatial distribution in this case is not as clear as for the former case. The negative correlation area over the Scandinavian region may suggest the influence of the Scandinavian blocking that has an effect on the precipitation pattern affecting the deep water formation.
Fig. 6. Correlation map of the zonal wind and the outflow (A) and net (B) salt transport. The spatial distribution for the former shows a dipole pattern, with a maximum in the vicinity of the Gulf of Cadiz and a minimum south of Iceland. This characteristic pattern suggests a NAO footprint.
The net flow is significantly correlated to ;
. However, this correlation is much weaker when the salt transport through the SoG is analysed, viz.
. Simultaneously, a very low and non-significant correlation was found between the net freshwater flux and the salinity profile in the core of the MOW.
4.6. Effect on the AMOC
As discussed in Section 2, the MOW can precondition the transformation of surface waters into deep waters in the Nordic Seas. The intrusion of MOW in these basins is determined by the atmospheric fluctuations which control, on one hand, the penetration of dense water in the region and, on the other hand, the properties and the strength of the SoG outflow. The impact of the outflow salt transport on the meridional volume flux in the North Atlantic is displayed in . The streamlines define the climatological AMOC which describe the transport of upper-level waters towards high latitudes and their transformation into dense deep waters.
Fig. 7. (A) Correlation between the meridional volume flux in the North Atlantic and the outward salt transport, , through the Strait of Gibraltar (SoG). The black contour lines represent the mean overturning stream function and the red dashed line corresponds to the latitude of the SoG. Streamline intervals are 2 Sv. (B): the maximum AMOC at 36°N (blue line) and the outward salt transport,
, through SoG (orange line). A 10-year running average has been applied to both lines. Please notice the inversion of the y axis for the salt transport.
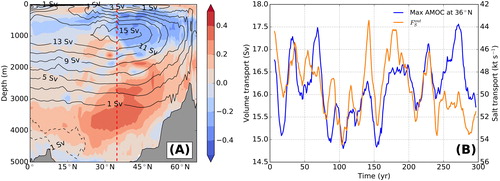
The results showed an area of negative correlation in the upper-level region and north of the SoG (red dashed line) where the volume flux is poleward. Therefore, a positive anomaly of is linked to a reduction of the poleward volume transport in the upper-levels. As a consequence of the reduction of the northward transport there is an adjustment in the equatorward volume fluxes at deeper depths (positive correlation area). This adjustment in the volume flux has an effect in the accumulative volume transport described by the AMOC, where a negative correlation was observed between the maximum AMOC at 36°N and the outflow salt transport, see . The correlation minimum was observed when no time lag was applied in the analysis. This instantaneous response was a consequence of the fast adjustment of the overturning circulation. Fast adjustment is defined in this study as any response with time scales shorter than a year.
We speculate that the NAO is the mechanism behind the negative correlation between the AMOC and . A positive anomaly in the outward salt transport could be a consequence of a salinification of the outflow waters or a baroclinic response to changes of wind patterns in the vicinity of the SoG. The salinification process is related to changes in the E–P–R over the Mediterranean Basin. Drier and warmer conditions in the region are associated to the positive phase of the NAO; however, the positive phase is also linked to a strengthening of the AMOC as it enhances the deep water formation in the Nordic Seas (Delworth and Zeng, Citation2016). The negative phase of the NAO increases the winds in the vicinity of the SoG, increasing the inflow of Atlantic waters in the Mediterranean Sea and hence the outflow. The NAO- is also linked to a weaker AMOC. Moreover, the negative phase of the NAO allows a pathway of the MOW into the convection areas in the Nordic Seas (cf. Lozier and Stewart, Citation2008; Lozier and Sindlinger, Citation2009). The direct effect of the intrusion of MOW into the convection areas in the Nordic seas, however, has not been studied in this work.
Our results suggest that the second mechanism, a change in the wind pattern, is dominant over the salinification of the deep waters in the Mediterranean Sea due to its faster adjustment time. This would explain the negative correlation between the salt transport and the AMOC, and the correlation map with the meridional volume flux.
5. Conclusion
The multidecadal variability of the MOW and its direct and indirect effects on the North Atlantic were studied. All the analyses were based on outputs from the climate model EC-Earth run under pre-industrial conditions. An EOF decomposition of the salinity field at a depth of 900 m (characteristic of the MOW) revealed that precisely the region where these outflow waters can be found described the leading mode. This mode explained 69% of the variability in the selected region (N. Atlantic + Mediterranean Sea). The associated time series (principal component) of the first EOF showed a variability on the order of decades. Different sources and processes that affect the variability, such as the volume and salt transport through the SoG, the net freshwater fluxes over the Mediterranean basin or the wind stress in the North Atlantic have been examined.
The total salt transport through the SoG described a two-state regime, one where the Mediterranean exports salt to the Atlantic ocean, and a reverse case where salt is imported from the Atlantic. The variability of this process is on the order of few years to few decades, which suggests the effect of low-frequency mechanisms. According to the modelled results, the Mediterranean not only acted as a source of dense waters but also as a temporal storage of salt. The implications of these results are not entirely clear.
A low correlation was found between the wind patterns in the vicinity of the SoG and the net freshwater flux in the Mediterranean region. Nonetheless, the results highlighted the role of zonal winds rather than the net evaporation for the SoG salt transport. The relation between the net evaporation and the salinity changes in the main core of the MOW (36°N 10°W) was found to be very weak, and hence insignificant. We can conclude that the atmospheric fluctuations in the region partly controlled the net salt transport through the SoG, but they do not constitute the mechanism behind the fluctuations of the MOW. The effect of the outflow salt transport on the AMOC was also investigated, and a negative correlation was found. The main effect of the variability of the salt transport is localised primarily north of the SoG. The negative phase of the NAO seems to play a role linking the strengthening of the outward salt transport at SoG and the weakening of the AMOC. These interactions of the Mediterranean outflow with AMOC raise the possibility of feedback mechanisms between the North Atlantic, the Mediterranean, and the atmospheric circulation in the region.
Acknowledgements
We thank Sara Berglund for discussions and constructive comments.
Disclosure statement
No potential conflict of interest was reported by the authors.
Additional information
Funding
References
- Artale, V., Calmanti, S., Malanotte-Rizzoli, P., Pisacane, G., Rupolo, V. and co-authors. 2006. The Atlantic and the Mediterranean Sea as connected systems. In: Developments in Earth and Environmental Sciences (eds. P. Lionello, P. Malanotte-Rizzoli and R. Boscolo) Vol. 4, Elsevier, Amsterdam, The Netherlands, pp. 283–323.
- Baringer, M. and Price, J. 1997. Mixing and spreading of the Mediterranean outflow. J. Phys. Oceanogr. 27, 1654–1677. doi:2.0.CO;2.
- Beckmann, A. and Döscher, R. 1997. A method for improved representation of dense water spreading over topography in geopotential-coordinate models. J. Phys. Oceanogr. 27, 581–591. doi:10.1175/1520-0485(1997)027<0581:AMFIRO>2.0.CO;2
- Béranger, K., Mortier, L. and Crépon, M. 2005. Seasonal variability of water transport through the Straits of Gibraltar, Sicily and Corsica, derived from a high-resolution model of the Mediterranean circulation. Prog. Oceanogr. 66, 341–364. DOI:10.1016/j.pocean.2004.07.013.
- Blanke, B. and Delecluse, P. 1993. Variability of the tropical Atlantic Ocean simulated by a general circulation model with two different mixed-layer physics. J. Phys. Oceanogr. 23, 1363–1388. DOI:10.1175/1520-0485(1993)023<1363:VOTTAO>2.0.CO;2.
- Boutov, D., Peliz, Á., Miranda, P. M. A., Soares, P. M. M., Cardoso, R. M. and co-authors. 2014. Inter-annual variability and long term predictability of exchanges through the Strait of Gibraltar. Glob. Planet. Change 114, 23–37. DOI:10.1016/j.gloplacha.2013.12.009.
- Bryden, H. L. and Stommel, H. M. 1982. Origin of the Mediterranean outflow. J. Mar. Res. 40, 55–71.
- Delworth, T. L. and Zeng, F. 2016. The impact of the North Atlantic Oscillations on climate through its influence on the Atlantic meridional overturning circulation. J. Climate 29, 941–962. DOI:10.1175/JCLI-D-15-0396.1.
- Gascard, J. C. and Richez, C. 1985. Water masses and circulation in the western Alboran Sea and in the Straits of Gibraltar. Prog. Oceanogr. 15, 157–216. DOI:10.1016/0079-6611(85)90031-X.
- Gent, P. R. and McWilliams, J. C. 1990. Isopycnal mixing in ocean circulation models. J. Phys. Oceanogr. 20, 150–155. DOI:10.1175/1520-0485(1990)020<0150:IMIOCM>2.0.CO;2.
- Hazeleger, W., Severijns, C., Semmler, T., Ştefănescu, S., Yang, S. and co-authors. 2010. EC-Earth: a seamless Earth-system prediction approach. Bull. Amer. Meteor. Soc. 91, 1357–1363. DOI:10.1175/2010BAMS2877.1.
- Hazeleger, W., Wang, X., Severijns, C., Ştefănescu, S., Bintanja, R. and co-authors. 2012. EC-Earth V2.2: description and validation of a new seam-less earth system prediction model. Clim. Dyn. 39, 2611–2629. DOI:10.1007/s00382-011-1228-5.
- Knudsen, M. 1900. Ein hydrographischer Lehrsatz. Ann. Hydrogr. Maritim. Meteorol. 28, 316–320.
- Lozier, M. S. and Stewart, N. M. 2008. On the temporally varying northward penetration of Mediterranean Overflow Water and eastward penetration of Labrador Sea Water. J. Phys. Oceanogr. 38, 2097–2103. DOI:10.1175/2008JPO3908.1.
- Lozier, M. S. and Sindlinger, L. 2009. On the source of Mediterranean Overflow Water property changes. J. Phys. Oceanogr. 39, 1800–1817. DOI:10.1175/2009JPO4109.1.
- Madec, G. 2008. NEMO, the Ocean Engine. Technical Report 27, Institut Pierre-Simon Laplace (IPSL).
- McCartney, M. S. and Mauritzen, C. 2001. On the origin of the warm inflow to the Nordic Seas. Prog. Oceanogr. 51, 125–214. DOI:10.1016/S0079-6611(01)00084-2.
- Price, J. F., Baringer, M. O., Lueck, R. G., Johnson, G. C., Ambar, I. and co-authors. 1993. Mediterranean outflow mixing and dynamics. Science 259, 1277–1282. DOI:10.1126/science.259.5099.1277.
- Reid, J. L. 1979. On the contribution of the Mediterranean Sea outflow to the Norwegian–Greenland Sea. Deep-Sea Res. 26A, 1199–1223.
- Ruiz, J., Macías, D., Rincón, M. M., Pascual, A., Catalán, I. A. and co-authors. 2013. Recruiting at the edge: kinetic energy inhibits anchovy populations in the western Mediterranean. PLoS ONE 8, e55523. DOI:10.1371/journal.pone.0055523.
- Sterl, A., Bintanja, R., Brodeau, L., Gleeson, E., Koenigk, T. and co-authors. 2012. A look at the ocean in the EC-Earth climate model. Clim. Dyn. 39, 2631–2657. DOI:10.1007/s00382-011-1239-2.
- Talley, L. D. 1996. North Atlantic circulation and variability, reviewed for the CNLS conference. Physica D 98, 625–646. DOI:10.1016/0167-2789(96)00123-6.
- Tanhua, T., Hainbucher, D., Schroeder, K., Cardin, V., Álvarez, M. and co-authors. 2013. The Mediterranean Sea system: a review and an introduction to the special issue. Ocean Sci. 9, 789–803. DOI:10.5194/os-9-789-2013.
- Taylor, K. E., Stouffer, R. J. and Meehl, G. A. 2012. An overview of CMIP5 and the experiment design. Bull. Amer. Meteor. Soc. 93, 485–498. DOI:10.1175/BAMS-D-11-00094.1.
- Vautard, R. 1990. Multiple weather regimes over the North Atlantic: analysis of precursors and successors. Mon. Weather Rev. 118, 2056–2081. DOI:10.1175/1520-0493(1990)118<2056:MWROTN>2.0.CO;2.
- Wu, W., Danabasoglu, G. and Large, W. G. 2007. On the effects of parameterized Mediterranean overflow on North Atlantic ocean circulation and climate. Ocean Modell. 19, 31–52. DOI:10.1016/j.ocemod.2007.06.003.