
 ?Mathematical formulae have been encoded as MathML and are displayed in this HTML version using MathJax in order to improve their display. Uncheck the box to turn MathJax off. This feature requires Javascript. Click on a formula to zoom.
Abstract
Changes in the climate and weather conditions, as well as rising earth’s average temperature are likely to escalate deterioration of global drought occurrence. Drought is considered an interwoven natural disaster composed by a number of different factors, as for example agricultural, meteorological or hydrological. Hydrological drought estimation with regional accuracy is the most problematic and challenging issue. In order to monitor and characterize drought conditions, using Standardized Drought Indices (SDI) is recently the most frequently used practice. In this research article, we suggest an improved hydrological drought index that incorporates upgraded monthly rainfall estimation records, which play an important role in defining regional drought conditions, with regard to the global temperature rise. Rainfall is highly changeable even at a low distance and therefore should be also considered in precipitation estimation records because temporal rainfall records play a significant role in determining long-term rainfall shortages. Thus, the integration of regional aspect to the amount of rainfall is essential for accurate regional drought assessment. This research article proposes adding auxiliary data such as regional weights in order to make monthly rainfall records more accurate in relation to the dependency characteristics of temperature and rainfall records under regression and product estimation settings. Subsequently, we propose an innovative method of hydrological drought evaluation, a so-called Regionally Improved Weighted Standardized Drought Index (RIWSDI). We evaluated hydrological drought with the usage of RIWSDI at seven various meteorological regions situated in climatologically different areas in Pakistan. We assessed and compared the results using RIWSDI, Standardized Precipitation Index (SPI) on 3 and 12-month interval period on the basis of Pearson correlation. Under both parametric and non-parametric standardization, we discovered that there is a high positive correlation between RIWSDI and current methodology (SPI). To sum up, we proved that the upgraded estimations of rainfall are able to improve systems for monitoring droughts.
1. Introduction
Drought is a complicated natural phenomenon that occurs basically due to the lack of precipitation over a time period. And its occurrence usually results in great costs on various parts of nature and society. Drought is usually believed as a prolonged lack of precipitation. A worldwide definition based on precipitation quantity and period is: A drought implies that a spot has less precipitation (rain or snow) than ordinary over a couple of months or significantly more or drought is usually a situation of adversity because of the insufficient water due to surprising meteorological conditions. It could be categorized into disparate types such as; Meteorological, Hydrological, Agricultural and Socio-economic. Meteorological drought is related to precipitation for assessing dryness and dry period for a specific region where average precipitation may diverge spatially. Hydrological drought occurs when stream flow, reservoir, soil moisture, groundwater recharge, and lake levels are affected due to a decrease in precipitation. Agricultural drought occurs when there is not sufficient moisture to maintain average crop production for specific land area. Socioeconomic drought relates to the supply and demand of some economic goods with fundamentals of hydrological, meteorological, and agricultural drought. Climate and weather conditions in Pakistan differ across its large territory primarily due to the variety of altitude, longitude and latitude, wind flows and distance from the sea. A number of climate classification schemes have been introduced to account for spatial variability. One of the distinguished is the Köppen-Geiger scheme (Kottek and Rubel, Citation2007; Peel et al., Citation2007), which on the basis of precipitation and temperature separates climate into five classes, such as polar and alpine, continental, mild, dry and tropical climate. Since the late 20th century, a trend of so-called global warming can be observed around the world (Hansen et al., Citation2010; Rohde et al., Citation2013). Continuance of the trend is expected by numerous climate models under most emission scenarios and concentration pathways, which calculate the rise of the surface temperature between 0.7 and 2.4 °C by the year 2050 in comparison with the reference period of 1986–2005 (Collins et al., Citation2013). Field et al. (Citation2012) assumes that the rise of overall temperature might cause unprecedented climate disasters (such as droughts and floods). Few severe droughts occurring in the early 21st century are supporting this presumption, as for example the 2010 drought in Australia (Cai et al., Citation2014), the 2011 drought in southern China Sun and Yang (Citation2012) and the 2011–2012 drought in the USA (Seneviratne et al., Citation2017).
Several further environmental factors are engaged in the occurrence of drought, such as temperature, wind flows, relative humidity and intensity, duration and severity of rain (Wilhite et al., 1994). However, the long term precipitation and temperature factors play the leading role in methods for calculating drought indices (Coffel and Horton, Citation2015). In recent decades, the frequency, intensity and influencing area of the drought have significantly increased, which have drawn the attention of many researchers. It was mainly caused by climate changes and human activities.
Not only precipitation and temperature on a global level but also their regional distribution is of high importance for accurate monitoring of climate changes and other natural disasters. Furthermore, the documentation of rainfall and its regional distribution is one of the main responsibilities of the governmental meteorological department. Therefore, it is essential to track drought conditions with the use of regional statistics and data. Moreover, accurate regional precipitation estimates are indispensable for a wide range of research fields, such as hydrology, meteorology and others. Understanding of drought characteristics on a regional level is necessary for mitigating drought risks, moderating potential impacts on various socio-economic sectors and adopting proper measures and strategies (Hirabayashi et al., Citation2008; Svoboda et al., 2016).
Spatial distribution of precipitation and temperature belong to the major watershed factors playing a significant role in advanced hydrological researches. Consequently, taking into account the intricacy of the temporal structure of the regional climate, several authors Coles and Tawn (Citation1991), Guler et al. (Citation2007) and Mahdian et al. (Citation2009) jointly constructed two methods based on geospatial tools and advanced statistical models. Yet, those techniques are built on temporal data collected from single stations, which means that it only covers a single realization at a continuous spatial domain. That deprives the findings of those methods from the effect of spatial prevalence in climate. Additionally, increased the uncertainty of the prediction might have negative consequences on climate shifts policies and reliability of environmental, climate and weather conditions prognoses. Therefore, the incorporation of regional rainfall records combined with the temperature already at the entry stage might provide a substantial contribution to the accuracy, efficiency, and reliability of drought moderation policies. A regional rainfall may be defined as ‘the average of all stations’ rainfall (monthly/annually) in a region’.
However, contemporary advances in estimation methods which add auxiliary variables are accessible in sampling theory and environmental statistics. Cochran (Citation2007) proposes comprehensive theory and methods connected to the usage of auxiliary data in order to improve the assessment of unknown features of unsystematic variables. Several other researchers also incorporate additional supplementary data to enhance the estimation of an examined variable under auxiliary information based statistical methods such as regression and kriging (Zhu and Lin, Citation2010). Paloscia et al. (Citation2013) works with Australian Landsat images having Landsat (path = 92/row = 84) that are similar to ENVISAT data in order to observe the effects of auxiliary information on vegetation. Apaydin et al. (Citation2011) deals with altitude as a basis of auxiliary data connected to climatic inputs (precipitation and temperature) for interpolation under co-kriging settings.
Keeping in mind the significance of auxiliary information in an estimation procedure, the aim of this research article is to incorporate and apply regional temperature as auxiliary information in the process. By regional temperature we mean the average of all stations’ monthly mean temperature of a region. We propose another drought index, its framework is constructed on the basis of regional temperature used as an auxiliary variable to improve the accuracy and reliability of average precipitation estimates. Calculated precipitation values are further utilized to acquire Standardized Drought Index (SDI) values (Ali et al., Citation2019). In contrast, temperature and rainfall can be perceived as global representatives of a specific natural homogenous optimized regional catchment area. Thus, using regional temperature as the auxiliary information might improve the validity of precipitation data.
Although hydrological characteristics of droughts have been examined broader than ecological and socio-economic aspects, deeper understanding of hydrological aspects of drought is still necessary to assess potential effects of drought more precisely and to design and implement adequate and effective moderation measures. In this regard, further research on drought conditions taking into account hydrological and regional disparity factors seems crucial. Indeed, regional spatial variability of drought affects the definition of the drought itself. As Yevjevich (Citation1967) indicates, the term ‘drought’ can be used for a large covered area together with a long term severe deficit of water, whereas expressions as ‘water shortage’ or ‘deficit’ describe occasions with less harmful impacts. Ali et al. (Citation2019) proposed Locally Weighted Standardized Drought Index (LWSDI). They utilized auxiliary information as a local weight for the improvement of monthly precipitation record. Ali et al. (Citation2019) used regression estimator as a tool to incorporate auxiliary information in the study variable. One disadvantage is that they didn’t cover the scenario for the negative correlation between actual rainfall and average temperature (auxiliary variable). And the other disadvantage is that they improved only the specified stations but not all the regions of Pakistan. Our study is designed to cover all the disadvantages in a precise manner.
Moreover, growing vulnerability and dependence of a high-quality agricultural production on the accessibility of water and the development of large-scale multi-purpose water-supply systems indicate the fact, that the analysis of drought only at a single station is insufficient and a regional scale would be more beneficial. Lastly, the necessity for working with the whole array of existing regional data in measuring stations has arisen and it can be similarly used in different kinds of hydrological researches (e.g. flood analysis) as well. Historically it has been recorded that almost all Pakistani provinces faced repeated droughts: Khyber Pakhtunkhwa (KPK) in 1902 and 1951; Punjab province in 1899, 1920 and 1935 and Sindh province in 1871, 1881, 1899, 1931, 1947 and 1999 (Drought Bulletin of Pakistan, Citation2015). Therefore, it is necessary to assess the regional impact of drought on a particular area in order to better understand the situation and subsequently adopt appropriate measures.
There are numerous number of estimation procedures such as product, regression and ratio estimators, which integrate complementary information on single/multiple auxiliary variables. Detailed overview, as well as the mathematical structure of regression, product and ratio estimators can be found in (Cochran, Citation2007). In each respective method, validation of the proposed estimator depends on the incorporation of the auxiliary variables. For instance, when it is perceived that there is a negative correlation between study variable and auxiliary variable, then product estimator provides precise estimates for the population characteristics. On the contrary, when there is positive and perfect correlation then ratio estimator is useful. Preliminary applications based on the auxiliary information employed in 1973 Tarima and Pavlov (Citation2006), when Pugachev (Citation1973) incorporated the auxiliary information using correlation effects. As, in many surveys and records keeping modules, a collection of some extra information related to study variables are common practice. Ali et al. (Citation2019) proposed a new method for the assessment of drought-the Locally Weighted Standardized Precipitation Index (LWSDI). They used LWSDI on ten different stations having different regions of Pakistan. Different probability distributions have been used to calculate LWSDI. For each stations, the CDF of those distributions having smallest value of BIC, are then selected for standardization.
This research article suggests a new way to characterize annual drought conditions, in which precipitation data specified by the auxiliary variable are incorporated in Standardized Drought Index (SDI) process. Hereby we recommend adding a regional average of monthly temperature data as weights in order to improve dependent precipitation estimates under regression and product estimation settings. Thus, we are able to diminish the sampling defects in the projected rainfall quantity records and to take account of the global warming effect while monitoring the drought conditions.
This paper is organized as follows: Section 2 consists of materials and methods which includes the overview of the data, study area as well as methodology which provides a comprehensive exposition of the theoretical details behind the product and regression estimation, SPI, and RIWSDI. We also present the mathematical formula employing average temperature as auxiliary information under regional settings. Here we proposed a drought index employing improved precipitation estimates under parametric and non-parametric approaches. In Section 3, we will provide a detailed discussion and results on how we improved the precipitation estimates and used in SDI procedure. Here, some temporal plots showing the difference between simple and improved records will also be presented. Finally, a conclusion on the proposed method will be provided in Section 4.
2. Materials and methods
2.1. Data and study area
Pakistan is located in Southern Asia which is the junction of Middle East and Central Asia having 23°–37° N latitude and 61°–78°E longitude (Ahmed et al., Citation2018). It hosts the triple point (junction) of three world’s famous mountain ranges Karakoram, Hindukush and Himalayas in its north. Pakistan lies between 0 to 8611 m altitude. Mean temperature as well as precipitation data are considered as the climatic inputs in the current study. The highest precipitation (1038.6 mm) was recorded in Islamabad in July, 2001, and minimum precipitation record of (0 mm) in several regions were also observed during the study. There are both anthropogenic and natural reasons of change in the climate but earlier is the most leading with a constantly increasing trend since 1940 (the industrial revolution) (Anwar, Citation2011). Pakistan shares her border with four countries; in the west with Afghanistan and Iran, in the east with India, in the north with China, and the Arabian sea is located in the south of Pakistan. According to 2016 census, Pakistan has a total population of more than 200 million. Where typically most of the people concerned with agriculture sectors either directly or indirectly.
This research consists of seven meteorological regions, and these seven regions contains overall 50 stations, situated in different climatic regions of Pakistan. shows the chosen meteorological regions. Detailed clustering of the regions of Pakistan can be seen (Hussain et al., Citation2011). The map is generated through Geographic Information System (GIS). The proposed method, required a time series data of long-term monthly precipitations, as well as maximum and minimum temperatures. Consequently, a data ranges from January 1967 to December 2016 is obtained from – Karachi Data Processing Centre (KDPC) – via Pakistan Meteorological Department (PMD). The regions have significant high variability in rainfall and temperature during different seasons. reveals the statistics of the selected stations for 50 years (1967–2016).
Fig. 1. Map of the selected regions.
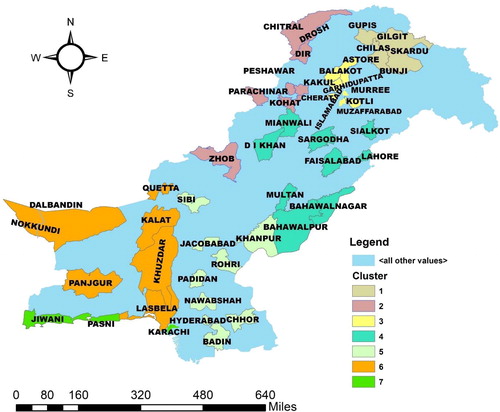
Table 1. Statistics of the selected stations.
2.2. Methodology
In order to assess and compute the comparative ascertainment of drought indices based on RIWSDI, secondary time series data of average temperature and monthly total precipitation (1967–2016) is used.
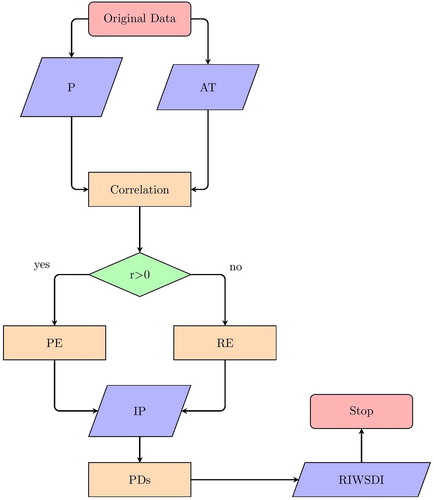
In the current study, we evaluate 32 probability distributions using an R package i.e. Propagate (Tellinghuisen and Spiess, Citation2014). Here, various types of fitness criterion e.g. Anderson-Darling, Kolmogorov-Smirnov and Chi-Square tests were used in order to figure out the candidate distribution among others, for each individual indicator. For standardization of each study region and all the stations included in the regions, a CDF of the distributions, having a minimum value of BIC, are subsequently selected. To portrait different results in tables some regions has been chosen randomly i.e. Region-1,3,6,7. In this research, we are handling the problem of updating and improving regional precipitation estimates. A step-by-step procedure can be observed from the flow chart by analyzing . Here, the average temperature is suggested as an auxiliary information. In previous work, various surveys indicate that there is a positive correlation between rain and temperature. Zhao and Khalil (Citation1993) examine the relationship between precipitation and temperature for eight regions including the USA. Their survey indicates that there is a positive correlation between these variables in all the seasons. At the Guliya ice core, detailed analyses of the precipitation index (glacier accumulation) and the temperature proxy recorded in since 300 years BP show that precipitation correlates with temperature in this region (Yang et al., Citation2006). Rajeevan et al. (Citation1998) found that temperature and rainfall were positively correlated during January and May but negatively correlated during July. Sneva (Citation1977) found a positive month-wise correlation between temperature and rainfall in southeastern Oregon.
Fig. 2. Flow chart. Precipitation (P), Average Temperature (AT), Correlation coefficient (r), Product Estimator (PE), Regression Estimator (RE), Improved Precipitation (IP), Probability Distributions (PDs).
As the temperature is a globally representative environmental variable and homogeneous in nature has a strong association with precipitation. Thus, the use of temperature as auxiliary data is logically valid. Here the auxiliary variable is the mean monthly temperature. The following equations were used to incorporate auxiliary information,
(1)
(1)
and,
(2)
(2)
In EquationEqs. (1)(1)
(1) and Equation(2)
(2)
(2)
and
are the updated regression and product means of the study variable respectively,
is the overall mean auxiliary variable of
station,
is the sample mean of the
month of the auxiliary variable. In EquationEq. (1)
(1)
(1)
is the regression slope between the study variable and auxiliary variable. After assessing theoretical support about the positive and negative correlations between precipitation and average temperature, this study suggests average temperature as a piece of auxiliary information to improve annual meteorological records of precipitation. So, before defining drought characteristics and precipitation deficient, we utilized the concepts of regression and product estimator to improve the annual estimates of precipitation using average temperature as auxiliary information. The mathematical structures of regression and product estimator employing monthly mean temperature as auxiliary information for the estimation of the total monthly amount of precipitation are as follows,
(3)
(3)
and,
(4)
(4)
where,
and
are the improved weighted precipitation estimates of mean using regression and product estimator respectively, for the improvement of original series of precipitation, where, simple precipitation records are weighted by the dependence characteristics of average temperature with precipitation. From EquationEqs. (3)
(3)
(3) and Equation(4)
(4)
(4)
and
is the mean precipitation and mean of average temperature of the
region, respectively, whereas
is the overall mean of the average temperature of a region for the
month. In EquationEq. (3)
(3)
(3) b1 is the regression slope between the study variable (precipitation) and auxiliary variable (average temperature).
2.2.1. Comparative statistics and quality measures
In this study, we encompass a well-known correlation statistic ‘Pearson Product-Moment Correlation coefficient r’, commonly called the correlation coefficient, for the comparison of the outcomes of our proposed index with that of existing indices. Correlation coefficient r is most widely used test statistic and measures the collinearity between two series. Formula for r is in EquationEq. (5)(5)
(5)
(5)
(5)
where, in EquationEq. (5)
(5)
(5) x and y representing the two series with n number of elements,
and
representing mean values of the two series. The range –1 to 1 contains the values of r. Positive values close to 1 indicates a strong positive correlation between two series, on the other hand negative values indicate an inverse correlation.
2.2.2. Methodology for standardized precipitation index (SPI)
The SPI is a common indicator of drought that does not require information about land surface conditions and needs only precipitation data to compute drought properties. According to McKee et al. (Citation1993) and Wu et al. (Citation2007), the SPI can be calculated in a given year ‘o’, a calendar month ‘p’ and for time scale q, by the following steps;
The long-term record of precipitation is fitted to a probability distribution, which is then transformed into a normal distribution.
The 1st step is the computation of the cumulative precipitation data,
for a period of interest p.
The 2nd step is to fit a cumulative probability distribution (commonly gamma distribution function), but in the current study different distributions have been applied. The PDF of gamma is defined as;
A cumulative probability distribution for the particular time scale and given month of the observed precipitations event,
The cumulative probability of each observed precipitation event xi can be derived by EquationEq. (7)
The distribution of precipitation may contain zeros. For instance, taking a special case of Gamma distribution, suppose the probability of all zero values in a time series of IWP(r,p) is denoted by q. Let m be the number of all zero values and n is the total number of observations contained in IWP(r,p) time series, therefore, q can be estimated by the ratio of m and n i.e. m/n,
As precipitation is not distributed normally, so an equiprobability transformation is done from the CDF of the mixed distribution to CDF of a standard normal distribution, with zero mean and variance 1, which is given by;
Because the SPI is normalized, wetter and drier climates can be represented in the same way, and wet periods can also be monitored using the SPI.
The 3rd step is to show the adequacy of the selected distribution, using some numerical or graphical methods.
The 4th step is to verify the normality of SPI using numerical or graphical techniques.
2.3. Proposing a hydrological drought index: regionally improved weighted standardized drought index (RIWSDI)
In this study, we used IWP(r,p) weights in the placement of generally simple precipitation series in the SDI technique. As the estimates IWP(r,p) are representative more regionally which encounter direct effect of maximum and minimum temperatures in the estimation stage. Consequently, the inclination of using IWP(r,p) estimates in place of simple precipitation records is logically adequate. Therefore, to achieve the SDI, follow the instruction of Stagge et al. (Citation2015) on the parametric standardization approach, the current study integrates the probability distributions, that fits well on the specified temporal series of IWP(r,p) estimates. Furthermore, this research incorporates different probability plotting (PP) methods for the assessment of the coherence and validity of IWP(r,p) estimates in non-parametric approach. The following are the brief descriptions of both the methods.
2.3.1. Parametric mechanism: selection of optimal probability distributions
In parametric approach, we arrange a list of different, 32 candidate distributions among various commonly available probability distributions. Although, the study suggests the probability distributions having multiple-parameters, for instance, in place of a Weibull and Gamma distributions having two-parameters, a goodness of fit must be applied to a four-parameter Weibull and three-parameter Gamma, respectively. Where the lowest value of Bayesian Information Criteria (BIC) Schwarz (Citation1978) indicates the optimal probability distribution.
In the experimental and computational analysis, we incorporate Tellinghuisen and Spiess (Citation2014) an r package to achieve the optimum probability distribution BIC for all SPI-3 and 12 – and RIWSDI-3 and 12. The study consist of 32 highly parametric distributions, for example; gumbel distribution, generalized extreme value, and generalized normal distribution, etc. Chi-square, Anderson Darling, and Shapiro Wilk tests are used for the nomination of the optimal distributions. Whereas, a Levenberg-Marquardt algorithm using minpack.lm Elzhov et al. (Citation2010) an r package, is used to estimate the parameters of each chosen distribution. Furthermore, the Cumulative Distribution Function (CDF) of the selected optimal distribution is then converted using the method in EquationEq. (9)(9)
(9) .
In researches related to hydrology, particularly in proposing a new drought index as well as their comparative assessment, r is the most frequently used statistical technique (Tsakiris and Vangelis, Citation2005; Ali et al., Citation2017). Although, the existing various drought indices bounds to choose optimum and most pertinent drought indices. In the previous researches, numerous authors proposed new drought indices related to hydrology including Cumbie-Ward and Boyles (Citation2016); Jain et al. (Citation2015); Naumann et al. (Citation2014) and Ye et al. (Citation2016) and compared those indices with the well-known index: Standardized Precipitation Index (SPI) (McKee et al., Citation1993). RIWSDI is mainly based on a long-term rainfall (precipitation) series as well as on average temperature as auxiliary variable, and is used to highlight the insufficiency in the amount of precipitation for various time scales (1, 3, 6, 9, 12, 24, 48) at a particular chosen station. Initially, the RIWSDI method is based on the standardization of CDF of the chosen distribution from 32 different candidate distributions. Where negative and positive values of RIWSDI respectively show less than or greater than the median precipitation.
Here, the study finds out that for defining drought related to hydrology, RIWSDI at 3 and 12-month time scale procedure uses, respectively, three- and twelve-months’ average data of monthly precipitation records as well as the auxiliary variable. Therefore, a comparative analysis of RIWSDI with SPI at 3 and 12-month time scale, is considered. Habibi et al. (Citation2018) stated that most of the researches related to drought monitoring and hydrology, SPI-3 and SPI-12 are most extensively, efficient and effective used indicators for highlighting drought related to hydrology. Furthermore, characterization of drought based on 3 and 12-month timescale show an overview of the seasonal drought and an overall behaviour of hydrological conditions related to regions (Gumus and Algin, Citation2017).
In computational and experimental analysis, it has been shown that the utilization of Gamma distribution is appropriate for modelling precipitation records at different time scales across all accumulation periods and regions within Europe (Stagge et al., Citation2015). That study is for Europe, as a result, a PDF is required among the enlisted probability functions for the regions under study. In the current study, we are following guidelines of Stagge et al. (Citation2015) in the process of estimation. Hence, a general expression of RIWSDI index can be written as follows,
(11)
(11)
where IWP(r,p) is the monthly cumulative total of either using regression or product type estimator for the improvement of rainfall data, and PDF shows the optimum probability function with n parameters. Estimation of the values of RIWSDI can be done by normalizing CDF of the pertinent selected PDF, which are fitted to the time series records of improved monthly cumulative precipitations.
In EquationEq. (9)(9)
(9) , a small amendment is made in the CDF to fully adjust the adverse effect of non-precise values of the series. Furthermore, following McKee et al. (Citation1993) and Ali et al. (Citation2017), quantitative records of RIWSDI are then classified in accordance to the severity of drought. The drought characterization for SPI and RIWSDI can be seen in .
Table 2. Categories of SPI and RIWSDI.
2.3.2. Non-parametric mechanism: incorporation of graphical methods
In each of the probabilistic models, as a result ambiguity repeatedly exists in the precise and accurate estimation procedures (Parker, Citation2014). Furthermore, the selection of the precise probability distributions considering each indicator is exclusively subjective in its nature. To avoid these kind of problems, for non-parametric drought monitoring, Hao and AghaKouchak (Citation2014) gave an idea by using Probability Position formulas (PP-formula) of Gringorten (Citation1963) as an alternative technique of Gamma distribution for obtaining the SDI. The fact behind the use of graphical technique is to fascinate the extreme events, and as a result, to reduce the errors, in precise as well as accurate estimation of the specified drought index. Farahmand and AghaKouchak (Citation2015); Ghamghami et al. (Citation2017) and Zhang et al. (Citation2018) also used a non-parametric approach for drought monitoring. Although, the behaviour of data is varying, as it is varied by place to place, therefore, it is not enough to the incorporate only one probability plotting position. Stagge et al. (Citation2015) studied that it is not enough to use only the Gamma distribution to capture and observe the behaviours of different climatic regions to acquire the drought indices. Hence, the deployment and use of different PP-formulas are mandatory for evaluating different behaviours of varies specified probability distributions (Cunnane, Citation1978; Vogel, Citation1986; Shukri Yah et al., 2012). In the current study rather than utilizing Gingorten PP-formula, we use other six well known non-parametric PP-formulas for the computation of RIWSDI.
3. Results and discussion
3.1. Basic statistics, deviations, and temporal behaviour
Statistics of each region’s stations is presented in . It contains the information of the precipitation and temperature of all the stations included in different regions. Coordinates and Altitude(m) can also be seen from . Mean, Minimum and Maximum precipitation as well as temperature can be obtained from this table. For example, in C1 (Region-1), Astor station has a mean, minimum and maximum annual precipitation of 39.5(mm), 21.6(mm) and 72.8(mm), respectively. Similarly, it has a mean, minimum and maximum annual temperature of 9.9(°C), 8.3(°C) and 11.3(°C), respectively. Astor has a latitude (N) and longitude (E) of 35.3570° and 74.8624°, respectively. Astor is 2546(m) above the sea level. Similarly, we can see the statistics of each and every station from .
SPI-12 is the most commonly used drought index for annual monitoring and characterization of hydrological drought (Habibi et al., Citation2018). In previous research, several studies proposed hydrological drought indices and compared it with SPI-12 (Naumann et al., Citation2014; Jain et al., Citation2015; Cumbie-Ward and Boyles, Citation2016). In this study, SPI-3 and SPI-12 with the comparison of RIWSDI-3 and RIWSDI-12 have been computed, before the standardization of IWP(r,p), a little graphical analysis is done by assessing the temporal behaviour and deviations in improving precipitation records with those which are used in the SPI-3 and SPI-12. SPI-3 and SPI-12 uses three- and twelve-month average of monthly precipitation records, respectively. Analogous to SPI, the proposed structure of precipitation records used in the IWP(r,p) model has the same mathematical structure and rationale. Therefore, it is necessary to show how auxiliary information plays a role in the temporal estimation of precipitation records. shows the graphical representation of temporal precipitation records of regionally weighted and the usual records for all 7 regions (clusters) along with their stations as well. From we observed that there are significant changes, particularly in upper precipitation record of Astor, Dir, Parachinar, Badin and Dalbandin stations. These contrasts reveal how drought characterization and analysis of regional meteorology of climates and their phenomena can be modified for the betterness by the introduction of advanced estimation techniques. It can be seen that the improved records in all the stations shows a better trend. Furthermore, before the standardization of the precipitation records, we may obtain the assorted proposition of the appropriate probability distributions for improved and simple precipitation records. summarizes the statistics of the selected regions (clusters). It is found that the mean precipitation for simple and improved precipitation are almost the same. But, there is a significant difference, between the standard deviation (SD) and coefficient of variation (CV), of the saying records.
Fig. 3. Comparison of precipitation records.
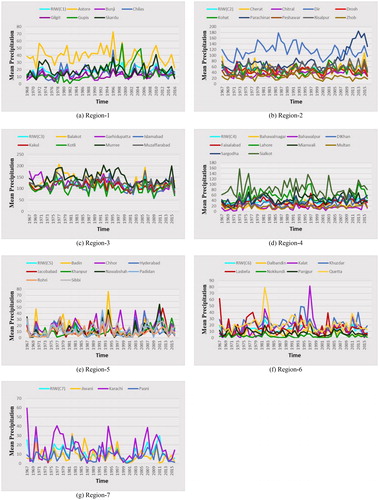
Table 3. Statistics of the selected clusters (Regions).
3.2. Parametric computation
Analogous to RIWSDI this study also calculates SPI. Subsequently, for each of the indicator, some sort of list of probability distributions is equipped in order to check their optimum fitness. Goodness-of-fit (GoF) test statistics are usually used for confirming validity and for choosing the best-fit among different distributions for a specific data set. In the current study BIC is used for choosing the best-fit. Numerical (BIC) as well as graphical performance (pdf) were used in the current study to assess and select the best fitted probability distribution among other 32 candidate distribution. A pdf with lowest value of BIC is considered as a best fit. The Bayesian Information Criterion (BIC) Konishi and Kitagawa (Citation2008); Sakamoto et al. (Citation1986) is applied here. A distribution, for which the value of BIC calculated by means of the following EquationEq. (12)(12)
(12) is the lowest, is considered as the best fit,
(12)
(12)
where L, k and N is the function of likelihood, number of the estimated parameters and total number of observations respectively, for the analyzed data (Kotowski and Kaźmierczak, Citation2013).
summarize the CDF of the optimum probability functions for all the indicators at all study regions and their associated stations. It also shows the chosen probability function and their estimated parameters as well as BIC values. Selection of each probability distribution is based on (weighted) residual sum-of-squares as the minimization criterion based on the Levenberg-Marquardt algorithm. Where, the estimation phase consists of method of moments, method of maximum likelihood estimation and method of L-moments. All these methods were implemented using lmom R packages. Especially in SPI and RIWSDI, fitness and selection of different probability distribution validate the finding of Stagge et al. (Citation2015). A number of modifications to SPEI and SPI methodology, and also for assessing SPEI and SPI an updated procedure based on Shapiro-Wilk test were proposed by Stagge et al. (Citation2015). They found gamma distribution and generalized extreme value distribution for SPI and SPEI respectively as the best fitted distribution in their study.
Table 4. Top-notch distributions with their parameters for Region-1.
Table 5. Top-notch distributions with their parameters for Region-3.
Table 6. Top-notch distributions with their parameters for Region-6.
Table 7. Top-notch distributions with their parameters for Region-7.
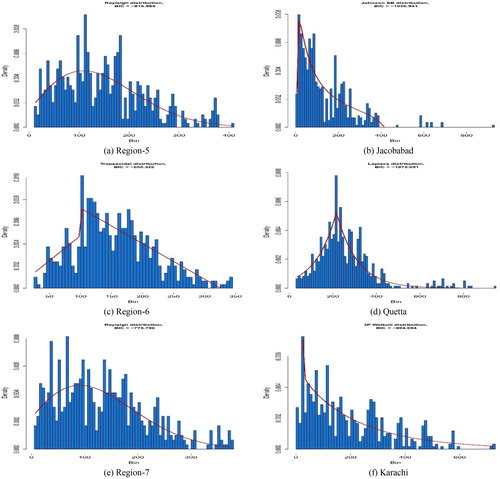
shows temporal behaviours of RIWSDI-3 and SPI-3 indices, shows temporal behaviours of RIWSDI-12 and SPI-12 indices. and shows the histograms, Q-Q plots and also provides the values of correlation coefficients between RIWSDI and SPI, respectively. In almost all regions the correlation coefficient is high, which shows the significance of the correlation between RIWSDI and SPI. Whereas some stations show low correlation i.e. Region-2-Chitral (0.32), Drosh (0.46) for SPI3, Region-2-Chitral (0.46), Drosh (0.48), Zhob (0.34) for SPI-12, and Region-6-Nokkundi (0.45) for SPI-12 as well. This shows that RIWSDI can be recommended as an alternate drought index which incorporates auxiliary information-based precipitation data for characterization of hydrological drought. shows the plots of the chosen distributions among 32 distributions on the basis of the lower value of BIC.
Fig. 4. Comparison of RIWSDI-3 and SPI-3.
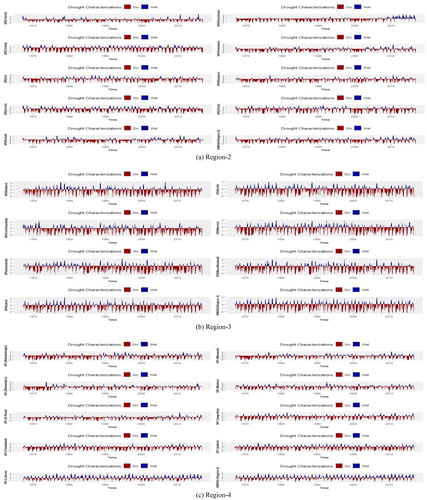
Fig. 5. Comparison of RIWSDI-12 and SPI-12.
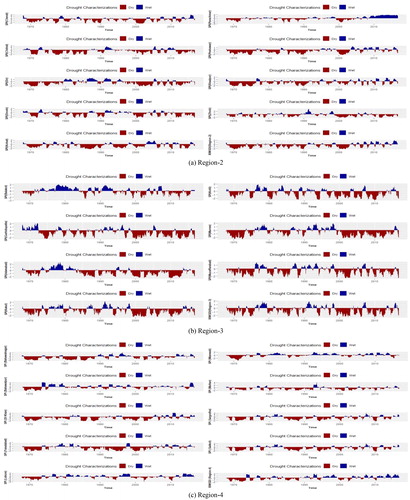
Fig. 6. Correlations of RIWSDI-3 and SPI-3.
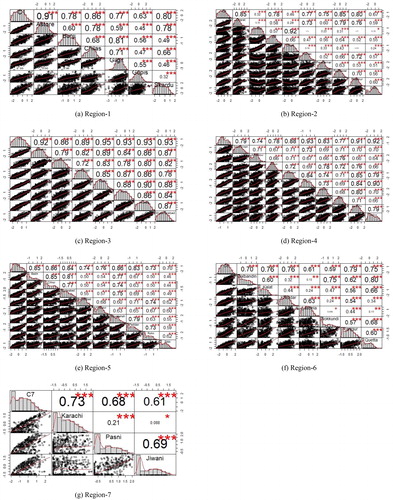
Fig. 7. Correlations of RIWSDI-12 and SPI-12.
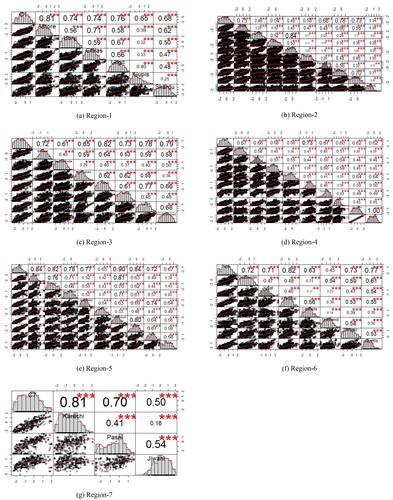
Fig. 8. Observed probability distribution functions for RIWSDI-3 and SPI-3 (Regions 1-4).
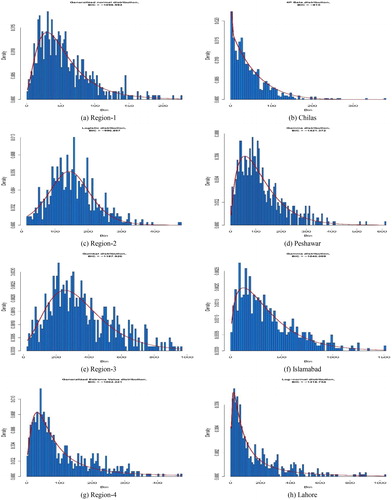
Fig. 9. Observed probability distribution functions for RIWSDI-3 and SPI-3 (Regions 5-7).
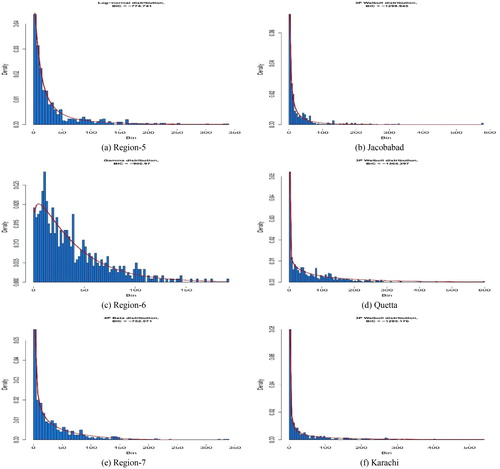
Fig. 10. Observed probability distribution functions for RIWSDI-12 and SPI-12 (Regions 1-4).
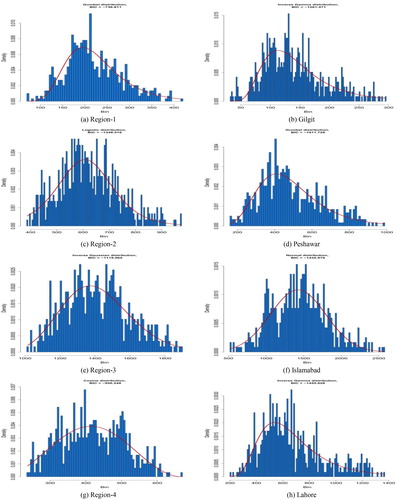
Fig. 11. Observed probability distribution functions for RIWSDI-12 and SPI-12 (Regions 5-7).
3.3. Non-parametric computation
Beside of cautious determination of probability distribution, our observed findings exhibit that outliers as well as extreme values cannot be fully capture by probability function. reveals that for Chilas station 4 P Beta distribution is the best fit with low BIC value, does not capture uncertainty in the significant parts of the data for SPI-3 model in Region-1. Similar results can be seen from in some stations. All chosen distributions appeared to inefficient for coverage of extreme records. Hence, in order to check and validate furthermore, the current study incorporates six Probability Plotting Position (PPP) formula, see .
Table 8. Probability plotting position techniques.
After standardization the vector of time series based on the PPP, we see that RIWSDI remains aligned with SPI. summarizes the correlation between RIWSDI and SPI of the non-parametric approach. There is a highly positive correlation between the values of SPI and RIWSDI for all the stations and their respective regions, under different methods of non-parametric approach, 3 out of 50 stations have weak but positive correlation with their respective regions.
Table 9. Non-parametric determination: correlation of RIWSDI-12 and SPI-12.
4. Conclusion
The new proposed index shows significant advantages over the former index (SPI) by incorporating apart from the record of precipitation, an additional meteorological parameter as an auxiliary variable, the average temperature. It is figured that although the RIWSDI usually responds in an identical fashion towards the SPI, it is more delicate and appropriate in regional drought analysis. Drought is generally acknowledged as a regional phenomenon. Even so, facts are accumulated by determined meteorological stations, which can also be regarded as representing the regions related to them. This study advantages drought-observing component by the incorporation of improved precipitation series in standard strategies of SDI technique. Whereas, improvement of the precipitation series is derived from the use of auxiliary information in the estimation phase of mean rainfall amount. In this article, the simple regression and product estimator approaches are utilized to weight the rainfall amount of each region. Therefore, the current study proposed a new regional hydrological drought index: The Regionally Improved Weighted Standardized Drought Index (RIWSDI). Performance of RIWSDI is evaluated by verifying the direction of the relationship, the form (shape) of the relationship, and the degree (strength) of the relationship among the different values of SPI through Pearson correlation statistics. To check out the consistency and efficiency of the proposed index RIWSDI, this study contains seven meteorological regions dispersed in several climatic settings of Pakistan, see . To compare and compute the values of RIWSDI and SPI for time scale 3 and 12, estimation methodology comprises of both the parametric Stagge et al. (Citation2015) and non-parametric Hao and AghaKouchak (Citation2014) approaches.
Comparative analysis of improved precipitation records and simple precipitation records can be observed from . A significant difference between the probability distributions of simple and improved precipitation series can be observed from , and . As we described previously, parametric distributions which are used to compute SPI and RIWSDI should be capable of providing normally distributed SPI and RIWSDI series. An SPI and RIWSDI series are consider non-normal if the criteria given below is satisfy simultaneously: (a) p-values ≤ 0.10 and Shapiro–Wilk (W) statistic lower than 0.96; (b) an absolute value of median > 0.05. Further information on W test may be found in numerous studies including Razali and Wah (Citation2011). W test result can be found in and . By analyzing and , it can be concluded and verified that all RIWSDI and SPI for time scale-3 and 12 are normally distributed. For example, taking the values of RIWSDI-3 and RIWSDI-12 of Region-1, all the criterion of distribution to be normal are satisfied. The confirmation of normality of RIWSDI and SPI for all other regions and the stations included in the regions can be confirmed by analyzing the results of W, p-value and absolute median of the respective regions and stations. Moreover, on the contrary with the standardization based on various distribution, the pattern of the records of RIWSDI are very closed to that of SPI (time scale 3 and 12), see and . It can be observed that the simple precipitation records within the regions are relatively different, whereas it can be seen from that the correlations among the stations are significantly low, whereas the correlation between RIWSDI and SPI (time-scale 3 and 12) for different regions and the stations within the regions are significantly high. Generally, comparative evaluation indicates that RIWSDI is significantly high correlated with SPI (time-scale 3 and 12) in both standardization i.e. parametric and nonparametric. Overall, comparative evaluation indicates that RIWSDI is strongly correlated with SPI in each parametric and non-parametric standardization. On the other hand, some of the discrepancies can be observed in parametric standardization and show low but positive correlation.
Table 10. Shapiro–Wilk test for Region (1–5).
Table 11. Shapiro–Wilk test for Region (6–7).
Some extreme values are addressed by incorporating non-parametric methods for the analysis and comparison of RIWSDI and SPI. Here, six different probability plotting position formulas are used to handle the extreme values and outliers, see . shows different results of the correlation of RIWSDI and SPI under non-parametric approach. It can be observed that SPI (3–12) values of all the stations are significantly high correlated with RIWSDI (3–12) values of the respective regions.
The foremost advantage of RIWSDI is to signify hydrological drought primarily based on regionally improved series of precipitation. Though, the limitation of the current study is that RIWSDI cannot be generalized in the settings of multiscales (Edwards, Citation1997).
Acknowledgements
The authors are quite grateful to the editor and reviewers for their helpful and insightful comments.
Disclosure statement
No potential conflict of interest was reported by the authors.
Additional information
Funding
References
- Abramowitz, M. and Stegun, I. A. 1965. Handbook of Mathematical Functions: With Formulas, Graphs, and Mathematical Tables. In: US Department of Commerce. National Bureau of Standards Applied Mathematics series 55. (Vol. 55). New York, NY: Courier Corporation.
- Ahmed, K., Shahid, S. and Nawaz, N. 2018. Impacts of climate variability and change on seasonal drought characteristics of pakistan. Atmos. Res. 214, 364–374. doi:10.1016/j.atmosres.2018.08.020
- Ali, Z., Hussain, I. and Faisal, M. 2019. Annual characterization of regional hydrological drought using auxiliary information under global warming scenario. Nat. Hazards Earth Syst. Sci. 1–20. doi:10.5194/nhess-2018-373
- Ali, Z., Hussain, I., Faisal, M., Nazir, H. M., Abd-el Moemen, M. and co-authors. 2017. A novel multi-scalar drought index for monitoring drought: the standardized precipitation temperature index. Water Resour. Manage. 31, 4957–4969. doi:10.1007/s11269-017-1788-1
- Anwar, Z. 2011. Development of infrastructural linkages between Pakistan and Central Asia. South Asian Stud. 26, 103–115.
- Apaydin, H., Anli, A. S. and Ozturk, F. 2011. Evaluation of topographical and geographical effects on some climatic parameters in the Central Anatolia region of Turkey. Int. J. Climatol. 31, 1264–1279. doi:10.1002/joc.2154
- Cai, W., Borlace, S., Lengaigne, M., van Rensch, P., Collins, M. and co-authors. 2014. Increasing frequency of extreme El niño events due to greenhouse warming. Nature Clim. Change 4, 111–116. doi:10.1038/nclimate2100
- Cochran, W. G. 2007. Sampling Techniques. John Wiley & Sons, New York.
- Coffel, E. and Horton, R. 2015. Climate change and the impact of extreme temperatures on aviation. Weather Clim. Soc. 7, 94–102. doi:10.1175/WCAS-D-14-00026.1
- Coles, S. G. and Tawn, J. A. 1991. Modelling extreme multivariate events. J. R. Stat. Soc. Series B: Stat. Methodol. 53, 377–392.
- Collins, M., Knutti, R., Arblaster, J., Dufresne, J.-L., Fichefet, T. and co-authors. 2013. Long-term climate change: projections, commitments and irreversibility. In Climate Change 2013: The Physical Science Basis: Contribution of Working Group I to the Fifth Assessment Report of the Intergovernmental Panel on Climate Change. Cambridge University Press, England, 1029–1136.
- Cumbie-Ward, R. V. and Boyles, R. P. 2016. Evaluation of a high-resolution spi for monitoring local drought severity. J. Appl. Meteor. Climatol. 55, 2247–2262. doi:10.1175/JAMC-D-16-0106.1
- Cunnane, C. 1978. Unbiased plotting positions—A review. J. Hydrol. 37, 205–222. doi:10.1016/0022-1694(78)90017-3
- Drought Bulletin of Pakistan. 2015. Online at: http://www.pmd.gov.pk/ndmc/quater315.pdf/ (Retrieved December 16, 2016, from http://www.pmd.gov.pk/ndmc/quater315.pdf)
- Edwards, D. C. 1997. Characteristics of 20th Century Drought in the United States at Multiple Time Scales. Technical Report. Air Force Institute of Technology, Wright-Patterson Air Force Base, Ohio.
- Elzhov, T. V., Mullen, K. M., Spiess, A. and Bolker, B. 2010. R interface to the Levenberg-Marquardt nonlinear least-squares algorithm found in Minpack. Plus Support for Bounds.
- Farahmand, A. and AghaKouchak, A. 2015. A generalized framework for deriving nonparametric standardized drought indicators. Adv. Water Resour. 76, 140–145. doi:10.1016/j.advwatres.2014.11.012
- Field, C. B., Barros, V., Stocker, T. F. and Dahe, Q. 2012. Managing the Risks of Extreme Events and Disasters to Advance Climate Change Adaptation: Special Report of the Intergovernmental Panel on Climate Change. Cambridge University Press, Cambridge, England.
- Ghamghami, M., Hejabi, S., Rahimi, J., Bazrafshan, J., Olya, H. and co-authors. 2017. Modeling a drought index using a nonparametric approach. Global Nest J. 19, 58–68.
- Gringorten, I. I. 1963. A plotting rule for extreme probability paper. J. Geophys. Res. 68, 813–814. doi:10.1029/JZ068i003p00813
- Guler, M., Cemek, B. and Gunal, H. 2007. Assessment of some spatial climatic layers through GIS and statistical analysis techniques in Samsun Turkey. Met. Apps. 14, 163–169. doi:10.1002/met.18
- Gumus, V. and Algin, H. M. 2017. Meteorological and hydrological drought analysis of the Seyhan-Ceyhan river basins. Met. Apps. 24, 62–73. doi:10.1002/met.1605
- Habibi, B., Meddi, M., Torfs, P. J., Remaoun, M. and Van Lanen, H. A. 2018. Characterisation and prediction of meteorological drought using stochastic models in the semi-arid Chéliff–Zahrez basin (Algeria). J. Hydrol: Reg. Stud. 16, 15–31. doi:10.1016/j.ejrh.2018.02.005
- Hansen, J., Ruedy, R., Sato, M. and Lo, K. 2010. Global surface temperature change. Rev. Geophys. 48, RG4004. doi:10.1029/2010RG000345
- Hao, Z. and AghaKouchak, A. 2014. A nonparametric multivariate multi-index drought monitoring framework. J. Hydrometeor. 15, 89–101. doi:10.1175/JHM-D-12-0160.1
- Hirabayashi, Y., Kanae, S., Emori, S., Oki, T. and Kimoto, M. 2008. Global projections of changing risks of floods and droughts in a changing climate. Hydrol. Sci. J. 53, 754–772. doi:10.1623/hysj.53.4.754
- Hussain, I., Pilz, J. and Spoeck, G. 2011. Homogeneous climate regions in Pakistan. Int. J. Global Warm. 3, 55–66. doi:10.1504/IJGW.2011.038369
- Jain, V. K., Pandey, R. P., Jain, M. K. and Byun, H.-R. 2015. Comparison of drought indices for appraisal of drought characteristics in the Ken river basin. Weather Clim. Extremes 8, 1–11. doi:10.1016/j.wace.2015.05.002
- Konishi, S. and Kitagawa, G. 2008. Information Criteria and Statistical Modeling. Springer Science & Business Media, New York.doi:10.1007/978-0-387-71887-3
- Kotowski, A. and Kaźmierczak, B. 2013. Probabilistic models of maximum precipitation for designing sewerage. J. Hydrometeor. 14, 1958–1965. doi:10.1175/JHM-D-13-01.1
- Kottek, M. and Rubel, F. 2007. Global daily precipitation fields from bias-corrected rain gauge and satellite obser-vations. part i: Design and development. Metz. 16, 525–539. doi:10.1127/0941-2948/2007/0214
- Mahdian, M., Bandarabady, S. R., Sokouti, R. and Banis, Y. N. 2009. Appraisal of the geostatistical methods to estimate monthly and annual temperature. J. Appl. Sci. 9, 128–134. doi:10.3923/jas.2009.128.134
- McKee, T. B., Doesken, N. J. and Kleist, J. 1993. The relationship of drought frequency and duration to time scales. In: Proceedings of the 8th Conference on Applied Climatology, Anaheim, CA, Vol. 17, 179–183.
- Naumann, G., Dutra, E., Barbosa, P., Pappenberger, F., Wetterhall, F. and co-authors. 2014. Comparison of drought indicators derived from multiple data sets over Africa. Hydrol. Earth Syst. Sci. 18, 1625–1640. doi:10.5194/hess-18-1625-2014
- Paloscia, S., Pettinato, S., Santi, E., Notarnicola, C., Pasolli, L. and co-authors. 2013. Soil moisture mapping using sentinel-1 images: Algorithm and preliminary validation. Remote Sens. Environ. 134, 234–248. doi:10.1016/j.rse.2013.02.027
- Parker, W. 2014. Values and uncertainties in climate prediction, revisited. Studies History Philos. Sci. Part A 46, 24–30. doi:10.1016/j.shpsa.2013.11.003
- Peel, M. C., Finlayson, B. L. and McMahon, T. A. 2007. Updated world map of the Köppen-Geiger climate classification. Hydrol. Earth Syst. Sci. Discuss. 4, 439–473. doi:10.5194/hessd-4-439-2007
- Pugachev, V. 1973. Mixed methods of determining probabilistic characteristics [in Russian]. Soviet Radio, Moscow, 256.
- Rajeevan, M., Pai, D. and Thapliyal, V. 1998. Spatial and temporal relationships between global land surface air temperature anomalies and Indian summer monsoon rainfall. Meteorl. Atmos. Phys. 66, 157–171. doi:10.1007/BF01026631
- Razali, N. M., and Wah, Y. B. 2011. Power comparisons of shapiro-wilk, kolmogorov-smirnov, lilliefors and anderson-darling tests. Journal of statistical modeling and analytics, 2(1), 21–33.
- Rohde, R., Muller, R., Jacobsen, R., Muller, E., Perlmutter, S., and co authors. 2013. A new estimate of the average earth surface land temperature spanning 1753 to 2011. Geoinfor Geostat overview 1: 1, 7, 2.
- Sakamoto, Y., Ishiguro, M. and Kitagawa, G. 1986. Akaike Information Criterion Statistics. D. Reidel, Dordrecht, The Netherlands, p. 81.
- Schwarz, G. 1978. Estimating the dimension of a model. Ann. Statist. 6, 461–464. doi:10.1214/aos/1176344136
- Seneviratne, S. I., Nicholls, N., Easterling, D., Goodess, C. M., Kanae, S., and co-authors. 2012. Changes in Climate Extremes and their Impacts on the Natural Physical Environment. doi:10.1017/CBO9781139177245.006
- Shukri Yah, A., Md. Nor, N., Rohashikin, N., Azam Ramli, N., Ahmad, F. and co-authors. 2012. Determination of the probability plotting position for type i extreme value distribution. J. Appl. Sci. 12, 1501–1506. doi:10.3923/jas.2012.1501.1506
- Sneva, F. A. 1977. Correlations of precipitation and temperature with spring, regrowth, and mature crested wheat-grass yields. J. Range Manage 30, 270–275. doi:10.2307/3897303
- Stagge, J. H., Tallaksen, L. M., Gudmundsson, L., Van Loon, A. F. and Stahl, K. 2015. Candidate distributions for climatological drought indices (spi and spei). Int. J. Climatol. 35, 4027–4040. doi:10.1002/joc.4267
- Sun, C. and Yang, S. 2012. Persistent severe drought in Southern China during winter–spring 2011: Large-scale circulation patterns and possible impacting factors. J. Geophys. Res.: Atmos. 117, D10112. doi:10.1029/2012JD017500
- Svoboda, M., Fuchs, B., and IDMP Integrated. 2016. Handbook of Drought Indicators and Indices. Integrated drought management programme (IDMP), integrated drought management tools and guidelines series 2. World Meteorological Organization and Global Water Partnership, Geneva, Switzerland, 52.
- Tarima, S. and Pavlov, D. 2006. Using auxiliary information in statistical function estimation. ESAIM: Probab. Stat. 10, 11–23. doi:10.1051/ps:2005019
- Tellinghuisen, J. and Spiess, A.-N. 2014. Statistical uncertainty and its propagation in the analysis of quantitative polymerase chain reaction data: Comparison of methods. Anal. Biochem. 464, 94–102. doi:10.1016/j.ab.2014.06.015
- Tsakiris, G. and Vangelis, H. 2005. Establishing a drought index incorporating evapotranspiration. Eur. Water 9, 3–11.
- Vogel, R. M. 1986. The probability plot correlation coefficient test for the normal, lognormal, and gumbel distributional hypotheses. Water Resour. Res. 22, 587–590. doi:10.1029/WR022i004p00587
- Wilhite, D. A., Wood, D. A. 1994. Drought Management in a Changing West: New Directions for Water Policy. Utah State University, Utah.
- Wu, H., Svoboda, M. D., Hayes, M. J., Wilhite, D. A. and Wen, F. 2007. Appropriate application of the standardized precipitation index in arid locations and dry seasons. Int. J. Climatol. 27, 65–79. doi:10.1002/joc.1371
- Yang, M., Yao, T., Wang, H. and Gou, X. 2006. Correlation between precipitation and temperature variations in the past 300 years recorded in Guliya ice core, China. Ann. Glaciol. 43, 137–141. doi:10.3189/172756406781812384
- Ye, X., Li, X., Xu, C.-Y. and Zhang, Q. 2016. Similarity, difference and correlation of meteorological and hydrological drought indices in a humid climate region–the Poyang lake catchment in China. Hydrol. Res. 47, 1211–1223. doi:10.2166/nh.2016.214
- Yevjevich, V. M. 1967. An Objective Approach to Definitions and Investigations of Continental Hydrologic Droughts. Hydrology papers no. 23, Colorado State University, Colorado.
- Zhang, Q., Li, Q., Singh, V. P., Shi, P., Huang, Q. and co-authors. 2018. Nonparametric integrated agrometeorological drought monitoring: Model development and application. J. Geophys. Res.: Atmos. 123, 73–88. doi:10.1002/2017JD027448
- Zhao, W. and Khalil, M. 1993. The relationship between precipitation and temperature over the contiguous united states. J. Climate 6, 1232–1236. doi:10.1175/1520-0442(1993)006<1232:TRBPAT>2.0.CO;2
- Zhu, Q. and Lin, H. 2010. Comparing ordinary kriging and regression kriging for soil properties in contrasting landscapes. Pedosphere 20, 594–606. doi:10.1016/S1002-0160(10)60049-5
Appendix
Appendix A: Standardization
This step considers a suitable transformation technique for the standardization of the chosen CDF, as well as all numeric vectors contains the time series records primarily based on the PP-formula and CDF. Hence, following the studies of McKee et al. (Citation1993) and Ali et al. (Citation2017), the current research employed an approximate transformation given in Abramowitz and Stegun (Citation1965) for the transformation of the CDF into a standard normal distribution, which is as follows:
(A1)
(A1)
for z,
(A2)
(A2)
(A3)
(A3)
and also for,
(A4)
(A4)
where c0 = 2.515517, c1 = 0.802853, c2 = 0.010328, d1 = 1.432788, d2 = 0.985269, and d3 = 0.001308 are constants.
In the above scheme,
here, P(x) and Q(x) are probability vectors, which are defined respectively in Eq. (9) and in . After standardization the records of RIWSDI will contain zero (0) mean as well as unit (1) variance.