
 ?Mathematical formulae have been encoded as MathML and are displayed in this HTML version using MathJax in order to improve their display. Uncheck the box to turn MathJax off. This feature requires Javascript. Click on a formula to zoom.
Abstract
The maintenance of large concentrations of active chlorine in Antarctic spring allows strong chemical ozone destruction to occur. In the lower stratosphere (approximately 16–18 km, 85–55 hPa, 390–430 K) in the core of the polar vortex, high levels of active chlorine are maintained, although rapid gas-phase production of HCl occurs. The maintenance is achieved through HCl null cycles in which the HCl production is balanced by immediate reactivation. The chemistry of the methyl peroxy radical (CH3O2) is essential for these HCl null cycles and thus for Antarctic chlorine and ozone loss chemistry in the lower stratosphere in the core of the polar vortex. The key reaction here is the reaction ; this reaction should not be neglected in simulations of polar ozone loss. Here we investigate the full chemistry of CH3O2 in box-model simulations representative for the conditions in the core of the polar vortex in the lower stratosphere. These simulations include the reaction CH3O2 + Cl, the product methylhypochlorite (CH3OCl) of the reaction CH3O2 + ClO, and the subsequent chemical decomposition of CH3OCl. We find that when the formation of CH3OCl is taken into account, it is important that also the main loss channels for CH3OCl, namely photolysis and reaction with Cl are considered. Provided that this is the case, there is only a moderate impact of the formation of CH3OCl in the reaction CH3O2 + ClO on polar chlorine chemistry in our simulations. Simulated peak mixing ratios of CH3OCl (
ppb) occur at the time of the lowest ozone mixing ratios. Further, our model simulations indicate that the reaction CH3O2 + Cl does not have a strong impact on polar chlorine chemistry. During the period of the lowest ozone concentrations in late September, enhanced values of CH3O2 are simulated and, as a consequence, also enhanced values of formaldehyde (about 100 ppt) and methanol (about 5 ppt).
1. Introduction
Severe chemical ozone loss in Antarctic spring (e.g. Solomon, Citation1999; Tilmes et al., Citation2006; Tripathi et al., Citation2007; Parrondo et al., Citation2014) leads to extremely low ozone column values, which are referred to as the ozone hole. This phenomenon has been clearly observed each Antarctic spring since the early 1980s until today (e.g. Müller et al., Citation2008; WMO, Citation2014; Kuttippurath and Nair, Citation2017; Bernhard et al., Citation2017). In spite of the success of the Montreal protocol and its amendments and adjustments in reducing atmospheric halogen levels and in limiting the growth of the Antarctic ozone hole (Chipperfield et al., Citation2015), the ozone hole will continue to occur each austral spring for decades to come (e.g. WMO, Citation2014; Oman et al., Citation2016; Hossaini et al., Citation2017; Fernandez et al., Citation2017).
The main chemical processes causing rapid chemical ozone destruction in the Antarctic polar vortex are well established, in particular heterogeneous chlorine activation through reactions driven by the occurrence of particles in the stratosphere at low temperatures and catalytic ozone loss cycles involving chlorine and bromine radicals (Solomon, Citation1999; von Clarmann, Citation2013). These catalytic cycles (Solomon, Citation1999; Canty et al., Citation2016; Wohltmann et al., Citation2017) only run efficiently when large concentrations of ‘active chlorine’ are available; active chlorine is commonly referred to as ClOx (). Large concentrations of active chlorine have indeed been observed by a variety of measurements in late winter and spring in both the Arctic and Antarctic for different years and over a range of altitudes and time periods (e.g. Tuck, Citation1989; Solomon et al., Citation1987; Anderson et al., Citation1991; Toohey et al., Citation1993; Jaeglé et al., Citation1997; Kühl et al., Citation2004; Vogel et al., Citation2003; Santee et al., Citation2003; Citation2008; Sumińska-Ebersoldt et al., Citation2012; Wetzel et al., Citation2015).
The conversion of the main chlorine reservoir species (HCl and ClONO2) to active chlorine (ClOx) occurs through heterogeneous reactions on polar stratospheric clouds (PSCs) and stratospheric aerosol at low temperatures (Solomon, Citation1999; Drdla and Müller, Citation2012). The initial step in winter proceeds mainly via the heterogeneous reaction
(R1)
(R1)
(Solomon et al., Citation1986). The heterogeneous reaction
(R2)
(R2)
(Prather, Citation1992; Crutzen et al., Citation1992; Müller et al., Citation1994) substantially contributes to further chlorine activation after the initial step, in particular in the Antarctic (Grooß et al., Citation2011; Wohltmann et al., Citation2017; Müller et al., Citation2018). For the conditions in the polar vortex in winter and spring, the formation of ClONO2 and HOCl requires large concentrations of ClO, HO2, and OH (and thus sunlight), so that further activation of HCl is not expected to occur during polar night (with the exception of some radical formation in polar night due to galactic cosmic rays, Müller and Crutzen, Citation1993). However, a recent study (Grooß et al., Citation2018) suggests that an unknown chemical process is active at very low sun elevation, which depletes HCl more rapidly than can be reproduced in current model simulations.
In spring, when most of the chemical ozone destruction occurs (e.g. Hoppel et al., Citation2005; Livesey et al., Citation2015), also reactions converting active chlorine back to chlorine reservoir species (mainly HCl and ClONO2) proceed increasingly rapidly. In Antarctic spring, with declining ozone concentrations the Cl/ClO ratio is shifted increasingly in favour of Cl so that the rate of HCl production through the reaction
(R3)
(R3)
(Douglass et al., Citation1995; Grooß et al., Citation1997; Grooß et al., Citation2011) and, about in late September, also through the reaction
(R4)
(R4)
(Grooß et al., Citation2011; Müller et al., Citation2018) increases by more than an order of magnitude. Thus, for very low ozone concentrations (below 0.5 ppm), as they are regularly observed in the Antarctic lower stratosphere in polar spring (Hoppel et al., Citation2005; Solomon et al., Citation2007), the formation of HCl via the reactions R3 and R4 constitutes a potentially important chlorine deactivation mechanism. This deactivation mechanism, if not balanced by other chemical processes, would stop chlorine activation (and thus chemical ozone destruction) within days (Müller et al., Citation2018).
Therefore, it is an important question how the large concentrations of active chlorine, which cause chemical ozone loss can be maintained in Antarctic spring. The maintenance of active chlorine in spring has been clearly observed (e.g. Tuck, Citation1989; Anderson et al., Citation1991; Santee et al., Citation2003, Citation2008), the question of the responsible chemical mechanism has, however, received relatively little attention (Portmann et al., Citation1996; Solomon et al., Citation2015; Müller et al., Citation2018).
In a recent study, it was proposed that in the core of the Antarctic vortex in the lowermost stratosphere (approximately 16–18 km, 85–55 hPa, 390–430 K potential temperature), high levels of active chlorine are maintained through so-called HCl null cycles (cycles C1 and C2 in Müller et al., Citation2018, see also appendix). The key feature of these two HCl null cycles is that HO2 and thus HOCl is produced at the same rate as HCl, which further reacts via reaction R2, so that there is no net production of HCl in the cycles in spite of the strongly increasing rates of reactions R3 and R4 in Antarctic spring (Müller et al., Citation2018). At the same rate means that, within these cycles, the formation of an HCl molecule directly leads to the formation of an HO2 radical (and thus an HOCl molecule). Thus, although the rate limiting step of the HCl null cycles is the formation of HCl via reactions R3 and R4, the net effect of these cycles is not the formation of HCl.
For the efficiency of the HCl null cycle that balances HCl formation in reaction R3 (C1, see appendix), the gas-phase reaction
(R5)
(R5)
is essential (Crutzen et al., Citation1992; Müller et al., Citation1994, Citation2018). Assuming that the product
decomposes rapidly into
, this reaction may be written as
(R6)
(R6)
However, there is an alternative product channel for reaction R6 with methylhypochlorite (CH3OCl) as a product
(R7)
(R7)
which has hitherto only been explored to a very limited extent (Helleis et al., Citation1994; Crowley et al., Citation1994; Carl et al., Citation1996; Müller et al., Citation1996).
Without considering reaction R6, the formation of the observed extremely low ozone concentrations in Antarctic spring cannot be explained (Crutzen et al., Citation1992; Grooß et al., Citation2011; Müller et al., Citation2018). Reaction R6 constitutes the dominant sink of CH3O2 under conditions of ozone hole chemistry. The CH3O2 radical would otherwise participate to a much larger extent in the following cycles (Müller and Crutzen, Citation1994):
(R8)
(R8)
(R9)
(R9)
and
(R8)
(R8)
(R10)
(R10)
Reaction R10 has a minor channel (30%, Sander et al., Citation2011) in which CH2OOH is produced; however CH2OOH decomposes spontaneously into CH2O + OH (Vaghjiani and Ravishankara, Citation1989; Vereecken et al., Citation2004). The net effect of this channel is thus
(R8)
(R8)
(R11)
(R11)
(R12)
(R12)
The net result of the three cycles above is a loss of HOx, methyl peroxy, and active chlorine radicals. If these reactions occurred at a large rate in the polar spring stratosphere, they would lead to a reduced rate of activation of HCl and a loss of active chlorine radicals.
Moreover, also the methyl peroxy self-reaction could be important, which proceeds at stratospheric temperatures mainly via reaction R13 (Tyndall et al., Citation2001):
(R13)
(R13)
(R14)
(R14)
(R15)
(R15)
The net result of reactions R13–R15 is a loss of an active chlorine radical (Cl) but also the formation of an HO2 radical (which in turn results in the production of an active chlorine radical, Crutzen et al., Citation1992; Müller et al., Citation2018), so that the impact on active chlorine will be moderate.
Because of the importance of reactions of CH3O2 for Antarctic stratospheric chemistry we consider here the complete CH3O2 chemistry including reactions of methylhypochlorite (CH3OCl) and take into account recent laboratory studies of the rate constant of R6 (Leather et al., Citation2012; Ward and Rowley, Citation2016). We further consider the impact of the reaction of the methyl peroxy radical with Cl on polar ozone chemistry, which has hitherto been neglected. We use a current chemical scheme of heterogeneous and gas-phase chemistry (Grooß et al., Citation2011; Zafar, Citation2016; Müller et al., Citation2018) focusing on the conditions in the core of the polar vortex in the lowermost stratosphere, where minimum ozone mixing ratios are reached in Antarctic spring (Hoppel et al., Citation2005; Solomon et al., Citation2007).
2. Model description
The simulations presented here were performed with a chemical box-model version of the Chemical Lagrangian Model of the Stratosphere (CLaMS) (McKenna et al., Citation2002; Grooß et al., Citation2011, Citation2014, Citation2018) in the same set-up as used in a previous study (Zafar, Citation2016; Müller et al., Citation2018).
The model simulations discussed here were conducted for a typical air parcel (Grooß et al., Citation2011; Müller et al., Citation2018) in the lower stratosphere circulating and descending from 430 to 390 K potential temperature (this range of potential temperatures corresponds approximately to 16–18 km or 55–85 hPa). The air parcel is representative for the conditions in the core of the polar vortex according to trajectory calculations; i.e. fluctuations in temperature and solar illumination (solar zenith angle) are realistic (Müller et al., Citation2018). Further, the diabatic descent (by about 35 K) prescribed based on calculations using a radiation model (Grooß et al., Citation2011; Müller et al., Citation2018) will also be realistic.
Stratospheric chemistry is calculated for air parcels along trajectories driven by meteorological information from operational analyses from the European Centre for Medium-range Weather Forecasts (ECMWF). The kinetics of the chemistry simulated along the trajectories is based on the recommendations by Sander et al. (Citation2011). The photolysis rates are calculated for spherical geometry (Becker et al., Citation2000) and heterogeneous chemistry is calculated on ice, nitric acid trihydrate (NAT), liquid ternary particles and cold liquid binary aerosols (for details see Müller et al., Citation2018).
The initial values at the start of the simulation at 430 K potential temperature are based on observations by MIPAS-Envisat (ozone, , HNO3) and tracer correlations with
(
,
, and
), see Grooß et al. (Citation2011) for more details. The initial values are the same as used by Müller et al. (Citation2018), but are listed here again for reference:
= 2.2 ppm,
= 4.1 ppm, CH4 = 1.2 ppm, HNO3 = 4.5 ppb, HCl = 1.05 ppb, ClOx = 1.01 ppb, ClONO2 = 12 ppt,
= 5 ppt,
= 17 ppt,
= 16 ppb. (The initial value of HNO3 is chosen to account for denitrification, Müller et al., Citation2018.)
3. Results
The results of the reference case (standard run) have been presented in a previous publication (Müller et al., Citation2018) and will be briefly summarised here () to provide the information relevant for the discussion of the chemistry of CH3O2 and the sensitivity studies presented below. The air parcel descends from above 430 K potential temperature in June to close to 390 K in late October; the development of temperature and PSCs (ice, NAT, and liquid PSCs) along the trajectory employed here is shown in (panels a and b).
Fig. 1. Box-model simulations along a trajectory passing through the location of an ozone sonde observation of 14 ppb on 74 hPa (391 K potential temperature) at South Pole on 24 September 2003 (Grooß et al., Citation2011; Müller et al., Citation2018). The different panels show a time series of the most important parameters: (a) temperature of the air parcel, (b) PSCs: surface area density of ice (magenta, scaled by 0.1), NAT (green, scaled by 5) and liquid aerosol particles (blue), (c) ClOx (blue), and HCl (red), (d) ClONO2, and (e) ozone (note the logarithmic y-axis). Ozone and ClOx mixing ratios are shown as 24 hour averages.
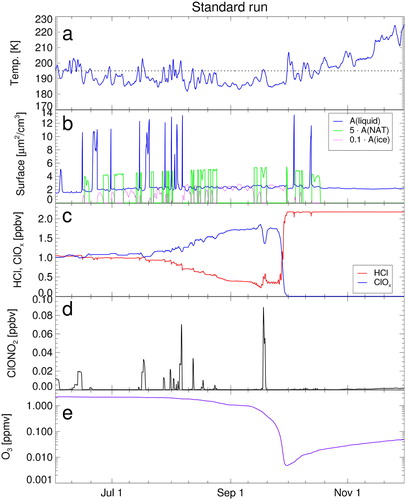
The model simulation starts with about 1 ppb of ClOx and with near zero values of ClONO2 due to the initial titration between HCl and ClONO2 in May. During polar night, there is a period of ‘sleeping chemistry’, which is followed by further HCl decrease (Grooß et al., Citation2011; Müller et al., Citation2018). During polar night and during the period of decreasing HCl, HOCl mixing ratios (not shown) are somewhat variable but low (with peak values below about 0.2 ppb) in general agreement with observations (von Clarmann et al., Citation2012). Mixing ratios of ClONO2 likewise are extremely low, mostly below about 0.01 ppb and even peak values below 0.1 ppb (, panel d). These very low ClONO2 values are due to very low gas-phase concentrations of HNO3, which in turn are caused by the uptake of HNO3 in PSC particles (note that PSCs are practically continuously present in the simulation until early October).
The decreasing HCl mixing ratios result in increasing ClOx and thus in chemical ozone destruction increasing in strength. The ozone depletion ends abruptly with chlorine deactivation into HCl in late September (, panel e).
Compared to the study by Grooß et al. (Citation2011), there are different assumptions here on the number densities of NAT particles. Grooß et al. (Citation2011) assumed a NAT particle density of 1 cm–3, while we assume a lower value of . There is a large variability in observed NAT number densities (e.g. Pitts et al., Citation2011; Spang et al., Citation2018; Pitts et al., Citation2018) and choosing a particular number constitutes a simplification. However, assuming higher number densities for NAT leads to larger NAT surface areas (Drdla and Müller, Citation2012) and thus to a larger heterogeneous reactivity on NAT. Thus, in the simulations reported by Grooß et al. (Citation2011) heterogeneous reactivity on NAT dominated the reactivity on STS. Here heterogeneous reactions on STS have a stronger impact than in the earlier study (Grooß et al., Citation2011), which should be more realistic. Nonetheless, in spite of these differences, the results for the standard run () are very close to those reported for the same trajectory by Grooß et al. (Citation2011).
3.1. Impact of the gas-phase reaction CH3O2 + ClO and the heterogeneous reaction  on ozone loss
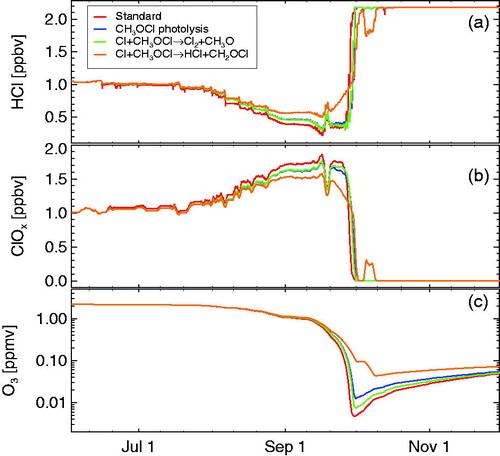
Müller et al. (Citation2018) argued that in the lowermost stratosphere, in the core of the vortex, reactions R2 and R6 are essential for the efficacy of the HCl null cycles, which allow high levels of active chlorine to be maintained in polar spring. In the standard run, we assume here that the product of reaction CH3O2 + ClO (R6) is only . In a set of sensitivity tests, we neglected reaction R2, neglected R6, and neglected both R2 and R6 (). The results confirm the conclusions of the early study by Crutzen et al. (Citation1992) and the recent analysis by Müller et al. (Citation2018). Substantial depletion of HCl beyond the initial titration of ClONO2 against HCl is only achieved by including both R2 and R6 ().
Fig. 2. Sensitivity simulations on the impact of the gas-phase reaction CH3O2 + ClO (R6) and the heterogeneous reaction HOCl + HCl (R2) on ozone loss. Top panel shows the simulated surface areas of NAT and liquid particles (also shown in ). The panels below show HCl (b), active chlorine (ClOx, c), and ozone (d). Red line is the standard run (case A), blue line a run neglecting R6 (case B), green line a run neglecting R2 (case C), and orange line a case neglecting both R2 and R6 (case D). Ozone and ClOx mixing ratios are shown as 24 hour averages.
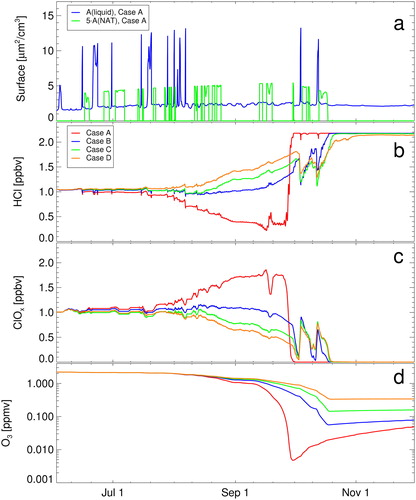
Table 1. Sensitivity simulations on the impact of the gas-phase reaction CH3O2 + ClO and the heterogeneous reaction HOCl + HCl on ozone loss.
Reaction R2 is taken into account in state-of-the-art models; if it were neglected, a steady increase of HCl over late August and early September (by about 0.5 ppb) would be simulated (case C, green line in ). If the gas-phase reaction R6 is neglected, the picture is similar, but the increase of HCl in late August, early September is slower (case B, blue line). The increase in HCl in late August and early September is strongest if both R2 and R6 are neglected (case D, orange line in ). An increase in HCl corresponds to a decrease in ClOx and thus to slower ozone loss rates. Without reaction R2 and R6 (cases B–D), the observed decline of ozone mixing ratios to extremely low values end of September cannot be explained (Grooß et al., Citation2011).
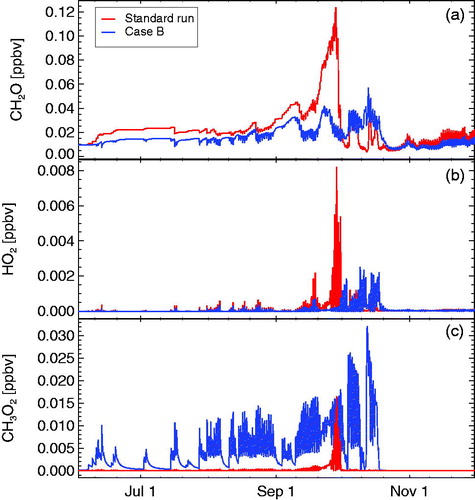
We also show the impact of taking into account reaction R6 on simulated HO2, formaldehyde (CH2O), and CH3O2 mixing ratios (). The HO2 radical is important for the effectiveness of cycle C1. Throughout the period of high levels of active chlorine, its concentrations are strongly suppressed although there is rapid formation of HO2 in cycle C1 (through R15, see appendix). The low HO2 concentrations occur because of the consumption of HO2 in cycle C1 caused by the heterogeneous reaction R2 (Crutzen et al., Citation1992; Müller and Crutzen, Citation1994; Jaeglé et al., Citation1997; Müller et al., Citation2018). Concentrations of CH2O are somewhat higher when reaction R6 is taken into account, with peak values in late September more than a factor of three higher with reaction R6 (, top panel). Without reaction R6, simulated mixing ratios of CH3O2 are much higher than when reaction R6 is taken into account (, bottom panel). Thus, reaction R6 strongly suppresses mixing ratios of CH3O2, with the exception of a peak in CH3O2 in late September, when the minimum ozone concentration occurs.
Fig. 3. The temporal development of CH2O (panel a), HO2 (panel b), and CH3O2 (panel c) for the standard run (case A, red lines) and for case B (blue lines) neglecting R6.
3.2. Sensitivity on the rate constant of CH3O2 + ClO
Reaction R6 is essential for the efficacy of the HCl null cycles that allow active chlorine levels to be maintained in polar spring (Müller et al., Citation2018, see also appendix). In the standard run, for the overall rate constant for reaction R6, we employed the recommended value (where T is temperature in Kelvin), which is based on Helleis et al. (Citation1993). More recent laboratory studies report different rate constants of
(Leather et al., Citation2012) and
(Ward and Rowley, Citation2016), which lead to a smaller reaction rate at low temperatures. For a temperature of 190 K, the recommended rate constant (Sander et al., Citation2011) corresponds to
, the rate reported by Leather et al. (Citation2012) to
and the rate reported by Ward and Rowley (Citation2016) to
; the study by Crutzen et al. (Citation1992) assumed the constant value
for the rate constant. Leather et al. (Citation2012) concluded that the new data might reduce the effectiveness of ozone loss cycles involving reaction R6, but support the importance of this reaction in the late winter and spring time polar vortex region.
We tested the impact of the recently reported rate constants for reaction R6 (Leather et al., Citation2012; Ward and Rowley, Citation2016) and their temperature dependence in a sensitivity simulation (). A significant impact of the recently reported rate constants by Leather et al. (Citation2012) and Ward and Rowley (Citation2016) on the results is not noticeable in the simulation.
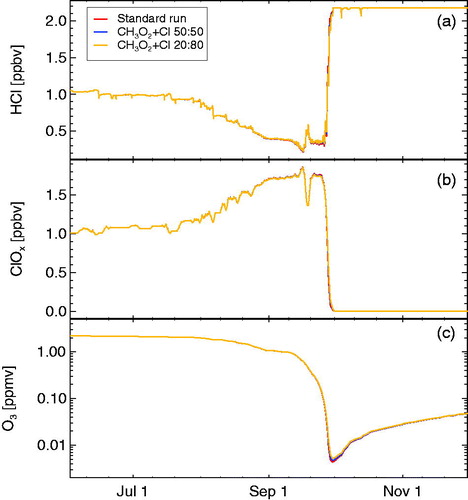
Fig. 4. Sensitivity simulations on the rate constant of reaction R6 (CH3O2 + ClO). The panels show HCl (a), active chlorine (ClOx, b), and ozone (c). Red line shows the standard run using the recommended value (Sander et al., Citation2011) for R6, blue line shows a run assuming the overall rate constant for R6 reported by Leather et al. (Citation2012) and the yellow line indicates the rate constant for R6 reported by Ward and Rowley (Citation2016). (The blue and the yellow lines are almost identical.) Ozone and ClOx mixing ratios are shown as 24 hour averages.
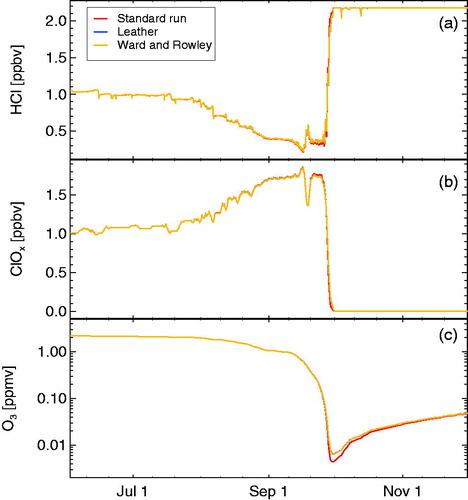
This result is expected, as moderate changes of the rate constant of reaction R6 do not affect the efficacy of the first HCl null cycle, which is rather controlled by the rate constant of reaction R3 (see appendix). Only if the rate of reaction R6 dropped to values that would make other reactions that remove CH3O2 (R8 and R13) competitive in rate to reaction R6, the rate constant of reaction R6 would become relevant.
3.3. Reactions involving methylhypochlorite (CH3OCl)
In laboratory experiments (Helleis et al., Citation1994; Biggs et al., Citation1995; Tyndall et al., Citation1998), two reaction channels have been identified for the reaction CH3O2 + ClO:
(R6)
(R6)
(R7)
(R7)
That means that for reaction R6 not only the products are possible (as assumed for cycle C1, Müller et al., Citation2018, see also appendix), but also the formation of methylhypochlorite (CH3OCl). Thus, for a complete picture of the impact of the methane oxidation cycle on polar stratospheric chemistry, the chemistry of methylhypochlorite has to be taken into account.
3.3.1 Loss of through photolysis
In the polar stratosphere, photolysis constitutes an important removal process for CH3OCl
(R16)
(R16)
(Crowley et al., Citation1994; Krisch et al., Citation2004), whereas the reaction of CH3OCl with is negligible (Crowley et al., Citation1996). The net result of reactions R7 and R16
(R7)
(R7)
(R16)
(R16)
is the same as reaction R6, so that cycle C1 should remain unaltered.
This is indeed the outcome of a sensitivity study, where the production of CH3OCl in reaction R7 was assumed to occur with 100% efficiency and photolysis is assumed as the only loss process (R16) (see blue line in ). The simulated development of HCl, active chlorine and ozone in this sensitivity simulation is very close to the standard run, with the only exception of a somewhat stronger HCl activation in early August in the standard run. This stronger activation in the standard run does not occur continuously, but rather in steps; at these steps somewhat more HCl depletion occurs in the standard run (). The HCl activation in these steps occurs because of short-term fluctuations to higher temperatures (, panel a), resulting in the release of HNO3 to the gas-phase and the subsequent formation of and (consequently) the formation of ClONO2 (, panel d). When CH3OCl is considered in the model, somewhat less
is available in the (short) higher temperature periods, so that somewhat less ClONO2 is formed and therefore the heterogeneous activation of HCl (via reaction R1) is less.
Fig. 5. Sensitivity simulations including CH3OCl chemistry. The panels show HCl (a), active chlorine (ClOx, b), and ozone (c). Red line shows the standard run. The blue, green, and orange lines show runs assuming 100% efficiency for the production of CH3OCl in the branching ratio of R6/R7. The blue line shows results from a run assuming loss of CH3OCl only through photolysis, the green line results assuming in addition loss through the reaction of with the products
and the orange line assuming in addition loss through the reaction of
, but with the products
. Ozone and ClOx mixing ratios are shown as 24 hour averages.
3.3.2 Reaction of with Cl
Carl et al. (Citation1996) and Kukui et al. (Citation1997) pointed out a further relevant reaction for methylhypochlorite (CH3OCl), namely the reaction with Cl and reported rate constants and reaction products:
(R17)
(R17)
(R18)
(R18)
where
rapidly reacts further via
(R19)
(R19)
(Carl et al., Citation1996).
Reaction R17 constitutes the dominant pathway (about 80–85%, Carl et al., Citation1996; Kukui et al., Citation1997; He et al., Citation2005) and leads to the following reaction sequence:
(R7)
(R7)
(R17)
(R17)
(R20)
(R20)
Thus, the net effect of this cycle again should be the same as reaction R6.
This is indeed borne out by the results of a sensitivity simulation, where in addition to a 100% efficiency for the production of CH3OCl in the branching ratio of R6/R7 and loss of CH3OCl by photolysis (R16) the loss of CH3OCl via reaction with Cl (R17) was added. The results (green line in ) are very close to the results without reaction R17 (blue line in ).
The minor reaction pathway R7 and R18 together with R19 leads to the net reaction
(R21)
(R21)
and thus to a deactivation of chlorine. In a sensitivity study (orange line in ), we added reactions R18 and R19 assuming a 100% production channel of HCl and CH2O, assumed 100% production efficiency of CH3OCl in the branching ratio of R6/R7, and included the major gas-phase loss of CH3OCl, namely photolysis (R16). (For example, on 10 September, the rate of loss of CH3OCl through photolysis is
ppb/day and the loss through reaction with Cl is
ppb/day). Indeed, adding reaction R21 leads to a shift towards higher values of HCl in the simulation and the importance of this effect increases towards end of September with increasing values of Cl, i.e. with decreasing values of ozone (orange line in ).
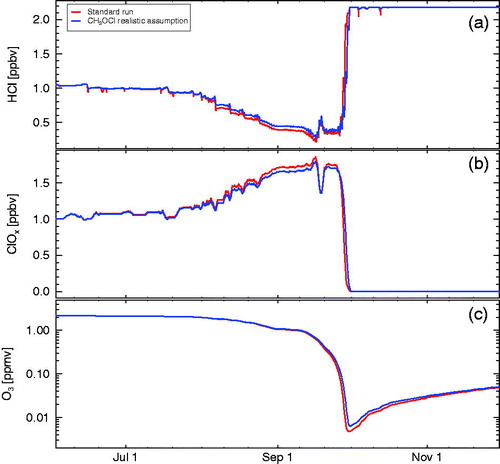
However, assuming a 100% efficiency for the production of CH3OCl in the branching ratio of R6/R7, as it was done in the sensitivity studies shown in , is not realistic. Therefore, we conducted a study assuming more realistic chemical parameters, namely an efficiency for CH3OCl formation in the branching ratio of R6/R7 of 23% (i.e. a branching ratio of R6/R7 77%:23% Helleis et al., Citation1994) and a branching ratio between reactions 17 and 18 of 80–20% (Carl et al., Citation1996; Kukui et al., Citation1997; He et al., Citation2005). In , the results of this sensitivity test (blue line) are compared against the standard run (red line). There is very little difference to the standard run under these assumptions, except for slightly more activation of HCl in the standard run.
Fig. 6. Sensitivity simulations including CH3OCl chemistry. The panels show HCl (a), active chlorine (ClOx, b), and ozone (c). Red line shows results for the standard run. Blue line shows results for a run assuming realistic branching ratios for CH3OCl production in R7 and for HCl production in R18 (see text). Ozone and ClOx mixing ratios are shown as 24 hour averages.
3.3.3 The heterogeneous reaction + HCl
Kenner et al. (Citation1993) and Crowley et al. (Citation1994) suggested that the heterogeneous reaction
(R22)
(R22)
might take place in analogy with the heterogeneous reaction R2. However, there is no study of this reaction based on laboratory measurements. If reaction R22 occurred in the polar stratosphere, it would constitute a significant source of methanol (
) and should lead to the following reaction sequence:
(R7)
(R7)
(R22)
(R22)
(R20)
(R20)
(R23)
(R23)
(R24)
(R24)
Thus, the net effect of this cycle is identical to the effect of reaction R6 followed by reaction R15
We tested the possible impact of the heterogeneous reaction R22 by assuming it to occur on ice, NAT and STS particles with the same rate as the heterogeneous reaction R2. Moreover, we have assumed a 100% efficiency for the production of CH3OCl in the branching ratio R6/R7 and loss of CH3OCl through the main gas-phase loss (photolysis, reaction R16). In , the results of this sensitivity run (blue line) are compared with the standard run (red line). As expected from the net result of the cycle shown above, there is only a minor impact of the hypothetical heterogeneous reaction R22 on chemical ozone loss. Further, if the hypothetical heterogeneous reaction R22 is taken into account, there are somewhat higher concentrations of and much lower concentrations of CH3OCl (, black lines).
Fig. 7. Simulations assuming the hypothetical heterogeneous reaction →
(Kenner et al., Citation1993; Crowley et al., Citation1994); the sensitivity run assuming that this reaction occurs on ice, NAT and STS is shown in blue and the standard run is shown in red. The panels show HCl (a), active chlorine (ClOx, b), and ozone (c). Ozone and ClOx mixing ratios are shown as 24 hour averages.
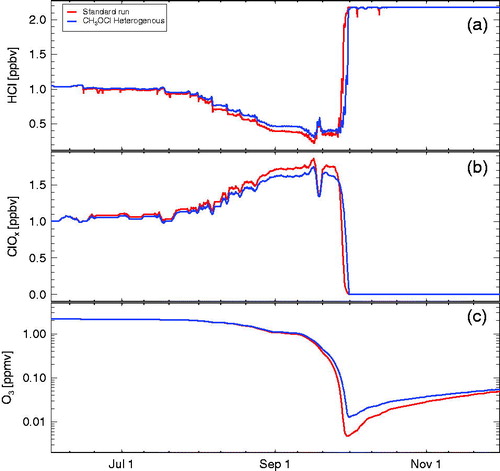
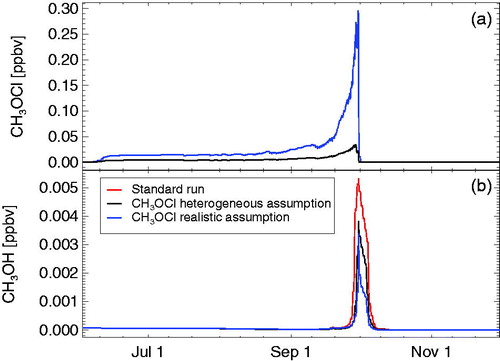
Fig. 8. Results of the temporal development of methylhypochlorite (CH3OCl, panel a) and methanol (, panel b). Shown are results for a case (blue line) with a realistic formation rate of CH3OCl in reaction R7 and a realistic branching ratio for the reaction
(reactions R17 and R18). Also shown are results for a run with realistic assumptions for CH3OCl chemistry and, in addition, assuming that the hypothetical heterogeneous reaction R22 occurs in the polar stratosphere (black lines). The methanol mixing ratios for the standard run are shown as the red line in panel b.
3.3.4 Formation of methanol in the antarctic stratosphere
In the standard run, with reaction R6 taken into account (constituting a major loss pathway for CH3O2), mixing ratios of CH3O2 are suppressed for most of the simulation period (). Nonetheless, for very low ozone concentrations in the polar lower stratosphere, because of the strongly increasing speed of reaction cycle C1 (Müller et al., Citation2018), enhanced values of CH3O2 (compared to the period before and after late September) are simulated (). Consequently, because of reaction R13, also enhanced values of are projected (). If detectable, these enhanced values would constitute an indication of the relevance of the chemistry of CH3O2 for polar ozone loss.
Moreover, the formation of methylhypochlorite in reaction R7 is mostly neglected in formulations of polar chemistry, if taken into account, mixing ratios of methylhypochlorite range between 10–250 ppt, with peak values occurring for the lowest ozone mixing ratios (). The simulated pattern of the temporal development of CH3OCl () is consistent with the first estimate of CH3OCl mixing ratios in the Antarctic stratosphere (Carl et al., Citation1996), although this first estimate predicted much lower concentrations.
During the period of very low ozone concentrations, also a substantial enhancement of methanol () is simulated with peak values of about 5 ppt for the standard case (). The methanol is formed in the self-reaction of CH3O2 (reaction R13). Because during the period of very low ozone concentrations the CH3O2 mixing ratios are lower when methylhypochlorite formation is taken into account, also the simulated methanol (peak values of about 3 ppt) is lower in this case. Assuming that the hypothetical heterogeneous reaction of methylhypochlorite with HCl (R22) takes place, results again in higher methanol concentrations due to the additional methanol source from reaction R22 ().
3.4. The relevance of the reaction CH3O2 + Cl
The main reaction pathway of CH3O2 for the conditions in the polar lower stratosphere considered here so far is the reaction with ClO via reaction R6. Nonetheless, there is also a reaction of CH3O2 with the Cl radical (Maricq et al., Citation1994; Jungkamp et al., Citation1995; Daële and Poulet, Citation1996; Sander et al., Citation2011)
(R25)
(R25)
(R26)
(R26)
with a recommended rate constant of
(Sander et al., Citation2011). The branching ratio between reactions R25 and R26 is uncertain (Maricq et al., Citation1994; Jungkamp et al., Citation1995; Daële and Poulet, Citation1996) and no recommendation is given (Sander et al., Citation2011).
Before 26 September, when the Cl/ClO ratio remains clearly below , reaction R6 will dominate over reactions R25 and R26. In late September, the reaction of CH3O2 with the Cl radical increases in importance with decreasing ozone (and the associated increase in the Cl/ClO ratio). The impact of reactions R25 and R26 on stratospheric chlorine chemistry has hitherto not been investigated although under conditions of activated chlorine and low ozone reaction R26 constitutes a source of HCl.
In addition to HCl, the Criegee intermediate (CH2O2) is a product of reaction R26, which decays very rapidly; it has a lifetime of (see and Maricq et al., Citation1994).
(R27)
(R27)
(R28)
(R28)
(R29)
(R29)
Table 2. The set of additional reactions taken into account to describe the chemistry of .
(see for the decay rates of CH2O2).
The reaction pathway via reaction R25 has the same impact on polar chlorine chemistry as reaction R6 because of the product , which leads to formation of HO2. The same is true for reaction R26 followed by the decay of CH2O2 via R28 with the net reaction
(R30)
(R30)
The two H radicals are rapidly converted into two HO2 radicals, one of which may serve to compensate the formation of HCl in reaction R26. Thus, the impact of the net reaction R30 on polar chlorine chemistry is again very similar to reaction R6. However, a decay of CH2O2 via reactions R27 and R29, the main decay pathways of CH2O2 () does not lead to the formation of radicals so that the HCl production in R26 is not compensated and thus there is a net production of HCl.
We have implemented reactions R25 and R26 in our model simulations using the recommended rate constant (Sander et al., Citation2011). Because the branching ratio between reactions R25 and R26 is uncertain; we use here both branching ratios which are reported in the literature, namely 0.5/0.5 and 0.2/0.8 (Maricq et al., Citation1994; Jungkamp et al., Citation1995; Daële and Poulet, Citation1996; Sander et al., Citation2011). We have also implemented the decay of the Criegee intermediate CH2O2 (see ) according to R27, R28, and R29 using the rates reported by Maricq et al. (Citation1994). In the model formulation, we have not introduced CH2O2 explicitly but have rather employed the relative decay pathways of CH2O2 (R27, R28, and R29) together with the rate of reaction R26 (see , bottom for the effective rate constants implemented in the chemistry scheme).
The results of the simulations including reactions R25 and R26 and the decay of the Criegee intermediate CH2O2 are shown in . As expected, the impact of reactions R25 and R26 on Antarctic stratospheric chlorine and ozone chemistry (including the branching ratio between the two reactions) can be neglected for most of the simulation period for which the Cl/ClO ratio remains low. Solely, in late September, when the Cl/ClO ratio increases strongly with decreasing ozone, a very slight impact of additional HCl formation (and thus less ozone depletion) is noticeable when the reaction CH3O2 + Cl is included, in particular when assuming a 0.2/0.8 branching ratio in favour of reaction R26.
Fig. 9. Simulations including the reaction products. The panels show HCl (a), active chlorine (ClOx, b), and ozone (c). The two branching ratios of this reaction and three decay channels for CH2O2 are taken into account (see for the details of the reactions implemented in the chemistry scheme). Ozone and ClOx mixing ratios are shown as 24 hour averages.
4. Discussion
The importance of methane oxidation and HOx chemistry for ozone loss in polar spring has been recognised for some time (Crutzen et al., Citation1992; Müller and Crutzen, Citation1994; Müller et al., Citation1994; Carl et al., Citation1996; Portmann et al., Citation1996; Jaeglé et al., Citation1997). In particular in the Antarctic, declining ozone concentrations lead to a strong increase in Cl and therefore to an increasingly rapid rate of the reaction
(R3)
(R3)
This rapid rate of formation of HCl, however, does not lead to deactivation because of the action of the HCl null cycle C1 (see appendix); only when eventually an imbalance of gas phase HCl production and heterogeneous HCl destruction develops, a very rapid, irreversible conversion of active chlorine into HCl (i.e. deactivation) occurs (e.g. Crutzen et al., Citation1992; Douglass et al., Citation1995; Carl et al., Citation1996; Grooß et al., Citation2011; Müller et al., Citation2018). The rapid conversion of active chlorine to HCl in the Antarctic is obvious in observations (Grooß et al., Citation1997; Santee et al., Citation2003, Citation2008; Sugita et al., Citation2013). A very rapid rate for reaction R3 in the lowermost stratosphere in late austral winter and in spring could also be observed as a signature in carbon isotope measurements in the lowermost stratosphere. Brenninkmeijer et al. (Citation1996) measured isotopically very light CO ( CO down to –47‰), which may only be explained by the dominant production of isotopically light CO in the reaction of Cl with CH4 (reaction R3) and thus through extremely high Cl concentrations in austral spring (Müller et al., Citation1996).
A rapid rate of reaction R3 in the polar stratosphere with the associated formation of CH3O2 radicals followed by the reaction of CH3O2 + ClO (reaction R6) leads to an enhanced production of HOx radicals, as noted already in the first study on reaction R6 (Simon et al., Citation1989). For cold conditions in the polar regions, when heterogeneous reactions and uptake of HNO3 in the particle phase may occur, this enhanced production of HOx radicals will lead to formation of HOCl followed by the heterogeneous reaction HCl + HOCl (reaction R2) (Crutzen et al., Citation1992; Müller and Crutzen, Citation1994; Müller et al., Citation1994; Jaeglé et al., Citation1997). Further, Portmann et al. (Citation1996) pointed out that for conditions of no uptake of HNO3 in the particle phase and no denitrification, HOx radicals will also partly be lost through the reaction HNO3 + OH (in addition to the HOx loss by HOCl). Lary and Toumi (Citation1997) reported that halogen-catalysed methane oxidation chemistry including reaction R6 may also be important for the ozone chemistry in the lower stratosphere outside of the polar regions.
The importance of the HCl null cycles (Müller et al., Citation2018, see also appendix), which has been corroborated here by a detailed analysis of the chemistry of CH3O2 for the conditions of the polar lower stratosphere in winter and spring has a bearing for the relevance of reaction rates, both heterogeneous and gas-phase, in the polar stratosphere. As long as reactions are sufficiently fast to sustain cycles C1 and C2 and faster than potential competitive reactions, the exact values of rate constants do not matter. Thus, the fate of CH3O2 is not sensitive here to the exact value of the rate constant of reaction R6 because the competitive reactions that would remove CH3O2 otherwise (i.e. the self-reaction R13 and the HO2 reaction R8) are too slow to compete with reaction R6 for any realistic value of the rate constant for reaction R6 (see Section 3.2). The same argument applies to the reaction CH3O2 + Cl (reactions R25 and R26, see Section Section 3.4).
Similarly, the exact value of the rate of the heterogeneous reaction R2 (and other heterogeneous reactions) does not matter, as (for the conditions considered here) it will very likely be always fast enough to sustain cycles C1 and C2. This is consistent with studies, which find very little impact of the nature of heterogeneous reactions (i.e. liquid particles, NAT, and ice) on stratospheric polar chlorine and ozone chemistry (Wegner et al., Citation2012; Drdla and Müller, Citation2012; Wohltmann et al., Citation2013; Kirner et al., Citation2015). In particular, Kirner et al. (Citation2015) find that for Antarctic chlorine and ozone loss chemistry even the impact of the substantial increase in heterogeneous reactivity through the formation of ice particles has very little effect on the simulated polar ozone loss; they report that in their simulations for high southern latitudes, heterogeneous chemistry on ice particles causes only up to 5 DU of additional ozone depletion.
In our model simulations, we find evidence for an enhanced production of formaldehyde (CH2O) when including reaction R6 into the chemical scheme, with peak values more than a factor of three higher () than without reaction R6. For the time period 8 September to 1 December 2003 indications of enhanced values of CH2O have been found in remote sensing measurements of the MIPAS instrument ( in Steck et al., Citation2008) and other remote sensing measurements of CH2O in the atmosphere are available (Ricaud et al., Citation2007; Dufour et al., Citation2009). For a more quantitative comparison, the averaging strategy for the remote sensing measurements should be tailored better to the conditions in the core of the Antarctic polar vortex in the lower stratosphere.
The same arguments apply to methanol. There are space borne measurements of methanol in the upper troposphere and lower stratosphere, albeit for much higher mixing ratios (Dufour et al., Citation2006; Santee et al., Citation2017). In-situ measurements of methanol in the remote free troposphere (5–10 km) range between 0.3 and 1.0 ppb (Singh et al., Citation1995) and measurements in the lower stratosphere are very variable with a mean value of 100 ppt (Singh et al., Citation2000). Measuring the low concentrations of methanol to be expected in the lower Antarctic stratosphere in spring (), will likely require selecting profiles showing extremely low ozone concentrations for an averaging procedure in remote sensing measurements.
The trajectory set-up used here, including a diabatic descent by about 35 K over the period of simulation, allows the chemical mechanisms to be analysed in detail. In contrast, analyses of chemical mechanisms over a polar winter and spring period on surfaces of a three-dimensional model, which are defined on isentropic or pressure surfaces will compare air volumes that are quite different over the period of interest (e.g. the air in the core of the polar vortex in the lower stratosphere between mid June and mid July descends by about 20 K). However, in our simulations mixing is entirely neglected. Although some mixing will certainly occur in reality, there is evidence that the core of the Antarctic vortex constitutes an air mass that is relatively unaffected by mixing with air from the edge of the polar vortex (Michelsen et al., Citation1999; Lee et al., Citation2001; Solomon et al., Citation2015). Furthermore, mixing across the vortex edge is likely overestimated in state-of-the-art models even when employing sophisticated Lagrangian or Eulerian transport schemes (Hoppe et al., Citation2014).
5. Conclusions
The box-model studies for the lowermost stratosphere (390–430 K potential temperature) in the core of the Antarctic vortex presented here corroborate and extend conclusions reported earlier (e.g. Crutzen et al., Citation1992; Grooß et al., Citation2011; Müller et al., Citation2018), namely that the reaction
(R6)
(R6)
is a key reaction for polar ozone loss. Recent new measurements of the rate constant (Leather et al., Citation2012; Ward and Rowley, Citation2016) do not alter this picture and have very little influence on the results of the box-model simulations reported here. The importance of reaction R6 stems from the supply of HO2 that leads to formation of
and thus ultimately to a depletion of HCl. In this way, reaction R6 leads to an HCl null cycle that allows the maintenance of high levels of active chlorine in spring when the rate of chlorine deactivation through HCl formation is high (Müller et al., Citation2018). The action of these null cycles allows the concentrations of active chlorine to remain high and thus ozone depletion to proceed. During the period of the lowest ozone concentrations enhanced values of CH3O2 are simulated and, as a consequence, enhanced values of formaldehyde (about 100 ppt) and methanol (about 5 ppt).
Reaction R6 has an alternative product channel, namely formation of methylhypochlorite
(R7)
(R7)
which has hitherto only received very limited consideration in studies of polar ozone loss (Helleis et al., Citation1994; Crowley et al., Citation1994; Carl et al., Citation1996; Müller et al., Citation1996). Here, because of the importance of CH3O2 for Antarctic chlorine chemistry and ozone loss, we have conducted a study employing the full polar chemistry of CH3O2 including both reactions R6 and R7 and the reaction CH3O2 + Cl. First, we find very little impact of the reaction CH3O2 + Cl on polar chlorine chemistry. Second, we find that formation of CH3OCl in the reaction CH3O2 + ClO (R7) does not constitute a substantial change to the relevance of the reaction CH3O2 + ClO for polar ozone loss in the core of the vortex in the lower stratosphere, provided that the main loss channels for CH3OCl, namely photolysis and reaction with Cl are taken into account. In our simulations, CH3OCl mixing ratios in the lowermost Antarctic stratosphere range between 10 and 250 ppt and peak at the time when the lowest ozone mixing ratios are reached. We have also investigated the possible impact of the hypothetical heterogeneous reaction of CH3OCl with HCl (Kenner et al., Citation1993; Crowley et al., Citation1994), which however does not significantly alter the chemical processes that determine active chlorine concentrations and polar ozone loss.
In summary, the reaction CH3O2 + ClO is important for polar ozone loss because it allows effective HCl null cycles to proceed which are responsible for the maintenance of high levels of active chlorine in polar spring when ozone is chemically destroyed at a large rate. The relevance of this reaction for polar ozone chemistry is not changed by including the formation of methylhypochlorite (CH3OCl) in this reaction (Helleis et al., Citation1994; Biggs et al., Citation1995; Tyndall et al., Citation1998) into the chemical scheme.
Supplemental data
Supplemental data for this article can be accessed here.
Supplemental Material
Download (6.1 KB)Supplemental Material
Download (3.6 MB)Supplemental Material
Download PDF (56.9 KB)Acknowledgements
We thank John Crowley, Ines Tritscher, and Reinhold Spang for very helpful discussions. Part of this work was done in the frame of the master’s thesis of A.M.Z at the Technische Universität Darmstadt; we thank Martin Ebert for supervising the thesis. We thank the European Centre for Medium-Range Weather Forecasts (ECMWF) for providing meteorological data sets.
Disclosure statement
No potential conflict of interest was reported by the authors.
Additional information
Funding
Related Research Data
References
- Anderson, J. G., Toohey, D. W. and Brune, W. H. 1991. Free radicals within the Antarctic vortex: the role of CFCs in Antarctic ozone loss. Science 251, 39–46. DOI: 10.1126/science.251.4989.39
- Becker, G., Grooß, J.-U., McKenna, D. S. and Müller, R. 2000. Stratospheric photolysis frequencies: impact of an improved numerical solution of the radiative transfer equation. J. Atmos. Chem. 37, 217–229. DOI: 10.1023/A:1006468926530
- Bernhard, G., Fioletov, V. E., Grooß, J.-U., Ialongo, I., Johnsen, B. and co-authors. 2017. Ozone and UV radiation [in “State of the Climate in 2016”]. Bull. Am. Meteorol. Soc. 98, S151–S154. DOI: 10.1175/2017BAMSStateoftheClimate.
- Biggs, P., Canosa-Mas, C. E., Fracheboud, J.-M., Shallcross, D. E. and Wayne, R. P. 1995. Efficiency of formation of CH3O in the reaction of CH3O2 with ClO. Geophys. Res. Lett. 22, 1221–1224. DOI: 10.1029/95GL01011, URL http://dx.doi.org/10.1029/95GL01011.
- Brenninkmeijer, C., Müller, R., Crutzen, P., Lowe, D., Manning, M. and co-authors. 1996. A large CO deficit in the lower Antarctic stratosphere due to “ozone hole” chemistry: Part I, Observations. Geophys. Res. Lett. 23, 2125–2128.
- Canty, T. P., Salawitch, R. J. and Wilmouth, D. M. 2016. The kinetics of the ClOOCl catalytic cycle. J. Geophys. Res. Atmos. 121, 13768–13783. DOI: 10.1002/2016JD025710.
- Carl, S. A., Roehl, C. M., Müller, R., Moortgat, G. K. and Crowley, J. N. 1996. Rate constant and mechanism of the reaction between Cl and CH3OCl at 295 K. J. Phys. Chem. 100, 17191–17201. DOI: 10.1021/jp9611075
- Chipperfield, M. P., Dhomse, S. S., Feng, W., McKenzie, R. L., Velders, G. J. M. and co-authors. 2015. Quantifying the ozone and ultraviolet benefits already achieved by the Montreal Protocol. Nat. Commun. 6, 7233. DOI: 10.1038/ncomms8233.
- Crowley, J. N., Helleis, F., Müller, R., Moortgat, G. K., Crutzen, P. J. and co-authors. 1994. CH3OCl: UV/Vis absorption cross-sections, J values and atmospheric significance. J. Geophys. Res. 99, 20683–20688.
- Crowley, J. N., Campuzano-Jost, P. and Moortgat, G. K. 1996. Temperature dependent rate constants for the gas-phase reaction between OH and CH3OCl. J. Phys. Chem. 100, 3601–3606. DOI: 10.1021/jp953018i
- Crutzen, P. J., Müller, R., Brühl, C. and Peter, T. 1992. On the potential importance of the gas phase reaction CH3O2+ClO→ClOO+CH3O and the heterogeneous reaction HOCl+HCl→H2O+Cl2 in “ozone hole” chemistry. Geophys. Res. Lett. 19, 1113–1116. DOI: 10.1029/92GL01172.
- Daële, V. and Poulet, G. 1996. Kinetics and products of the reactions of CH3O2 with Cl and ClO. J. Chim. Phys. 93, 1081–1099. DOI: 10.1051/jcp/1996931081
- Douglass, A. R., Schoeberl, M. R., Stolarski, R. S., Waters, J. W., Russell, J. M., III. and co-authors. 1995. Interhemispheric differences in springtime production of HCl and ClONO2 in the polar vortices. J. Geophys. Res. 100, 13967–13978.,
- Drdla, K. and Müller, R. 2012. Temperature thresholds for chlorine activation and ozone loss in the polar stratosphere. Ann. Geophys. 30, 1055–1073. DOI: 10.5194/angeo-30-1-2012.
- Dufour, G., Boone, C. D., Rinsland, C. P. and Bernath, P. F. 2006. First space-borne measurements of methanol inside aged southern tropical to mid-latitude biomass burning plumes using the ACE-FTS instrument. Atmos. Chem. Phys. 6, 3463–3470. DOI: 10.5194/acp-6-3463-2006.
- Dufour, G., Szopa, S., Barkley, M. P., Boone, C. D., Perrin, A. and co-authors. 2009. Global upper-tropospheric formaldehyde: seasonal cycles observed by the ACE-FTS satellite instrument. Atmos. Chem. Phys. 9, 3893–3910. DOI: 10.5194/acp-9-3893-2009.
- Fernandez, R. P., Kinnison, D. E., Lamarque, J.-F., Tilmes, S. and Saiz-Lopez, A. 2017. Impact of biogenic very short-lived bromine on the Antarctic ozone hole during the 21st century. Atmos. Chem. Phys. 17, 1673–1688. DOI: 10.5194/acp-17-1673-2017, URL. http://www.atmos-chem-phys.net/17/1673/2017/.
- Grooß, J.-U., Pierce, R. B., Crutzen, P. J., Grose, W. L. and Russell, J. M. 1997. Re-formation of chlorine reservoirs in southern hemisphere polar spring. J. Geophys. Res. 102, 13141–13152. DOI: 10.1029/96JD03505.
- Grooß, J.-U., Brautzsch, K., Pommrich, R., Solomon, S. and Müller, R. 2011. Stratospheric ozone chemistry in the Antarctic: what controls the lowest values that can be reached and their recovery? Atmos. Chem. Phys. 11, 12217–12226. DOI: 10.5194/acp-11-12217-2011
- Grooß, J.-U., Engel, I., Borrmann, S., Frey, W., Günther, G. and co-authors. 2014. Nitric acid trihydrate nucleation and denitrification in the Arctic stratosphere. Atmos. Chem. Phys. 14, 1055–1073. DOI: 10.5194/acp-14-1055-2014.
- Grooß, J.-U., Müller, R., Spang, R., Tritscher, I., Wegner, T. and co-authors. 2018. On the discrepancy of HCl processing in the core of the wintertime polar vortices. Atmos. Chem. Phys. 18, 8647–8666. DOI: 10.5194/acp-18-8647-2018. https://www.atmos-chem-phys.net/18/8647/2018/.
- He, H.-Q., Liu, J.-Y., Li, Z.-S. and Sun, C.-C. 2005. Theoretical study for the reaction of CH3OCl with Cl atom. J. Comput. Chem. 26, 642–650. DOI: 10.1002/jcc.20202.
- Helleis, F., Crowley, J. N. and Moortgat, G. 1993. Temperature-dependent rate constants and product branching ratios for the gas-phase reaction between CH3O2 and ClO. J. Phys. Chem. 97, 11464–11473. DOI: 10.1021/j100146a020
- Helleis, F., Crowley, J. N. and Moortgat, G. K. 1994. Temperature dependent CH3OCl formation in the reaction between CH3O2 and ClO. Geophys. Res. Lett. 21, 1795–1798. DOI: 10.1029/94GL01280.
- Hoppe, C. M., Hoffmann, L., Konopka, P., Grooß, J.-U., Ploeger, F. and co-authors. 2014. The implementation of the CLaMS Lagrangian transport core into the chemistry climate model EMAC 2.40.1: application on age of air and transport of long-lived trace species. Geosci. Model Dev. 7, 2639–2651. DOI: 10.5194/gmd-7-2639-2014. http://www.geosci-model-dev.net/7/2639/2014/.
- Hoppel, K., Bevilacqua, R., Canty, T., Salawitch, R. and Santee, M. 2005. A measurement/model comparison of ozone photochemical loss in the Antarctic ozone hole using Polar Ozone and Aerosol Measurement observations and the Match technique. J. Geophys. Res 32, D19304. DOI: 10.1029/2004JD005651.
- Hossaini, R., Chipperfield, M. P., Montzka, S. A., Leeson, A. A., Dhomse, S. S. and co-authors. 2017. The increasing threat to stratospheric ozone from dichloromethane. Nat. Comms. 8, 15962. DOI: 10.1038/ncomms15962.
- Jaeglé, L., Webster, C. R., May, R. D., Scott, D. C., Stimpfle, R. M. and co-authors. 1997. Evolution and stoichiometry of heterogeneous processing in the Antarctic stratosphere. J. Geophys. Res. 102, 13235–13253. DOI: 10.1029/97JD00935.
- Jungkamp, T. P., Kukui, A. and Schindler, R. N. 1995. Determination of rate constants and product branching ratios for the reactions of CH3O2 and CH3O with Cl atoms at room temperature. Ber. Bunsenges. Phys. Chem. 99, 1057–1066. DOI: 10.1002/bbpc.199500031
- Kenner, R. D., Ryan, K. R. and Plumb, I. C. 1993. Kinetics of the reaction of CH3O2 with ClO at 293 K. Geophys. Res. Lett. 20, 1571–1574.
- Kirner, O., Müller, R., Ruhnke, R. and Fischer, H. 2015. Contribution of liquid, NAT and ice particles to chlorine activation and ozone depletion in Antarctic winter and spring. Atmos. Chem. Phys. 15, 2019–2030. DOI: 10.5194/acp-15-2019-2015.
- Krisch, M. J., McCunn, L. R., Takematsu, K., Butler, L. J., Blase, F. R. and co-authors. 2004. Photodissociation of CH3OCl to CH3O + Cl at 248 nm. J. Phys. Chem. A 108, 1650–1656., DOI: 10.1021/jp0372082.
- Kühl, S., Dörnbrack, A., Wilms-Grabe, W., Sinnhuber, B.-M., Platt, U. and co-authors. 2004. Observational evidence of rapid chlorine activation by mountain waves above northern Scandinavia. J. Geophys. Res. 109. DOI: 10.1029/2004JD004797.
- Kukui, A., Roggenbuck, J. and Schindler, R. 1997. Mechanism and rate constants for the reactions of Cl atoms with HOCl, CH3OCl and tert-C4H9OCl. Ber. Bunsenges. Phys. Chem. 101, 281–286. DOI: 10.1002/bbpc.19971010217
- Kuttippurath, J. and Nair, P. J. 2017. The signs of Antarctic ozone hole recovery. Sci. Rep. 7, 585. DOI: 10.1038/s41598-017-00722-7.
- Lary, D. J. and Toumi, R. 1997. Halogen-catalyzed methane oxidation. J. Geophys. Res. 102, 23421–23428. DOI: 10.1029/97JD00914. http://dx.doi.org/10.1029/97JD00914.
- Leather, K. E., Bacak, A., Wamsley, R., Archibald, A. T., Husk, A. and co-authors. 2012. Temperature and pressure dependence of the rate coefficient for the reaction between ClO and CH3O2 in the gas-phase. Phys. Chem. Chem. Phys. 14, 3425–3434. DOI: 10.1039/C2CP22834C.
- Lee, A., Roscoe, H., Jones, A., Haynes, P., Shuckburgh, E. and co-authors. 2001. The impact of the mixing properties within the Antarctic stratospheric vortex on ozone loss in spring. J. Geophys. Res. 106, 3203–3211. DOI: 10.1029/2000JD900398.
- Lehmann, R. 2004. An algorithm for the determination of all significant pathways in chemical reaction systems. J. Atmos. Chem. 47, 45–78. DOI: 10.1023/B:JOCH.0000012284.28801.b1
- Livesey, N. J., Santee, M. L. and Manney, G. L. 2015. A Match-based approach to the estimation of polar stratospheric ozone loss using Aura Microwave Limb Sounder observations. Atmos. Chem. Phys. 15, 9945–9963. DOI: 10.5194/acp-15-9945-2015.
- Maricq, M. M., Szente, J. J., Kaiser, E. W. and Shi, J. 1994. Reaction of chlorine atoms with methylperoxy and ethylperoxy radicals. J. Phys. Chem. 98, 2083–2089. DOI: 10.1021/j100059a017.
- McKenna, D. S., Grooß, J.-U., Günther, G., Konopka, P., Müller, R. and co-authors. 2002. A new Chemical Lagrangian Model of the Stratosphere (CLaMS): 2. Formulation of chemistry scheme and initialization. J. Geophys. Res. 107, 4256. DOI: 10.1029/2000JD000113.
- Michelsen, H. A., Webster, C. R., Manney, G. L., Scott, D. C., Margitan, J. J. and co-authors. 1999. Maintenance of high HCl/Cly and NOx/NOy in the Antarctic vortex: a chemical signature of confinement during spring. J. Geophys. Res. 104, 26419–26436., DOI: 10.1029/1999JD900473.
- Müller, R. and Crutzen, P. J. 1993. A possible role of galactic cosmic rays in chlorine activation during polar night. J. Geophys. Res. 98, 20483–20490.
- Müller, R. and Crutzen, P. J. On the relevance of the methane oxidation cycle to “ozone hole” chemistry, in: Ozone in the troposphere and stratosphere, edited by Hudson, R. D., Proceedings of the Quadrennial Ozone Symposium 1992, pp. 298–301, 1994.
- Müller, R., Peter, T., Crutzen, P. J., Oelhaf, H., Adrian, G. P., V., Clarmann, T. and co-authors. 1994. Chlorine chemistry and the potential for ozone depletion in the Arctic stratosphere in the winter of 1991/92. Geophys. Res. Lett. 21, 1427–1430.
- Müller, R., Brenninkmeijer, C. and Crutzen, P. 1996. A large CO deficit in the lower Antarctic stratosphere due to “ozone hole” chemistry: Part II, Modelling. Geophys. Res. Lett. 23, 2129–2132.
- Müller, R., Grooß, J.-U., Lemmen, C., Heinze, D., Dameris, M. and co-authors. 2008. Simple measures of ozone depletion in the polar stratosphere. Atmos. Chem. Phys. 8, 251–264. DOI: 10.5194/acp-8-251-2008
- Müller, R., Grooß, J.-U., Zafar, A. M., Robrecht, S. and Lehmann, R. 2018. The maintenance of elevated active chlorine levels in the Antarctic lower stratosphere through HCl null cycles. Atmos. Chem. Phys. 18, 2985–2997. DOI: 10.5194/acp-18-2985-2018.
- Oman, L. D., Douglass, A. R., Salawitch, R. J., Canty, T. P., Ziemke, J. R. and co-authors. 2016. The effect of representing bromine from VSLS on the simulation and evolution of Antarctic ozone. Geophys. Res. Lett. 43, 9869–9876. DOI: 10.1002/2016GL070471.
- Parrondo, M. C., Gil, M., Yela, M., Johnson, B. J. and Ochoa, H. A. 2014. Antarctic ozone variability inside the polar vortex estimated from balloon measurements. Atmos. Chem. Phys. 14, 217–229. DOI: 10.5194/acp-14-217-2014.
- Pitts, M. C., Poole, L. R., Dörnbrack, A. and Thomason, L. W. 2011. The 2009–2010 Arctic polar stratospheric cloud season: A CALIPSO perspective. Atmos. Chem. Phys. 11, 2161–2177. DOI: 10.5194/acp-11-2161-2011.
- Pitts, M. C., Poole, L. R. and Gonzalez, R. 2018. Polar stratospheric cloud climatology based on CALIPSO spaceborne lidar measurements from 2006–2017. Atmos. Chem. Phys. 18, 10881–10913, https://doi.org/10.5194/acp-18-10881-2018.
- Portmann, R. W., Solomon, S., Garcia, R. R., Thomason, L. W., Poole, L. R. and co-authors. 1996. Role of aerosol variations in anthropogenic ozone depletion in the polar regions. J. Geophys. Res. 101, 6713–23006.
- Prather, M. J. 1992. More rapid ozone depletion through the reaction of HOCl with HCl on polar stratospheric clouds. Nature 355, 534–537. DOI: 10.1038/355534a0
- Ricaud, P., Alexandre, D., Barret, B., Le Flochmoën, E., Motte, E. and co-authors. 2007. Measurements of mid-stratospheric formaldehyde from the Odin/SMR instrument. J. Quant. Spectr. Radiat. Transfer 107, 91–104. DOI: :{10.1016/j.jqsrt.2007.01.058}.
- Sander, S. P., Abbatt, J., Barker, J. R., Burkholder, J. B., Friedl, R. R. and co-authors. 2011. Evaluation No. 17, JPL Publication 10-6, Chemical Kinetics and Photochemical Data for Use in Atmospheric Studies, Jet Propulsion Laboratory, Pasadena. http://jpldataeval.jpl.nasa.gov,.
- Santee, M., Manney, G., Livesey, N., Schwartz, M., Neu, J. and co-authors. 2017. A comprehensive overview of the climatological composition of the Asian summer monsoon anticyclone based on 10 years of Aura Microwave Limb Sounder measurements. J. Geophys. Res. Atmos. 122, 5491–5514. DOI: 10.1002/2016jd026408.
- Santee, M. L., Manney, G. L., Waters, J. W. and Livesey, N. J. 2003. Variations and climatology of ClO in the polar lower stratosphere from UARS Microwave Limb Sounder measurements. J. Geophys. Res. 108, 4454. DOI: 10.1029/2002JD003335.
- Santee, M. L., MacKenzie, I. A., Manney, G. L., Chipperfield, M. P., Bernath, P. F. and co-authors. 2008. A study of stratospheric chlorine partitioning based on new satellite measurements and modeling. J. Geophys. Res. 113, D12307, DOI: 10.1029/2007JD009057.
- Simon, F. G., Burrows, J. P., Schneider, W., Moortgat, G. K. and Crutzen, P. J. 1989. Study of the reaction ClO + CH3O2 → products at 300 K. J. Phys. Chem. 93, 7807–7813. DOI: 10.1021/j100360a017.
- Singh, H., Chen, Y., Tabazadeh, A., Fukui, Y., Bey, I. and co-authors. 2000. Distribution and fate of selected oxygenated organic species in the troposphere and lower stratosphere over the Atlantic. J. Geophys. Res. 105, 3795–3805. DOI: 10.1029/1999JD900779.
- Singh, H. B., Kanakidou, M., Crutzen, P. J. and Jacob, D. J. 1995. High concentrations and photochemical fate of oxygenated hydrocarbons in the global troposphere. Nature 378, 50–54. DOI: 10.1038/378050a0.
- Solomon, S. 1999. Stratospheric ozone depletion: A review of concepts and history. Rev. Geophys. 37, 275–316. DOI: 10.1029/1999RG900008.
- Solomon, S., Garcia, R. R., Rowland, F. S. and Wuebbles, D. J. 1986. On the depletion of Antarctic ozone. Nature 321, 755–758. DOI: 10.1038/321755a0
- Solomon, S., Mount, G. H., Sanders, R. W. and Schmeltekopf, A. L. 1987. Visible spectroscopy at McMurdo Station, Antarctica 2. Observations of OClO. J. Geophys. Res. 92, 8329–8338.
- Solomon, S., Portmann, R. W. and Thompson, D. W. J. 2007. Contrasts between Antarctic and Arctic ozone depletion. Proc. Natl. Acad. Sci. USA. 104, 445–449. DOI: 10.1073/pnas.0604895104
- Solomon, S., Kinnison, D., Bandoro, J. and Garcia, R. 2015. Simulation of polar ozone depletion: An update. J. Geophys. Res. Atmos. 120, 7958–7974. DOI: 10.1002/2015JD023365.
- Spang, R., Hoffmann, L., Müller, R., Grooß, J.-U., Tritscher, I. and co-authors. 2018. A climatology of polar stratospheric cloud composition between 2002 and 2012 based on MIPAS/Envisat observations. Atmos. Chem. Phys. 18, 5089–5113. DOI: 10.5194/acp-18-5089-2018, URL https://www.atmos-chem-phys.net/18/5089/2018/.
- Steck, T., Glatthor, N., von Clarmann, T., Fischer, H., Flaud, J. M. and co-authors. 2008. Retrieval of global upper tropospheric and stratospheric formaldehyde (H2CO) distributions from high-resolution MIPAS-Envisat spectra. Atmos. Chem. Phys. 8, 463–470., DOI: 10.5194/acp-8-463-2008
- Sugita, T., Kasai, Y., Terao, Y., Hayashida, S., Manney, G. L. and co-authors. 2013. HCl and ClO profiles inside the Antarctic vortex as observed by SMILES in November 2009: comparisons with MLS and ACE-FTS instruments. Atmos. Meas. Tech. 6, 3099–3113. DOI: 10.5194/amt-6-3099-2013, URL http://www.atmos-meas-tech.net/6/3099/2013/.
- Sumińska-Ebersoldt, O., Lehmann, R., Wegner, T., Grooß, J.-U., Hösen, E. and co-authors. 2012. ClOOCl photolysis at high solar zenith angles: analysis of the RECONCILE self-match flight. Atmos. Chem. Phys. 12, 1353–1365. DOI: 10.5194/acp-12-1353-2012.
- Tilmes, S., Müller, R., Engel, A., Rex, M. and Russell, I. I. I., J. 2006. Chemical ozone loss in the Arctic and Antarctic stratosphere between 1992 and 2005. Geophys. Res. Lett. 33, L20812, DOI: 10.1029/2006GL026925.
- Toohey, D. W., Avallone, L. M., Lait, L. R., Newman, P. A., Schoeberl, M. R. and co-authors. 1993. The seasonal evolution of reactive chlorine in the northern hemisphere stratosphere. Science 261, 1134–1136. DOI: 10.1126/science.261.5125.1134
- Tripathi, O. P., Godin-Beekmann, S., Lefèvre, F., Pazmino, A., Hauchecorne, A. and co-authors. 2007. Comparison of polar ozone loss rates simulated by 1-D and 3-D models with Match observations in recent Antarctic and Arctic winters. J. Geophys. Res. 112, D12308. DOI: 10.1029/2006JD008370.
- Tuck, A. F. 1989. Synoptic and chemical evolution of the Antarctic vortex in late winter and early spring, 1987. J. Geophys. Res. 94, 11687–11737.
- Tyndall, G. S., Wallington, T. J. and Ball, J. C. 1998. FTIR Product Study of the Reactions CH3O2 + CH3O2 and CH3O2 + HO2. J. Phys. Chem. A 102, 2547–2554. DOI: 10.1021/jp972784h
- Tyndall, G. S., Cox, R. A., Granier, C., Lesclaux, R., Moortgat, G. K. and co-authors. 2001. Atmospheric chemistry of small organic peroxy radicals. J. Geophys. Res. 106, 12157–12182.
- Vaghjiani, G. and Ravishankara, A. 1989. Kinetics and mechanism of OH reaction with CH3OOH. J. Phys. Chem 93, 1948–1959. DOI: 10.1021/j100342a050
- Vereecken, L., Nguyen, T. L., Hermans, I. and Peeters, J. 2004. Computational study of the stability of α-hydroperoxyl- or α-alkylperoxyl substituted alkyl radical. Chem. Phys. Lett. 393, 432–436. DOI: 10.1016/j.cplett.2004.06.076.
- Vogel, B., Müller, R., Deshler, T., Grooß, J.-U., Karhu, J. and co-authors. 2003. Vertical profiles of activated ClO and ozone loss in the Arctic vortex in January and March 2000: In situ observations and model simulations. J. Geophys. Res. 108, 8334. DOI: 10.1029/2002JD002564.
- von Clarmann, T. 2013. Chlorine in the stratosphere. Atmósfera 26, 415–458. DOI: 10.1016/S0187-6236(13)71086-5
- von Clarmann, T., Funke, B., Glatthor, N., Kellmann, S., Kiefer, M. and co-authors. 2012. The MIPAS HOCl climatology. Atmos. Chem. Phys. 12, 1965–1977. DOI: 10.5194/acp-12-1965-2012.
- Ward, M. K. M. and Rowley, D. M. 2016. Kinetics of the ClO + CH3O2 reaction over the temperature range T = 250–298 K. Phys. Chem. Chem. Phys. 18, 13646–13656. DOI: 10.1039/C6CP00724D, URL http://dx.doi.org/10.1039/C6CP00724D.
- Wegner, T., Grooß, J.-U., von Hobe, M., Stroh, F., Sumińska-Ebersoldt, O. and co-authors. 2012. Heterogeneous chlorine activation on stratospheric aerosols and clouds in the Arctic polar vortex. Atmos. Chem. Phys. 12, 11095–11106. DOI: 10.5194/acp-12-11095-2012.
- Wetzel, G., Oelhaf, H., Birk, M., de Lange, A., Engel, A. and co-authors. 2015. Partitioning and budget of inorganic and organic chlorine species observed by MIPAS-B and TELIS in the Arctic in March 2011. Atmos. Chem. Phys. 15, 8065–8076. DOI: 10.5194/acp-15-8065-2015, URL http://www.atmos-chem-phys.net/15/8065/2015/.
- WMO 2014. Scientific assessment of ozone depletion:, Global Ozone Research and Monitoring Project–Report No. 55, Geneva, Switzerland, 2014.
- Wohltmann, I., Wegner, T., Müller, R., Lehmann, R., Rex, M. and co-authors. 2013. Uncertainties in modelling heterogeneous chemistry and Arctic ozone depletion in the winter 2009/2010. Atmos. Chem. Phys. 13, 3909–3929. DOI: 10.5194/acp-13-3909-2013
- Wohltmann, I., Lehmann, R. and Rex, M. 2017. A quantitative analysis of the reactions involved in stratospheric ozone depletion in the polar vortex core. Atmos. Chem. Phys. 17, 10535–10563. DOI: 10.5194/acp-17-10535-2017, URL https://www.atmos-chem-phys.net/17/10535/2017/.
- Zafar, A. M. Stratospheric ozone depletion: Analysis of heterogeneous chemistry in the Antarctic, no. 4394 in Berichte des Forschungszentrums Jülich, Forschungszentrum Jülich, available from: 2016. www.fz-juelich.de/zb/openaccess.
Appendix
The HCl null cycles responsible for the maintenance of high levels of active chlorine throughout Antarctic spring have been formulated previously, but are repeated in this appendix for reference. Cycle C1 (Crutzen et al., Citation1992; Müller and Crutzen, Citation1994; Müller et al., Citation2018) starts with HCl production in the reaction (R3)
(R3)
(R31)
(R31)
(R6)
(R6)
(R15)
(R15)
(R32)
(R32)
(R2)
(R2)
(R20)
(R20)
(R33)
(R33)
Further, the formation of HCl in the reaction
(R4)
(R4)
leads to the following cycle (C2, Müller et al., Citation2018):
(R4)
(R4)
(R34)
(R34)
(R32)
(R32)
(R2)
(R2)
(R20)
(R20)
(R33)
(R33)
In an earlier study (Müller et al., Citation2018), the efficiency of these cycles for maintaining high levels of active chlorine in polar spring was demonstrated based on the temporal development of the rates of the key chemical processes by applying a unique algorithm for the determination of chemical pathways (Lehmann, Citation2004). Müller et al. (Citation2018) reported for the first days of September rates of HCl recycling of 88 ppt in 10 days through cycle C1 and of 26 ppt in 10 days through cycle C2. In contrast, for the last days of September (21–30), the rate of recycling of HCl in cycles C1 and C2 is reported to be much more rapid (rates of 3.7 ppb in 10 days and 2.9 ppb in 10 days respectively Müller et al., Citation2018).