
 ?Mathematical formulae have been encoded as MathML and are displayed in this HTML version using MathJax in order to improve their display. Uncheck the box to turn MathJax off. This feature requires Javascript. Click on a formula to zoom.
Abstract
Cloud Condensation Nuclei (CCN) concentration and aerosol size distributions in the Arctic were collected during the period 2007–2013 at the Zeppelin observatory (78.91° N, 11.89° E, 474 masl). Annual median CCN concentration at a supersaturation (SS) of 0.4% show the ranges of 45 ∼ 81 cm−3. The monthly median CCN number density varied between 17 cm−3 in October 2007 and 198 cm−3 in March, 2008. The CCN spectra parameters C (83 cm−3) and k (0.23) were derived. In addition, calculated annual median value of hygroscopicity parameter is 0.46 at SS of 0.4%. Particle number concentration of accumulation mode from aerosol size distribution measurements are well correlated with CCN concentration. The CCN to CN>10 nm (particle number concentration larger than 10nm in diameter) ratio shows a maximum during March and minimum during July. The springtime high CCN concentration is attributed to high load of accumulation mode aerosol transported from the mid-latitudes, known as Arctic Haze. CCN concentration remains high also during Arctic summer due to the source of new CCN through particle formation followed by consecutive aerosol growth. Lowest aerosol as well as CCN number densities were observed during Arctic autumn and early winter when aerosol formation in the Arctic and long-range transport into the Arctic are not effective.
1. Introduction
Aerosols play important roles in Earth’s climate and the hydrological cycle through their direct and indirect effects. Emitted by natural and anthropogenic sources, aerosols can directly influence climate by reflecting or absorbing the Sun radiation. They also affect climate indirectly by seeding clouds and changing cloud properties, such as cloud reflectivity and lifetime (IPCC, Citation2013).
The Arctic is a pristine and particularly sensitive region. This is manifested by a stronger warming trend compared to the rest of the globe and high sensitivity to climate perturbations (Law and Stohl, Citation2007; Shindell and Faluvegi, Citation2009; Screen et al., Citation2012). The Arctic tropospheric aerosol shows large variations in number concentrations, aerosol size distribution and chemical composition (Stone et al., Citation2014). This variability can be largely attributed to varying seasonal influence of meteorology, long-range air mass transport, and local vs remote aerosol sources and sinks (Tunved et al., Citation2013). Tunved et al. (Citation2013) showed repeating consistent annual cycle of aerosol number size distribution based on a decade of observations at Zeppelin station, Ny-Ålesund, Svalbard. They found that a strikingly sharp transition between spring and summer periods represents a regime shift between a polluted spring and a relatively cleaner summer (Engvall et al., Citation2008; Tunved et al., Citation2013).
Late winter and spring is a period with strongest influence of long-range transport aerosols from sources at lower latitudes, the so-called Arctic Haze (Mitchell, Citation1957). In contrast, late summer and early fall are the cleanest periods with the lowest accumulation mode number density and aerosol mass concentration, although number concentration of particles is highest in summer (Ström et al., Citation2003; Ström et al., Citation2009). Summer and early fall conditions are occasionally perturbed by events of enhanced aerosol loadings often linked to boreal forest fires (Stohl et al., Citation2006). During fall and early winter, long-range transport into the Arctic is rather inefficient and new particle formation ceases too. Result is very low and stable aerosol concentrations and properties.
Important characteristics of Arctic aerosols is their role as cloud condensation nuclei (CCN). The CCN number concentration is a key factor used to estimate possible indirect aerosol effect on climate through aerosol driven modulation of cloud microphysical properties. An increase in CCN number concentration increases the cloud droplet number concentration (Twomey and Warner, Citation1967; Ramanathan et al., Citation2001). Clouds formed under high CCN concentrations tend to have a greater number of smaller droplets, which changes cloud albedo, cloud lifetime and precipitation (Albrecht, Citation1989; Deng et al., Citation2013). The CCN property is controlled by both, size and composition of aerosols (Hämeri et al., Citation2001).
Looking at some previous studies, Bigg and Leck (Citation2001) reported CCN concentrations measured from an icebreaker at latitudes higher than 80° N, which ranged between 1 and 1,000 cm−3 at a SS of 0.25% during the whole measurement period (from July to September, 1996). Andreae (Citation2009) showed that CCN concentration in remote marine regions is 110 cm−3.
Zábori et al. (Citation2015) reported size resolved CCN measurements at Zeppelin station for June and August 2008, and presented hygroscopicity and aerosol trajectory analysis. They showed that air masses are originated from the Arctic during the measurement period in June 2008, whereas the measurements from August 2008 were influenced by mid-latitude air masses.
There have also been several studies on using aircraft for determining Arctic CCN concentration (Hegg et al., Citation1995, Citation1996; Yum and Hudson, Citation2001; Moore et al., Citation2011; Lathem et al., Citation2013). The studies show the high variability of CCN concentration in the Arctic region; this is mainly thought to be due to different CCN source regions (upper troposphere vs. lower boundary layer), production/loss mechanisms, in–cloud processing and air mass origins (Shindell et al., Citation2008; Browse et al., Citation2012).
Data on long term Arctic region CCN are sparse and majority of studies available are constrained to temporarily limited field experiment. Previous results show a variation in CCN concentration depending on air mass origin (Hoppel et al., Citation1973; Shaw Citation1986; Martin et al., Citation2011). Shaw (Citation1986) measured CCN spectra of Arctic haze for January and February, 1985 in central Alaska, and found that CCN concentrations to be few hundred per cm3. Martin et al. (Citation2011) measured CCN particles during a cruise conducted for three weeks in August/September, 2008. At a mean SS of 0.10%, mean CCN concentration was 14.0 ± 11.0 cm−3. Hoppel et al. (Citation1973) presented aircraft measurements in February, 1972 above Alaska. During the period of their measurements, an increase in CCN concentration from about 100 cm−3 to about 400 cm−3 was measured at 1.75 km and 4 km altitude, respectively. However, the direct comparison is not easy due to the different supersaturation as well as various measurement conditions.
In this study, seven years (2007–2013) of CCN measurements at the Zeppelin observatory at Svalbard are analysed and discussed with respect to long-term and seasonal variability and trends. To our knowledge, this study presents first long-term CCN observations on seasonal and annual scales from the Arctic region.
2. Experimental measurements
2.1. Measurement site
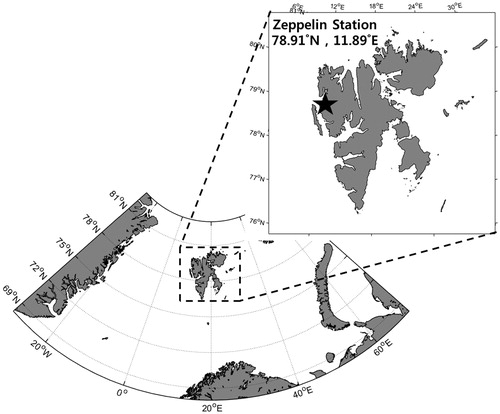
The CCN and ambient aerosol measurements were carried out at the Zeppelin research station (78.91° N, 11.89° E, 474 masl), situated about 2 km south–west of the small settlement of Ny-Ålesund, Svalbard (). The CCN measurements started at Zeppelin in year 2007. In this study, the analysis cover the period of 7 years from 2007 to 2013. The station is considered to be within the atmospheric boundary layer, but above the local inversion layer most of the time (Tunved et al., Citation2013). This unique location makes the observatory an ideal platform for the Arctic lower troposphere studies.
Fig. 1. Location of Zeppelin station, Ny-Ålesund, Svalbard.
2.2. Instrumentation and experimental setup
The commercial Droplet Measurement Technologies (DMT) CCN counter with one column (CCNC-100) was used to measure CCN concentrations at supersaturations (SS) of 0.2, 0.4, 0.6, 0.8 and 1%. In CCNC scanning mode, each SS level was measured for 5 min (SS of 0.2% was measured for 10 min) before changing to the next. After completion of the cycle at 1% SS level, measurements started again from 0.2%. In DMT CCNC measurement system, a positive temperature gradient is applied to the CCN column in the streamwise direction. Supersaturation is controlled by the streamwise temperature gradient, total flow rate, and pressure (Lance et al., Citation2006).
Particle number size distributions in a range between 0.01 and 0.561 µm were measured by a closed–loop differential mobility particle sizer (DMPS), consisting of a medium size Hauke differential mobility analyzer in combination with a TSI condensation particle counter (CPC 3010). Measurements were done with a time resolution of 10 min from 2007 to 2010, and 20 min from 2011 to 2013. The difference in the time resolution of DMPS measurements were due to system setting change. In addition to the DMPS, particle number concentrations was measured by a TSI CPC 3010, particle number concentrations larger than 10 nm in diameter (CN >10 nm), with 1 min time interval. All physical indicators have been checked by in-situ operational personnel. Details about aerosol measurements can be found in Tunved et al. (Citation2013).
2.3. Sampling periods and data analysis
In this study, data from April, 2007 to March, 2013 are analysed. Data are based on hourly median values; Daily (24 h), monthly and annual median values are derived from the hourly median values. All medians having less than 50% data coverage are discarded. The 54 monthly median data were used out of total 72 months. Corresponding aerosol size distributions were processed with lognormal modal fitting to derive size distribution modal properties.
3. Results and discussion
3.1. Annual and seasonal trends of CCN concentration
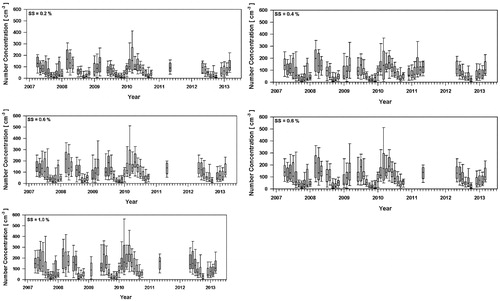
We analysed the CCN concentration for the various supersaturation (from 0.2% to 1.0%). At SS of 0.4%, for example, the annual median concentrations were 77 cm−3 in 2008, 64 cm−3 in 2009 and 81 cm−3 in 2010. We did not calculate annual median concentration for 2007 and 2011–2013 as we did not have sufficient data from all four seasons for these years.
shows median monthly CCN number concentration during the period April 2007 –March 2013. Data between June, 2011 and April 2012 are missing due to instrument failure. The monthly CCN concentrations throughout the periods show a high variability with one order of fluctuation. During the periods, the lowest monthly median CCN concentration of 17cm−3 was observed in October 2007, while the highest value of 198cm‐3 was measured in March 2008, both at SS of 0.4%.
Fig. 2. Monthly median CCN number concentration at various supersaturation (SS) values, April, 2007–March, 2013 (25–75th percentile ranges: Horizontal bars and corresponding values in the boxes represent median concentrations, the box plot of the first and third quartiles, and the bars represent the 10th and 90th percentiles).
shows the monthly CCN number concentration for all supersaturations (0.2%, 0.4%, 0.6%, 0.8% and 1.0%). Median CCN concentration is highest during the spring season, remains at relatively high levels in summer, and falls to annual minima during autumn and early winter. In winter, the CCN concentration slowly increases towards a sharp rise in following spring year. This seasonal trend is consistent and repeating every year as shown in . also shows that, the CCN concentration increases as SS increases.
Fig. 3. Box plot of Monthly median CCN number concentration at various supersaturations (SS): April 2007–March 2013.
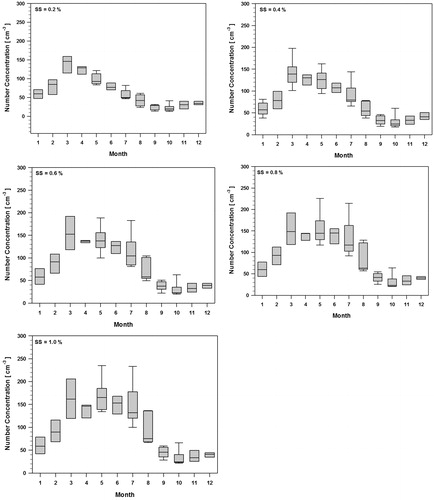
The increase of CCN during spring is closely linked to Arctic Haze period and it has been reported in several earlier studies (Shaw, Citation1986; Shindell et al., Citation2008; Moore et al., Citation2011). However, previous studies have not considered the significance of high CCN levels recorded in summer. During the Arctic Haze period several pollutant display dramatic increases in the concentrations levels (Quinn et al., Citation2007) but the effect of Arctic Haze ceases during rather sharp transition to summer conditions during late May-early June (Engvall et al., Citation2008). This means that the CCN in summer have different origin.
3.2. Aerosol size distribution and CCN concentration
shows the median values of monthly aerosol number size distribution and shows the three lognormal parameters (total number concentration, geometric standard deviation and geometric mean diameter) for the Aitken mode and accumulation mode, respectively. All the parameters shown in Table 1 are seasonal median values. The Aitken mode number concentration ranges from 7.3 to 31.3cm‐3 during autumn to spring (September to May), however, in summer (June to August), it increases distinctively to 112.0cm‐3. In terms of accumulation mode, the number concentration increases to 107.5cm‐3 in spring, and remain relatively high during summer (83.4cm‐3). In autumn and winter, typical Aitken and accumulation mode aerosol concentrations are 12.77cm‐3 and 27.59cm‐3 in autumn and 7.31cm‐3 and 36.81cm‐3 in winter, respectively. Based on the characteristics of aerosol size distribution and CCN concentration, the accumulation mode aerosol is dominant sources of CCN thorough year. The seasonal median ratios of the CCN to Accumulation mode are the 1.201, 1.212, 0.951, and 0.952 for winter, spring, summer and autumn respectively at the SS of 0.4%. The CCN to accumulation mode ratio higher than one in autumn and winter shows that due to low accumulation mode aerosol number density also significant part of the Aitken mode aerosol is activated as CCN.
Table 1. Seasonal variation in the parameters for bimodal lognormal aerosol size distribution.
In spring, the increase in accumulation mode aerosol particles associated with Arctic Haze is main driver behind high CCN concentrations (). In summer, Aitken mode particles increase more than two fold compared to spring. The Aitken mode which is prominent in the summer is an indication of local origin of particles (Heintzenberg and Leck, Citation2012; Herenz et al., Citation2018). Summer is the main nucleation period and aerosol population in the Arctic is controlled dominantly by new particle formation (Tunved et al., Citation2013). Dimethyl sulphide (DMS) plays an important role in the formation, and growth, of new particles through its oxidation to sulphuric acid and other products (Leaitch et al., Citation2013; Willis et al., Citation2016; Park et al., Citation2017; Yoon et al., Citation2017). Growth from Aitken to accumulation mode is likely due to cloud processing (Hatzianastassiou et al., Citation1998; O’Dowd et al., Citation2000; Leaitch et al., Citation2013; Croft et al., Citation2016). Willis et al. (Citation2016) showed the importance of secondary marine aerosol formation and its role in growing nucleation mode particles into CCN active sizes in the clean summer Arctic atmosphere. These local origin particles cannot grow enough, compared with long-range transport particles, which makes the geometric mean diameter of accumulation mode particles as well as activation ratio smaller than in spring.
Fig. 4. Monthly variations in aerosol median size distribution.
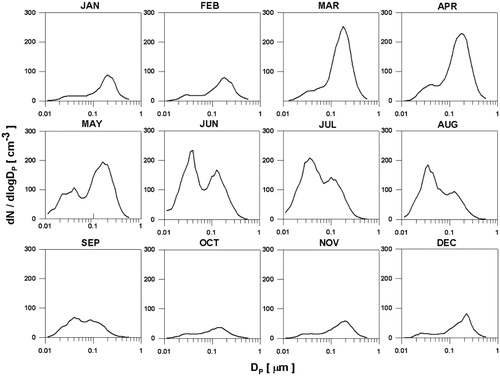
Fig. 5. Monthly ratios of the CCN to the CN >10nm (particle concentration larger than 10nm in diameter) at various SS.
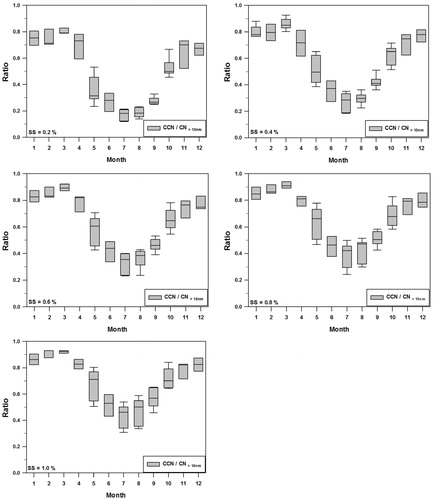
Fig. 6. Activation ratios of the CCN to CN >10nm (particle concentration larger than 10nm in diameter) as a function of SS.
Generally, natural aerosol chemical composition display quite different seasonal cycles compared to anthropogenic components (Quinn et al., Citation2002) as the spring and summer aerosols originate from different sources (Barrie, Citation1967; Quinn et al., Citation2007). DMS is an important gaseous precursor for summer Arctic aerosol (Bigg et al. Citation2004; Matrai et al. Citation2008; Deshpande and Kamra, Citation2014). The enrichment of DMS and its biogenic precursor, proteins and chlorophyll-a in ocean surface microlayer take place during late spring and early summer. Li et al. (Citation1993) showed that methane sulphonic acid concentrations begin to increase in April, and reach peak values in May to September. The earlier peak has been attributed to long–range transport and the later peak is mainly due to local production as the ice recedes and phytoplankton productivity in surface waters become more active. Black carbon concentration annual cycle as an indicator of anthropogenic influence distinctly increases during spring from March to May (Sinha et al., Citation2017) indicating increasing black carbon loading associated with long range transport of air pollutants from mid-latitudes. After Spring‐to‐summer transition the aerosol absorption coefficient and other anthropogenic pollution tracers decrease rapidly and remain low until late winter and spring following year. The CCN to particle concentration (CN) ratio provides information on how large fraction of aerosol population will act in cloud formation. In this study, the ratio is derived using aerosol number concentration larger than 10 nm in diameter (CN>10nm) and CCN number concentration (Zábori et al., Citation2015).
Figure 5 shows the ratio of CCN to CN>10nm, which can be defined as the activation ratio (AR). As shown in , monthly ratios of the CCN to CN>10nm show distinct annual cycle, with high values in winter and early spring, and then decreasing from April to July or August. In spring, high CCN concentration levels make the CCN to CN>10nm ratio higher and this is mainly because the aerosol is dominated by accumulation mode. The ratio is at a minimum in summer due to the increase in Aitken mode particle at that time. The CCN/CN>10nm ratio shows a maximum during March (0.85) and minimum during July (0.28) for the case of SS=0.4%.
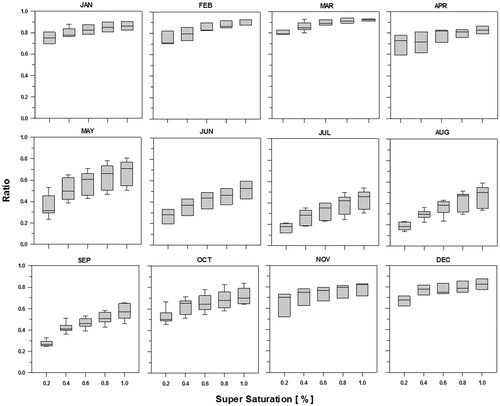
In order to examine the activation efficiencies of CN into CCN at each supersaturation levels, the monthly mean activation ratio (AR=CCN/CN>10nm) are plotted in Figure 6 as a function of SS (from 0.2 to 1.0%). The AR () increases steadily with an increase in SS but the fractional contributions of CN>10nm to CCN (i.e., AR) are different thorough the year. Thus, the large AR (0.8∼0.9 in this study) for higher supersaturation (e.g. SS>0.6%) means that the considerable smaller particles are activated to CCN at a given SS. In case of summer, however, the AR stay down less than 0.5 even for high supersaturation (SS >0.6%), suggesting that a significant fraction of CN>10nm still remain unactivated.
3.3. CCN spectra
CCN spectra parameterisation provides an efficient way to estimate CCN number concentrations as a function of SS, with very few constants required for numerical modelling. One of the parameterisation of CCN concentration is a power law, as a function of supersaturation as follows (Zábori et al., Citation2015; Kim et al., Citation2017):
(1)
(1)
where N[CCN] is CCN number concentration and SS is supersaturation in percent.
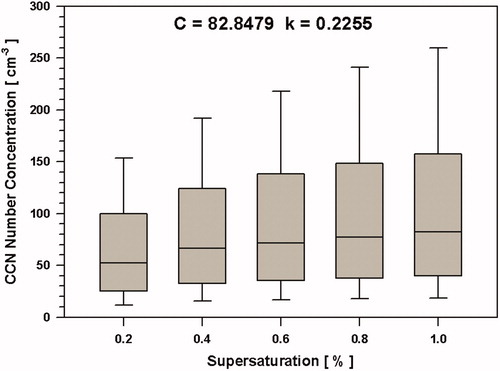
The C value may explain how many CCNs is available at certain supersaturation and the k exponent represents how efficiently the ambient particles can act as CCN. If the k is highest in the summer, this means that particles can act as CCN most efficiently as a function of SS, which means, as SS increases. Particles can act as CCN more efficiently in summer seasons. In this study, the coefficients C and k are given by the fitted power-law function applied to the daily median CCN from SS of 0.2 to 1. For the sampling period 2007–2013, the parameters C and k are C = 82.8 cm−3 and k = 0.2255, as shown in . Compared with C and k values from other studies, the current results are within the range of remote region values. For example, Rogers and Yau (Citation1996) reported parameter ranges of 30 to 300 cm−3 and 0.3 to 1.0, for C and k respectively, for maritime air, and ranges of 300 to 3000 cm−3 and 0.2 to 2.0 for continental air.
Figure 7. Box plot of daily median CCN concentration for each supersaturation (SS) values. Medians of the total numbers of CCN for each SS scan.
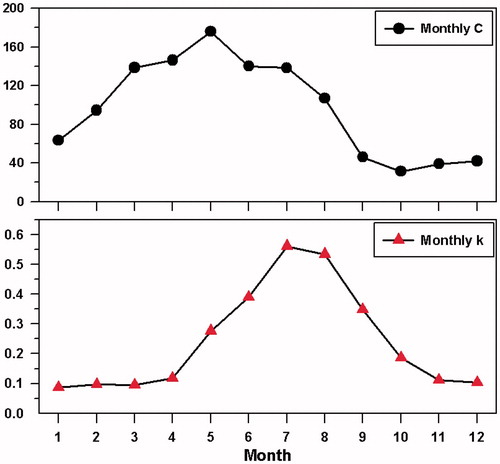
According to Hegg et al. (Citation1991) CCN spectra vary with season; they found C and k are generally larger in summer than in winter. The long-term measurements in our study show that the spectra parameters vary seasonally and monthly (). shows that C values increase during spring (maximum in May) and remain low in autumn and winter. The k value ranges from 0.0869 (in January) to 0.5606 (in July), and is at a maximum in summer (June to August). This means CCN concentration dependency on SS change is more sensitive during summer than in spring and other seasons. Zábori et al. (Citation2015) used data from 2008 and reported k values of 0.482 with C values of 221 at Zeppelin for June 2008. Using the presented dataset we also derived the hygroscopic parameter κ (Petters and Kreidenweis, Citation2007). The hygroscopicity parameter, κ, has an upper limit of ∼1.4 for the most hygroscopic atmospheric aerosol. Thus, lower values of κ indicate less-hygroscopic, or less CCN-active, behaviour.
Fig. 8. Monthly variations of CCN spectra parameters (C and k) during the sampling periods.
κ values can be defined as follows:
(2)
(2)
where σw is surface tension of water, R is the universal gas constant, T is the temperature, Mw is the molecular weight of water, and ρw is the density of water.
According to Furutani et al. (Citation2008), the critical diameter, above which the aerosols activate as CCN, Dact, can be calculated as follows
(3)
(3)
where Ntot is total number concentrations of aerosol particles. D is the electric mobility diameter. In this study, D0 was assumed to be 10 nm at the beginning of the DMPS scan. From this calculation, the κ values were estimated using a monthly median CCN concentration. As a result, the annual mean κ value at a SS of 0.4% was calculated to be 0.46 and the critical diameter 0.07 μm.
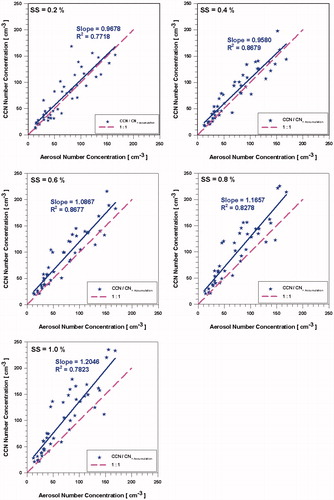
compares aerosol number concentration of accumulation mode with CCN number concentration. As shows, the correlation between CCN and accumulation mode is well correlated with each other for all the SS (from 0.7718 to 8679). The slope of CCN concentration with accumulation mode ranges from 0.9580 at SS of 0.4% to 1.2046 at SS of 1.0%. Subsequently, these results show that accumulation mode is the main contributor to CCN.
Fig. 9. Comparison of the CCN concentration versus aerosol number concentrations of accumulation mode.
4. Summary
In this study, first long-term CCN measurements in the Arctic are reported and analysed with major focus on seasonal variability and links to aerosol size distribution. Sampling at the Zeppelin observatory, located on top of Mt. Zeppelin in Ny Ålesund, Svalbard, was carried out from 2007 to 2013. Annual median CCN concentration ranges between 45 and 81 cm−3, and that CCN varies on a seasonal basis and has distinctive annual cycle. The CCN number concentration increases drastically during the spring, remains high during summer and decreases towards annual minimum in autumn and early winter. The high spring CCN concentration is linked to long-range transport of polluted air masses from lower latitudes known as Arctic haze. In contrast to spring, relatively high CCN number concentration during summer is driven by processes within the Arctic and it is a result of new particle formation followed by consecutive growth by condensation and in-cloud processing.
CCN spectra parameterisation gives values for parameters C and k for the entire sampling period (2007–2013), based on daily median values, of C = 82.8 cm−3 and k = 0.2255. Correlations between CCN and particle number concentrations show that thorough the year all accumulation mode aerosol particles act as CCN at supersaturation >0.2%. During autumn and winter, when accumulation mode aerosol concentration is lowest, also significant fraction of Aitken mode aerosol exist and this is most likely related with cloud formation. Future studies linking also aerosol chemical composition with the observed CCN behaviour will provide insightful information towards more comprehensive understanding of aerosol-cloud interactions in the Arctic.
Supplemental data
Supplemental data for this article can be accessed https://doi.org/10.1080/16000889.2018.1513291
Supplemental Material
Download MS Word (17 KB)Acknowledgements
Authors appreciate the support from Norwegian Polar Institute and the staffs of the Zeppelin station. We would like to also thank Tabea Hennig and Birgitta Noone from Stockholm University for instrumental maintenance and support.
Disclosure statement
No potential conflict of interest was reported by the authors.
Additional information
Funding
Related Research Data
References
- Albrecht, B. A. 1989. Aerosols, cloud microphysics, and fractional cloudiness. Science 245, 1227–1230. doi:10.1126/science.245.4923.1227.
- Andreae, M. O. 2009. Correlation between cloud condensation nuclei concentration and aerosol optical thickness in remote and polluted regions. Atmos. Chem. Phys. 9, 543–556. doi:10.5194/acp-9-543-2009.
- Barrie, L. A. 1967. Arctic air pollution: an overview of current knowledge. Atmos. Environ. 20, 643–663. doi:10.1016/0004-6981(86)90180-0.
- Bigg, E. K. and Leck, C. 2001. Cloud-active particles over the central Arctic Ocean. J. Geophys. Res. 106, 32155–32166. doi:10.1029/1999jd901152.
- Bigg, E. K., Leck, C. and Tranvik, L. 2004. Particulates of the surface microlayer of open water in the central Arctic Ocean in summer. Mar. Chem. 91, 131–141. doi:10.1016/j.marchem.2004.06.005.
- Browse, J., Carslaw, K. S., Arnold, S. R., Pringle, K. and Boucher, O. 2012. The scavenging processes controlling the seasonal cycle in Arctic sulphate and black carbon aerosol. Atmos. Chem. Phys. 12, 6775–6798. doi:10.5194/acp-12-6775-2012.
- Croft, B., Martin, R. V., Leaitch, W. R., Tunved, P., Breider, T. J. and co-authors. 2016. Processes controlling the annual cycle of Arctic aerosol number and size distributions. Atmos. Chem. Phys. 16, 3665–3682. doi:10.5194/acp-16-3665-2016.
- Deng, Z. Z., Zhao, C. S., Ma, N., Ran, L., Zhou, G. Q. and co-authors. 2013. An examination of parameterizations for the CCN number concentration based on in situ measurements of aerosol activation properties in the North China Plain. Atmos. Chem. Phys. 13, 6227–6237. doi:10.5194/acp-13-6227-2013.
- Deshpande, C. G. and Kamra, A. K. 2014. Physical properties of the arctic summer aerosol particles in relation to sources at Ny-Alesund, Svalbard. J. Earth Syst. Sci. 123, 201–212. doi:10.1007/s12040-013-0373-0.
- Engvall, A.-C., Krejci, R., Ström, J., Treffeisen, R., Scheele, R. and co-authors. 2008. Changes in aerosol properties during spring-summer period in the Arctic troposphere. Atmos. Chem. Phys. 8, 445–462. doi:10.5194/acp-8-445-2008.
- Furutani, H., Dall'osto, M., Roberts, G. C., Prather, K. A. 2008. Assessment of the relative importance of atmospheric aging on CCN activity derived from field observations. Atmos. Environ. 42, 3130–3142. doi:10.1016/j.atmosenv.2007.09.024.
- Hatzianastassiou, N., Wobrock, W. and Flossmann, A. I. 1998. The effect of cloud processing of aerosol particles on clouds and radiation. Tellus. B 50, 478–490. doi:10.3402/tellusb.v50i5.16232.
- Hegg, D. A., Radke, L. F. and Hobbs, P. V. 1991. Measurements of Aitken nuclei and cloud condensation nuclei in the marine atmosphere and their relation to the DMS-Cloud-Climate Hypothesis. J. Geophys. Res. 96, 18727–18733. doi:10.1029/92jd00448.
- Hegg, D. A., Ferek, R. J. and Hobbs, P. V. 1995. Cloud condensation nuclei over the Arctic Ocean in Early Spring. J. Appl. Meteor. 34, 2076–2082. doi:10.1175/1520-0450(1995)034<2076:CCNOTA>2.0.CO;2.
- Hegg, D. A., Hobbs, P. V., Gassó, S., Nance, J. D. and Rangno, A. L. 1996. Aerosol measurements in the Arctic relevant to direct and indirect radiative forcing. J. Geophys. Res. 101, 23349–23363. doi:10.1029/96jd02246.
- Heintzenberg, J. and Leck, C. 2012. The summer aerosol in the central Arctic 1991–2008: did it change or not? Atmos. Chem. Phys. 12, 3969–3983. doi:10.5194/acp-12-3969-2012.
- Herenz, P., Wex, H., Henning, S., Kristensen, T. B., Rubach, F, Roth, A., Borrmann, S., Bozem, S., Schulz, H. and Stratmann, F. 2018. Measurements of aerosol and CCN properties in the Mackenzie River delta (Canadian Arctic) during Spring‐Summer transition in May 2014. Atmos. Chem. Phys. 18(7), 4477–4496. doi:10.5194/acp-2017-745.
- Hoppel, W. A., Dinger, J. E. and Ruskin, R. E. 1973. Vertical Profiles of CCN at various geographical locations. J. Atmos. Sci. 30, 1410–1420. doi:10.1175/1520-0469(1973)030<1410:VPOCAV>2.0.CO;2.
- Hämeri, K., Väkevä, M., Aalto, P. P., Kulmala, M., Swietlicki, E. and co-authors. 2001. Hygroscopic and CCN properties of aerosol particles in boreal forests. Tellus. B 53, 359–379. doi:10.3402/tellusb.v53i4.16609.
- IPCC 2013. Climate Change 2013: The Physical Science Basis. Contribution of Working Group I to the Fifth Assessment Report of the Intergovernmental Panel on Climate Change. Cambridge University Press, Cambridge, United Kingdom and New York, NY, USA.
- Kim, J., Yoon, Y. J., Gim, Y., Kang, H. J., Choi, J. H. and co-authors. 2017. Seasonal variations in physical characteristics of aerosol particles at the King Sejong Station, Antarctic Peninsula. Atmos. Chem. Phys. 17, 12985–12999. doi:10.5194/acp-17-12985-2017.
- Lance, S., Nenes, A., Medina, J. and Smith, J. N. 2006. Mapping the operation of the DMT continuous flow CCN counter. Aerosol Sci. Technol. 40, 242–254. doi:10.1080/02786820500543290.
- Lathem, T. L., Beyersdorf, A. J., Thornhill, K. L., Winstead, E. L., Cubison, M. J. and co-authors. 2013. Analysis of CCN activity of Arctic aerosol and Canadian biomass burning during summer 2008. Atmos. Chem. Phys. 13, 2735–2756. doi:10.5194/acp-13-2735-2013.
- Law, K. S. and Stohl, A. 2007. Arctic air pollution: Origins and impacts. Science 315, 1537–1540. doi:10.1126/science.1137695.
- Leaitch, W. R., Sharma, S., Huang, L., Toom-Sauntry, D., Chivulescu, A. and co-authors. 2013. Dimethyl sulfide control of the clean summertime Arctic aerosol and cloud. Elem. Sci. Anth. 1, 000017. doi:10.12952/journal.elementa.000017.
- Li, S.-M., Barrie, L. A. and Sirois, A. 1993. Biogenic sulfate aerosol in the Arctic troposphere: 2. Trends and seasonal variations. J. Geophys. Res. 98, 20623–20631. doi:10.1029/93jd02233.
- Matrai, P. A., Tranvik, L., Leck, C. and Knulst, J. C. 2008. Are high Arctic surface microlayers a potential source of aerosol organic precursors?. Mar. Chem. 108, 109–122. doi:10.1016/j.marchem.2007.11.001.
- Martin, M., Chang, R. Y.-W., Sierau, B., Sjogren, S., Swietlicki, E. and co-authors. 2011. Cloud condensation nuclei closure study on summer Arctic aerosol. Atmos. Chem. Phys. 11, 11335–11350. doi:10.5194/acp-11-11335-2011.
- Moore, R. H., Bahreini, R., Brock, C. A., Froyd, K. D., Cozic, J. and co-authors. 2011. Hygroscopicity and composition of Alaskan Arctic CCN during April 2008. Atmos. Chem. Phys. 11, 11807–11825. doi:10.5194/acp-11-11807-2011.
- Mitchell, J. M. 1957. Visual range in the polar regions with particular reference to the Alaskan Arctic. J. Atmos. Terr. Phys. 17, 195–211..
- O’Dowd, C. D., Lowe, J. A., Clegg, N., Smith, M. H. and Clegg, S. L. 2000. Modelling heterogeneous sulphate production in maritime stratiform clouds. J. Geophys. Res. 105, 7143–7160. doi:10.1029/1999jd900915.
- Park, K.-T., Jang, S., Lee, K., Yoon, Y. J., Kim, M.-S. and co-authors. 2017. Observational evidence for the formation of DMS-derived aerosols during Arctic phytoplankton blooms. Atmos. Chem. Phys. 17, 9665–9675. doi:10.5194/acp-17-9665-2017.
- Petters, M. D. and Kreidenweis, M. 2007. A single parameter representation of hygroscopic growth and cloud condensation nucleus activity. Atmos. Chem. Phys. 7, 1961–1971. doi:10.5194/acp-7-1961-2007.
- Quinn, P. K., Miller, T. L., Bates, T. S., Ogren, J. A., Andrews, E. and co-authors. 2002. A three-year record of simultaneously measured aerosol chemical and optical properties at Barrow, Alaska. J. Geophys. Res. 107, AAC 8-1–AAC 8-15. doi:10.1029/2001jd001248.
- Quinn, P. K., Shaw, G., Andrews, E., Dutton, E. G., Ruoho-Airola, T. and co-authors. 2007. Arctic Haze: Current trends and knowledge gaps. Tellus 59, 99–114. doi:10.1111/j.1600-0889.2006.00236.x.
- Ramanathan, V., Crutzen, P. J., Kiehl, J. T. and Rosenfeld, D. 2001. Aerosols, climate, and the hydrological cycle. Science 294, 2119–2124. doi:10.1126/science.1064034.
- Rogers, R. R., Yau, M. K. 1996. A Short Course in Cloud Physics. 3rd ed. Butterworth‐Heinemann Woburn, Mass.
- Screen, J. A., Deser, C. and Simmonds, I. 2012. Local and remote controls on observed Arctic warming. Geophys. Res. Lett. 39, n/a. doi:10.1029/2012GL051598.
- Shaw, G. E. 1986. Cloud condensation nuclei associated with Arctic haze. Atmos. Environ. 20, 1453–1456. doi:10.1016/0004-6981(86)90017-X.
- Shindell, D. T., Chin, M., Dentener, F., Doherty, R. M., Faluvegi, G. and co-authors. 2008. A multi-model assessment of pollution transport to the Arctic. Atmos. Chem. Phys. 8, 5353–5372. doi:10.5194/acp-8-5353-2008.
- Shindell, D. and Faluvegi, G. 2009. Climate response to regional radiative forcing during the twentieth century. Nat. Geosci. 2, 294–300. doi:10.1038/ngeo473.
- Sinha, P. R., Kondo, Y., Koike, M., Ogren, J. A., Jefferson, A. and co-authors. 2017. Evaluation of ground-based black carbon measurements by filter-based photometers at two Arctic sites. J. Geophys. Res. Atmos. 122, 3544–3572. doi:10.1002/2016JD025843.
- Stohl, A., Andrews, E., Burkhart, J. F., Forster, C., Herber, A. and co-authors. 2006. Pan-Arctic enhancements of light absorbing aerosol concentrations due to North American boreal forest fires during summer 2004. J. Geophys. Res. 111, 1–20. doi:10.1029/2006jd007216.
- Stone, R. S., Sharma, S., Herber, A., Eleftheriadis, K. and Nelson, D. W. 2014. A characterization of Arctic aerosols on the basis of aerosol optical depth and black carbon measurements. Elem. Sci. Anth. 2, 000027. doi:10.12952/journal.elementa.000027.
- Ström, J., Engvall, A. C., Delbart, F., Krejci, R. and Treffeisen, R. 2009. On small particles in the Arctic summer boundary layer: observations at two different heights near Ny-Alesund, Svalbard. Tellus Ser. B-Chem. Phys. Meteorol. 61, 473–482. doi:10.1111/j.1600-0889.2008.00412.x.
- Ström, J., Umegard, J., Torseth, K., Tunved, P., Hansson, H. C. and co-authors. 2003. One year of particle size distribution and aerosol chemical composition measurements at the Zeppelin Station, Svalbard, March 2000-March 2001. Phys. Chem. Earth 28, 1181–1190. doi:10.1016/j.pce.2003.08.058.
- Tunved, P., Ström, J. and Krejci, R. 2013. Arctic aerosol life cycle: linking aerosol size distributions observed between 2000 and 2010 with air mass transport and precipitation at Zeppelin station, Ny-Ålesund, Svalbard. Atmos. Chem. Phys. 13, 3643–3660. doi:10.5194/acp-13-3643-2013.
- Twomey, S. and Warner, J. 1967. Comparison of measurements of cloud droplets and cloud nuclei. J. Atmos. Sci. 24, 702–703. doi:10.1175/1520-0469(1967)024<0702:COMOCD>2.0.CO;2.
- Willis, M., Burkart, J., Thomas, J. L., Köllner, F., Schneider, J. and co-authors. 2016. Growth of nucleation mode particles in the summertime Arctic: a case study. Atmos. Chem. Phys. 16, 7663–7679. doi:10.5194/acp-16-7663-2016.
- Yum, S. S. and Hudson, J. G. 2001. Vertical distributions of cloud condensation nuclei spectra over the springtime Arctic Ocean. J. Geophys. Res. 106, 15045–15052. doi:10.1029/2000jd900357.
- Yoon, J.-E., Kim, K. T., Macdonald, A. M., Park, K. T., Kim, H. C. and co-authors. 2017. Spatial and temporal variabilities of spring Asian dust events and their impacts on chlorophyll-a concentrations in the western North Pacific Ocean. Geophys. Res. Lett. 44, 1474–1482. doi:10.1002/2016GL072124.
- Zábori, J., Rastak, N., Yoon, Y. J., Riipinen, I. and Ström, J. 2015. Size-resolved cloud condensation nuclei concentration measurements in the Arctic: two case studies from the summer of 2008. Atmos. Chem. Phys. Discuss. 15, 5079–5128. doi:10.5194/acpd-15-5079-2015.