
 ?Mathematical formulae have been encoded as MathML and are displayed in this HTML version using MathJax in order to improve their display. Uncheck the box to turn MathJax off. This feature requires Javascript. Click on a formula to zoom.
Abstract
The application of the Monte Carlo (MC) simulation technique for the modelling of nucleation processes with an existing background particle concentration is presented in this paper. Next to the nucleation of novel particles, the coagulation of an existing particle population as well as the condensational growth and evaporation of unstable particles (whose diameter is smaller than the critical Kelvin diameter) are included into the simulation. The usage of statistically weighted MC particles allows the description of particle size distribution (PSD), whose concentrations differ in several orders of magnitude. It is shown, that this approach allows to model the complex interplay between freshly nucleated particles and an existing background particle population. In this work, the nucleation of novel particles is modelled by three different nucleation theories discussed by [Girshick, S. L. and C.-P. Chiu (1990), The Journal of Chemical Physics 93], which comprise of (1) the classical nucleation theory, (2) a mathematical correction to (1) and (3) a self-consistency correction of (2). For the chosen simulation conditions, the resulting PSDs are independent of the used nucleation theory for longer simulation times, in which the simulations are described by the coagulation mechanism only. The time-frame is identified for which relevant discrepancies of the PSDs have to be taken into account.
1. Introduction
The description of particle formation processes plays an important role in the context of atmospheric sciences describing the planetary boundary layer (e.g. Svenningsson et al., Citation2008; Karl et al., Citation2012; Kulmala et al., Citation2013) and the free troposphere (Bianchi et al., Citation2016).
Atmospheric particulate matter is a product of a multicomponent mixture of vapours, such as sulphuric acid, volatile organic compounds, ammonia, amines, ozone, sulphur dioxide and nitrogen oxides, which undergoes a complex nucleation mechanism (Kulmala et al., Citation2013). CLOUD experiments investigate the role of single components and their interactions on the particle nucleation rates (Kirkby et al., Citation2011).
Traditional aerosol dynamic population balance methods recourse to sectional or moment models (Zhang et al., Citation1999) or do not describe the composition of the formed particles at all, resorting to a one component/quasi-unary system (Olenius and Riipinen, Citation2017). The internal composition is an important property of the particulate matter in the atmosphere and in the focus of interest of atmospheric air quality, as well for the description of climatological systems. Therefore, there is a need for the correct description of the composition of the particle population.
Multicomponent sectional models are theoretically known (Gelbard, Citation1990), but their practical application is limited to a relatively low number of components (i.e. 2–3). In order to avoid such a multidimensional discretisation (leading to huge numbers of necessary computational resources and times), the Monte Carlo (MC) method can be applied; hence, the increment of the necessary computational resources depends only linearly on the number of used components.
It has already been shown that MC methods are well suited to describe multicomponent coagulation of aerosols (Efendiev and Zachariah, Citation2003; Zhao and Kruis, Citation2014). The inclusion of the homogeneous nucleation into a MC simulation is much more challenging, due to the fact, that continuous nucleation leads to the increase of the number of MC simulation particles. It was already shown, that the application of weighted MC particles makes this problem accessible. The designation of different statistical weights to each simulation particle makes the development of the concept of ‘particle merging’ possible (Kotalczyk and Kruis, Citation2017). We have also already shown, that this method can be applied to nucleation and growth in aerosol reactors (Kotalczyk et al., Citation2016, Citation2017). In atmospheric systems, however, a population of earlier formed background particles has to be taken into account (e.g. Olenius and Riipinen, Citation2017). The simultaneous description of (1) the background particle population and (2) the freshly nucleating particles poses a numerical challenge; hence, the number-concentrations of those two populations can differ several orders of magnitude. If the number-concentration of the background particles is 1010 m−3 and the freshly nucleated particle are described by a large number-concentration, like 1014 m−3, the application of non-weighted MC particles becomes nearly impossible: a huge number of 1,000,000 simulation particles would be needed, if the background particle population is to be modelled by a modest number of 100 particles. We show in the following, that such systems can be simulated by means of weighted MC simulation particles, but we refrain the simulated system to one component, only.
The theoretical description of the nucleation poses a difficult task, as described by the reviews (Oxtoby, Citation1992; Ford, Citation2004; Bennett and Barrett, Citation2012; Zhang et al., Citation2012). The great difficulty in the investigation of the nucleation phenomena lies in the fact, that several reasonable theories can be formulated, leading to nucleation rates, which differ in several orders of magnitude. Most theories resort to cluster–cluster interactions of unstable molecules which grow to a critical size and become stable, assumptions about interaction potentials (in case of molecular dynamics simulations, e.g. Tanaka et al., Citation2014) or about the kinetic collision rates (in case of kinetic formulations, e.g. Oxtoby, Citation1992; Laaksonen et al., Citation1995) have to be made. These assumptions cannot be verified by experiments (yet), because an experimental technique, which measures the concentration of the smallest (unstable) clusters would be necessary for this purpose (Wyslouzil and Wölk, Citation2016).
In this work, we focus on one component nucleation as a result of rapidly changing atmospheric conditions, e.g. a rapid temperature drop leading to a strong increase of the supersaturation. This is numerically a more challenging system than the otherwise applied supersaturation profiles used in atmospheric modelling, which describe a slow increase of the supersaturation at lower supersaturation levels. This system is tested by comparing three well-known expressions for the nucleation rate with each other. The decrease of the supersaturation, the total number concentration and the particle size distributions (PSD) are compared for this purpose. We show, that early stages of the simulation lead to strongly different results, while for longer simulation times the results of different nucleation models become undistinguishable from each other.
2. Methods
In the first subsection, a general parallel simulation algorithm for the solution of the PBE by means of weighted simulation particles is sketched. In the following, second section, the simulated system, consisting of the initial conditions and the used nucleation theories, is discussed in detail.
2.1. MC simulation algorithm
The use of statistically weighted MC simulation particles (Zhao et al., Citation2009; Lee et al., Citation2015) allows new modelling approaches, hence no limitations have to be set on the statistical weight of the newly included simulation particles (Menz et al., Citation2012; Hao et al., Citation2013). We combine a stochastic coagulation process of weighted MC particles with a deterministically described growth and evaporation process, which can be combined with the nucleation of novel particles, too.
The discrete coagulation events are separated from the continuous growth processes in a simple operator splitting approach (also used to describe the chemical decomposition of a precursor concentration during particle synthesis) (Celnik et al., Citation2007), so that the simulation of a time step consists of two steps: the MC-driven coagulation step and a growth (resp. evaporation) step which is solved by the solution of the corresponding ODEs. During the nucleation time step many particles could be inserted into the simulation as described further below. Treating the condensation as a continuous process instead of formulating single events for events describing monomer attachments or detachments leads to remarkable speed-ups of the simulations (Patterson et al., Citation2006). These approximations are valid for the description of larger particle sizes (i.e. >1 nm), discretization errors might be found for lower particle sizes and a different approach might become necessary, if the here presented approach is coupled to a kinetic MC simulation describing the nucleation (like e.g. in Filipponi and Giammatteo, Citation2016 or Davari and Mukherjee, Citation2018).
2.1.1. MC coagulation step
First, the coagulation time step is estimated from the given PSD, which is defined by the reciprocal of the sum of all possible event rates:
, where
, is the coagulation rate within the concept of ‘stochastic resolution’, according to (Kotalczyk and Kruis, Citation2017), where
(resp.
) are the volumes and
(resp.
) the statistical weights of simulated MC particles with the indices i and j. The coagulation kernel
describes the rate of coagulation between two real particles.
The particles are selected for coagulation by selecting the particle indices and
by random and selecting this random pair for coagulation, if an additional random number
is smaller than
. The maximal coagulation rate
can thereby be quickly approximated by a fast parallel algorithm introduced by (Wei and Kruis, Citation2013). The parallel implementation of this algorithm can be found in (Wei and Kruis, Citation2013) or (Kotalczyk and Kruis, Citation2017). We point out, that the applied coagulation time step
is also dependent on the number of used simulation particles, and that higher numbers of simulation particles lead to lower values for the applied time step (the values of
decrease linearly with the increase of the simulation particles, while the number of summands increases quadratically). So that the tuning of shorter separation times of the coagulation and the other processes becomes possible.
2.1.2. Continuous growth step
Second, in order to describe the condensational growth (or evaporation) of the particles, the corresponding growth equation is solved for each particle:
(1)
(1)
The monomer concentration in the gaseous phase determines thereby the Kelvin diameter
. It is thus determined whether the particle grows
or evaporates
and the exact rate of this process. The depletion (resp. increase) of the monomers is taken into account by the following mass balance (i.e. the first term on the r.h.s. of EquationEquation (2)
(2)
(2) ):
(2)
(2)
The second term on the r.h.s. of EquationEquation (2)(2)
(2) describes the monomer depletion of the monomer concentration due to the nucleation of novel particles; each nucleated particle consists thereby of
monomers (where
).
The coupled set of ordinary differential equations, consisting of EquationEquation (2)(2)
(2) and as many equations of the form of EquationEquation (1)
(1)
(1) , as there are MC particles (in the here presented simulations, 10,000) is solved by the Runga-Kutta technique for the time step
, which is set by the coagulation process discussed above.
The total mass of the nucleated material is stored as a special buffer variable , so that the set above is extended by one simple equation:
(3)
(3)
If the value surpasses a pre-set limit
(in the simulated scenario presented in this paper:
), a novel MC particle with the statistical weight of
is inserted into the simulation by the procedure described in the following subsection. It should be noted, that many nucleation events are possible during one coagulation step, dependent on the set threshold
and on the number of performed Runge Kutta (RK) time steps. These steps are set by comparison of the RK result of the 4th order technique to the 5th order technique. The difference between both techniques is compared to a predefined acceptable error in order to adjust the next time step or repeat the actual RK step for a much smaller interval of time (like described in Press et al., Citation2007).
2.1.3. Inclusion of newly nucleated particles: Low weight merging
Hence, the continuous inclusion of novel particles would lead to large numbers of simulation particles and thus higher computational times, the ‘low weight merging’ of particles is applied. This technique selects two ‘nearly similar’ MC particles (,
) and it stores their properties as one particle in the memory space of the former particle
, so that the newly nucleated particle can be stored in the memory space of the former particle
. The statistical weight
of the novel particle and its new volume
are calculated by:
(4)
(4)
This applied scheme preserves the total mass of the involved particles exactly; hence, . As a measure for the magnitude of the introduced error, the value
is introduced:
(5)
(5)
An algorithm is applied, which merges particles with low statistical weights (in order to introduce the lowest alternations to the PSD). The particles with low statistical weights are compared to all other particles, and the pair with the lowest merging error, is merged. The exact computational procedure for the selection of two ‘nearly similar’ particles is presented in (Kotalczyk and Kruis, Citation2017) in more detail.
2.2. Simulated system
The system consists of a background particle population and a condensable monomer concentration (describing thus the supersaturation S of the system). It is assumed that the background particles and the gaseous monomers are one compound, with the properties summarized in . These values could designate a quasi-unary atmospheric aerosol consisting of sulphuric acid and organic compounds in a scenario describing sulphuric acid induced nucleation of the organic molecules (Olenius and Riipinen, Citation2017). The system is simulated for isothermal conditions (280 K) and 24 hr.
Table 1. Values used for the simulation describing typical aerosol properties of a quasi-unary model, described by (Olenius and Riipinen, Citation2017).
The background particle population is modelled as a lognormal distribution with a geometric mean of 50 nm and a geometric standard deviation of 1.46, which corresponds to the geometric standard deviation of the self-preserving PSD for the coagulation process (Vemury et al., Citation1994). These initial particles encompass a total number concentration of , this might describe a polluted environment.
The initial supersaturation is set to the value of at the beginning, which also corresponds to a polluted environment—but is also tested for lower values (
,
and
). This modelling does not take into account a slowly increase and decrease of the monomer concentration, which is sometimes modelled in a sinusoidal way reflecting the diurnal cycle (Olenius and Riipinen, Citation2017). It is assumed that these conditions are reached (due to drastic cooling or convection) at the beginning of the simulation and that the condensational growth or evaporation of the existing particles as well as the nucleation are the only reasons for changes of the supersaturation. This assumption is a rather artificial modelling of the complex interplay of an existing background particle population with condensable material in the form monomers in the gaseous phase, whose saturation is slowly increased by cooling or monomer convection. It poses, however, a much more challenging system for the here discussed MC methodology, hence a slow increase would lead to less nucleation and thus less new particles which have to be included into the simulation. The kernel for coagulation in the free molecule regime is used. It describes the rate of coagulation of two particles with the sizes v and v’ by:
(6)
(6)
The used symbols are summarized in and is the Boltzmann’s constant:
The condensational growth is described by the formula for the free-molecule regime as well and depends on the volume (resp. the diameter
, with
) of the particle and the monomer concentration
in the gaseous phase:
(7)
(7)
The used symbols and its values are described in . It is assumed, that the nucleated particles and the background particle population consist of the same material and that all simulated particles grow (resp. evaporate) like described by EquationEquation (7)(7)
(7) . The exponential term describes thereby the Kelvin correction, this leads to an evaporation of all particles whose diameter
is smaller than the Kelvin diameter
, with:
(8)
(8)
This diameter is also the diameter of the inserted particles due to nucleation.
Three different expressions are investigated for the nucleation rate . First the classic nucleation theory by (Becker and Döring, Citation1935) has been investigated, denoting it as ‘classic’ in this work, or as
in EquationEquation (10)
(10)
(10) . A correction to this expression in the framework of a kinetic formulation has been proposed by (Courtney, Citation1961) and its mathematical necessity is stressed by many works (e.g. Girshick and Chiu, Citation1990; Oxtoby, Citation1992), it will be marked as
in EquationEquation (9)
(9)
(9) . A self-consistent correction to this kinetic nucleation theory (called ‘Courtney’ in the following) has been proposed by (Girshick and Chiu, Citation1990) and is denoted as
in EquationEquation (10)
(10)
(10) .
(9)
(9)
(10)
(10)
3. Results
The compared nucleation theories influence directly the characteristics of the simulated particle population. Due to different nucleation rates, a different depletion of the monomer concentration takes place, as can be seen in . These variations of the saturation in time affect directly the nucleation rates, shown in . One can coarsely distinct the simulation time into three regions: (1) an initial time span (simulation times smaller than 1 min), for which nearly constant nucleation rates can be observed, which correspond to constant monomer concentration values—meaning that the depletion of the monomer concentration due to condensational growth and nucleation can be neglected during this time-span; (2) a transition time span (simulation times between 1 min and 1 hr), in which a depletion of the monomer concentration can be seen (caused by the condensational growth on the existing particle population and the nucleation of novel particles); (3) a steady state region (simulation times larger than 1 hr), which is described by the continuous growth/evaporation and coagulation and marked by a slow decrease of the surplus supersaturation. In the here presented simulation conditions, the contributions of the growth/evaporation term are nearly negligible for longer simulation times and the supersaturation seems to reach a steady state. Therefore, one can consider the coagulation to be the only one driving force for particulate growth—in contrast to the system describing industrial Fe production conditions (Kotalczyk et al., Citation2016), for which the complex interplay of coagulation and growth/evaporation has to be taken into account for the correct description of the PSD (Kotalczyk et al., Citation2017).
Fig. 1. The supersaturation surplus for an initial supersaturation of
and
. The vertical lines designate the simulation times of 1 min and 1 hr, a total simulation time of 24 hr is presented.
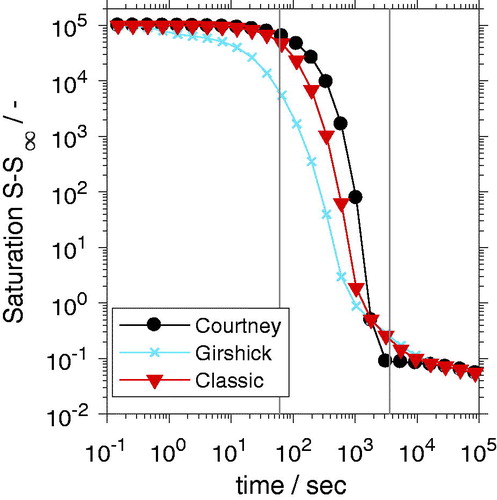
Fig. 2. The nucleation rates for the three discussed nucleation theories for an initial supersaturation of . The vertical lines represent the simulation times of 1 min and 1 hr, a total simulation time of 24 hr is presented.
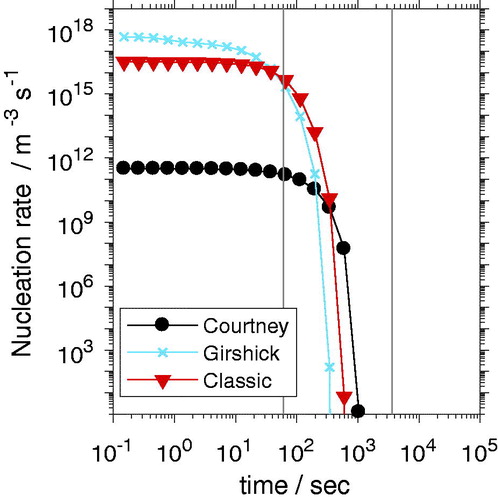
The different nucleation rates have, of course a direct impact on the overall number concentration of the particles, as can be seen in . A steep increase in the particle concentration is found in the initial stage of the simulation for the classic and Girshick nucleation theory. The Courtney theory is not describing such high nucleation rates as the other two theories (as can be seen in ), which leads to no drastic increase of the particle concentration. The transition time span is marked by a decline of the particle concentration, which can be explained by the onset of the coagulation of the particles.
Fig. 3. The number concentration in dependency of the used nucleation theories are shown. The vertical lines represent the simulation times of 1 min and 1 hr, a total simulation time of 24 hr is presented.
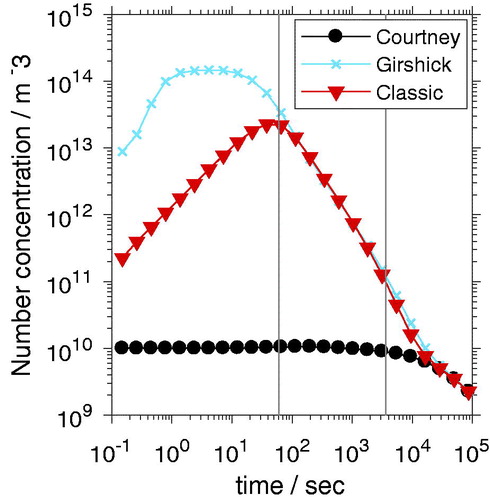
These findings can also be drawn from the PSDs shown in describing the particle populations after a total simulation time of 1 min, 1 hr and 24 hr. The 10,000 particles are sorted into 80 logarithmically spaced bins and mean values for 100 simulations are shown. shows that after 1 min the differences of the particle concentrations presented in can be attributed to the nucleated particles, which represent the smaller sizes of the particle size spectrum. The PSD based on the Girshick nucleation theory exhibits not only higher concentrations of the nucleated particles as the other nucleation theories, but the sizes of the particles are larger as well. This indicates that the newly nucleated particles have coagulated with each other. This explains the number concentration plateau for the initial stage of the simulation shown in for the Girshick nucleation theory: the increase of the particle number concentration is limited by the onset of the coagulation, which decreases the particle number concentration.
Fig. 4. The PSDs resulting from the three different nucleation theories after a simulation time of 1 min for .
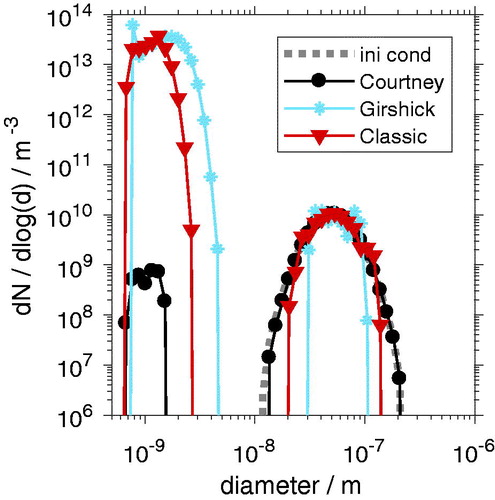
Fig. 5. The PSDs resulting from the three different nucleation theories after a simulation time of 1 hr for .
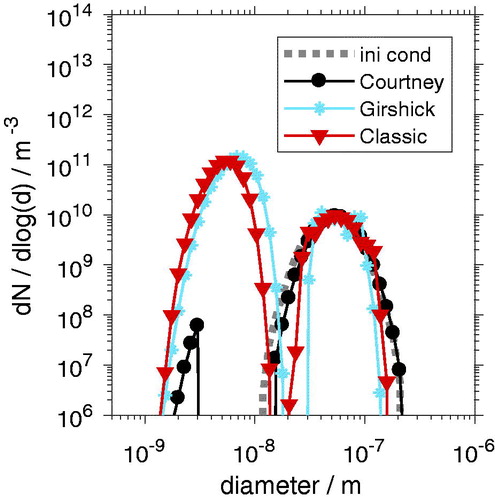
Fig. 6. The PSDs resulting from the three different nucleation theories after a simulation time of 24 hr for .
The part of the PSD representing mainly the background particle population changes its shape slightly. It can be seen that the parts representing smaller concentrations of the PSD are not rendered in the results based on the Girshick and the Classic theory. This can be attributed to the ‘low weight merging’, necessary for the novel inclusion of a nucleated particle. The higher the nucleation rate and the more new particles have to be included into the simulation, the less accurate becomes the rendering of the fringes of the background particle population. It should be noted, that the regions, in which these inaccuracies are observed constitute a small part of the PSD (note the logarithmic plot). This small part (especially the larger particles), could describe the part of the PSD, which is responsible for the light-scattering behaviour of the aerosol or act as cloud condensation nuclei (CCN). The ‘removal’ of these particles due to the merging technique might therefore introduce serious errors in the context of the simulation of an atmospheric system. These errors could be prevented by the following 2 approaches: (1) the particles which are large enough to act as CCNs could be locked against merging, simply by not comparing and merging them with other particles; (2) the light-scattering cross-section (resp. power) of each particle
could be considered for the calculation of the merging error, in this approach, the expression in EquationEquation (5)
(5)
(5) could be replaced by:
, where
is some pre-set light-scattering cross-section. This second approach would penalize the merging of particles with different light-scattering cross-sections, if one of them is higher than
.
Although the fringes of the PSDs change due to the here applied merging techniques, the total volume is conserved in the course of the simulation, where:
(11)
(11)
The mean value for (for all 100 simulations) is compared with the initial value
at the beginning of the simulation in . It can be seen that it changes only slightly. The relative deviation of
corresponds to the magnitude of the floating point precision applied for the calculations. This value accumulates to levels of
for simulations of high nucleation scenarios. These levels are still acceptable.
Fig. 7. The relative deviation of the total volume [defined in Equation (11)] from the initial total volume
.
![Fig. 7. The relative deviation of the total volume Vtot [defined in Equation (11)] from the initial total volume V0.](/cms/asset/798bd87f-881b-42bb-9e91-381b2eedc3e8/zelb_a_1554415_f0007_c.jpg)
We also observed, that the application of a higher number of simulation particles leads to less deviations within the background PSDs, so that the number of simulation particles can be applied as a control parameter for these deviations. The same values for the moments of the PSDs (such as mean geometric diameter or total number-concentration) could be reproduced, independent on the number of the applied simulation particles.
The PSD based on the Courtney theory expresses the background condition with the same accuracy as the initial condition, hence little to none particles have to be inserted into the simulation in this scenario. In turn, much higher differences between the concentrations of the nucleated particles and the concentrations of background particles are described by the PSD based on the Girshick theory as the one based on the Courtney theory.
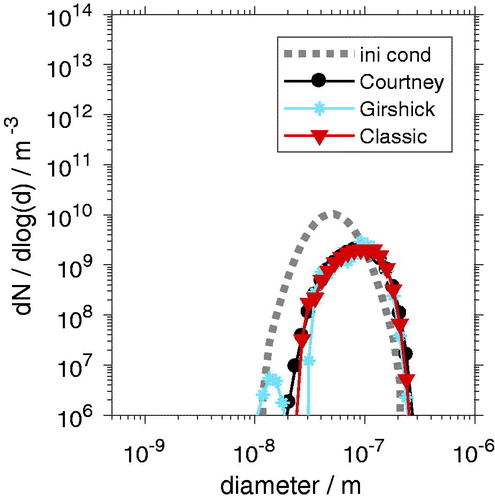
In the time span, between 1 min and 1 hr (the transition time span), the nucleation of novel particles ceases completely (see ). The evolution of the PSD in this time span is mainly described by the coagulation of the particles, the condensational growth of the particle population might be considered to be very small, hence the corresponding driving force decreases several orders of magnitude, as can be seen in . The result is a PSD, which consists of two peaks, which can be attributed to the nucleated population and the initial background particle population. shows that the growth of the background particle population due to condensation and due to coagulation with the nucleated particles is relatively small. The part of the PSD, which represents the background particles (around 50 nm), is nearly of the same shape as the initial condition (disregarding the shape changes due to the merging on the edges of this distribution).
The part of the PSD, which can be attributed to the nucleated particles (covering the whole range between 1 and 20 nm) exhibits the form of the self-preserving form for coagulation. The differences between the PSDs are clearly visible, making a distinction between each other possible. The attribution of the corresponding nucleation theory based on the size of the PSD in this size spectrum would be therefore possible, while the form of the background particles (all particles with the size 20 nm or higher) would not allow to draw conclusions on the nucleation mechanisms
These distinctions vanish, however in the further course of the simulation and the resulting PSDs attain a self-preserving form for the coagulation, making no more distinctions between each other possible, as can be seen in . The depicted results describe the PSDs after 24 hr. A clear difference between the PSDs for 24 hr and the initial PSD can be seen, which can be attributed to the coagulation within this long ‘steady state time span’. Each PSD is rendered with the same accuracy. This indicates that the differences of the rendering of the background particle population in , which originate from the ‘low weight merging’ technique did not propagate into the simulation and were in fact not critical for the correct description of the general behaviour of the PSD. However, the negligence of the larger particles might lead to a wrong description of the light scattering behaviour of the aerosol—or its ability to act as CCNs—both points could be addressed by modifying the merging technique as discussed above.
Similar findings can be made for different values for the initial concentration , exemplary plots of the supersaturation in and the number concentration in show, that the nucleation takes place mostly during the first minute of the simulation and that the depletion of the supersaturation takes place between the first minute and hour of the simulation. This time frame may also be identified as the one, which allows to pose assumptions on the nucleation mechanisms from the shapes of the PSDs.
Fig. 8. The supersaturation in dependency of its initial value for the Girshick nucleation theory. The vertical lines represent the simulation times of 1 min and 1 hr, a total simulation time of 24 hr is presented.
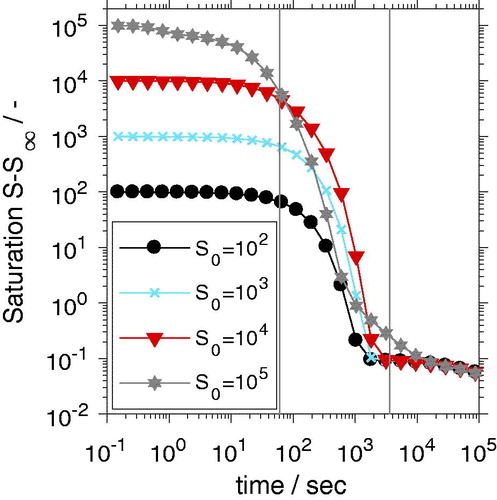
Fig. 9. The number concentration in dependency of the initial supersaturation value for the Girshick nucleation theory. The vertical lines represent the simulation times of 1 min and 1 hr, a total simulation time of 24 hr is presented.

Higher nucleation rates can be—obviously—observed for higher initial supersaturations as can be seen in , for the lowest supersaturation,
, no nucleation can be observed at all and the total monomer concentration is depleted due to condensational growth of the background particles. This means, that high supersaturations are necessary for the nucleation of novel particles in the presence of a background particle population.
The decrease of the supersaturation is much faster for than for
or
. This can be attributed to the much higher concentration of nucleated particles of this system, which in turn act as a source for monomer depletion through condensational growth—an effect, which would not become apparent, if the growth (resp. evaporation) of the particle population would not be included into the simulation.
4. Conclusions
We investigate the homogeneous nucleation of an aerosol under isothermal conditions and in the presence of a background particle population. Three different nucleation theories are simulated. We show that each of these theories results in different rates of nucleation and thus different particle concentrations at the beginning of the simulation. For longer simulation times (>1 hr), the resulting PSD become undistinguishable from each other, as can be expected from different systems with the same total particulate mass, which are driven by the coagulation only. In this way, the identification of a time frame relevant for measurements can be established.
The applied MC simulation algorithm makes use of weighted simulation particles. It is shown, that this simulation technique is able to describe PSDs, which are characterized by huge differences in the number-concentrations of the freshly nucleated particles and the already existing background particles. This shows that the presented MC technique could also be used for the description of a multicomponent atmospheric aerosol system. An investigation of the influence of more complex, kinetic MC simulation based nucleation theories (like Davari and Mukherjee, Citation2018) could also be simulated in a future work.
Disclosure Statement
No potential conflict of interest was reported by the authors.
Additional information
Funding
References
- Becker, R. and Döring, W. 1935. Kinetische Behandlung der Keimbildung in Übersättigten Dämpfen. Ann. Phys. 416, 719–752. doi:10.1002/andp.19354160806.
- Bennett, T. P. and Barrett, J. C. 2012. Water nucleation. A comparison between some phenomenological theories and experiment. J. Chem. Phys. 137(12), 124702. doi:10.1063/1.4754662.
- Bianchi, F., Tröstl, J., Junninen, H., Frege, C., Henne, S. and co-authors. 2016. New particle formation in the free troposphere. A question of chemistry and timing. Science 352, 1109–1112. doi:10.1126/science.aad5456.
- Celnik, M., Patterson, R. I. A., Kraft, M. and Wagner, W. 2007. Coupling a stochastic soot population balance to gas-phase chemistry using operator splitting. Combust. Flame 148, 158–176. Online at: http://www.scopus.com/inward/record.url?eid=2-s2.0-33846040006&partnerID=40&md5=fcab22044588d3b277a83007d4085ea1
- Courtney, W. G. 1961. Remarks on homogeneous nucleation. J. Chem. Phys. 35, 2249–2250. doi:10.1063/1.1732252.
- Davari, S. A. and Mukherjee, D. 2018. Kinetic Monte Carlo simulation for homogeneous nucleation of metal nanoparticles during vapor phase synthesis. AIChE J. 64, 18–28. doi:10.1002/aic.15887.
- Efendiev, Y. and Zachariah, M. R. 2003. Hierarchical hybrid Monte-Carlo method for simulation of two-component aerosol nucleation, coagulation and phase segregation. J. Aerosol Sci. 34, 169–188. doi:10.1016/S0021-8502(02)00156-8.
- Filipponi, A. and Giammatteo, P. 2016. Kinetic Monte Carlo simulation of the classical nucleation process. J. Chem. Phys. 145(21), 211913. doi:10.1063/1.4962757.
- Ford, I. J. 2004. Statistical mechanics of nucleation. A review. Proc. Inst. Mech. Eng. C J. Mech. Eng. Sci. 218, 883–899. doi:10.1243/0954406041474183.
- Gelbard, F. 1990. Modeling multicomponent aerosol particle growth by vapor condensation. Aerosol Sci. Technol. 12, 399–412. doi:10.1080/02786829008959355.
- Girshick, S. L. and Chiu, C.-P. 1990. Kinetic nucleation theory. A new expression for the rate of homogeneous nucleation from an ideal supersaturated vapor. J. Chem. Phys. 93, 1273–1277. doi:10.1063/1.459191.
- Hao, X., Zhao, H., Xu, Z. and Zheng, C. 2013. Population balance-Monte Carlo simulation for gas-to-particle synthesis of nanoparticles. Aerosol Sci. Technol. 47, 1125–1133. doi:10.1080/02786826.2013.823642.
- Karl, M., Leck, C., Gross, A. and Pirjola, L. 2012. A study of new particle formation in the marine boundary layer over the central Arctic Ocean using a flexible multicomponent aerosol dynamic model. Tellus B Chem. Phys. Meteorol. 64. Online at: https://www.tandfonline.com/doi/full/10.3402/tellusb.v64i0.17158
- Kirkby, J., Curtius, J., Almeida, J., Dunne, E., Duplissy, J. and co-authors. 2011. Role of sulphuric acid, ammonia and galactic cosmic rays in atmospheric aerosol nucleation. Nature 476, 429–433. doi:10.1038/nature10343.
- Kotalczyk, G. and Kruis, F. E. 2017. A Monte Carlo method for the simulation of coagulation and nucleation based on weighted particles and the concepts of stochastic resolution and merging. J. Comput. Phys. 340, 276–296. doi:10.1016/j.jcp.2017.03.041.
- Kotalczyk, G., Skenderovic, I. and Kruis, F. E. 2016. A GPU-based Monte Carlo technique for the simulation of simultaneous nucleation, coagulation and growth based on weighted simulation particles. In: 2016 AIChE Annual Meeting, San Francisco, AIChE, 490–497.
- Kotalczyk, G., Skenderovic, I. and Kruis, F. E. 2017. Modeling of particle formation in arc discharges by Monte-Carlo based population balance modeling. MRS Adv. 148, 1–8. doi:10.1557/adv.2017.155.
- Kulmala, M., Kontkanen, J., Junninen, H., Lehtipalo, K., Manninen, H. E. and co-authors. 2013. Direct observations of atmospheric aerosol nucleation. Science 339, 943–946. doi:10.1126/science.1227385.
- Laaksonen, A., Talanquer, V. and Oxtoby, D. W. 1995. Nucleation: Measurements, theory, and atmospheric applications. Annu. Rev. Phys. Chem. 46, 489–524. Online at: http://www.scopus.com/inward/record.url?eid=2-s2.0-0000848866&partnerID=40&md5=ed1189d650578ad48509e6760b0e7986 doi:10.1146/annurev.pc.46.100195.002421
- Lee, K. F., Patterson, R. I. A., Wagner, W. and Kraft, M. 2015. Stochastic weighted particle methods for population balance equations with coagulation, fragmentation and spatial inhomogeneity. J. Comput. Phys. 303, 1–18. doi:10.1016/j.jcp.2015.09.031.
- Menz, W. J., Shekar, S., Brownbridge, G. P. E., Mosbach, S., Körmer, R. and co-authors. 2012. Synthesis of silicon nanoparticles with a narrow size distribution: A theoretical study. J. Aerosol Sci. 44, 46–61. doi:10.1016/j.jaerosci.2011.10.005.
- Olenius, T. and Riipinen, I. 2017. Molecular-resolution simulations of new particle formation. Evaluation of common assumptions made in describing nucleation in aerosol dynamics models. Aerosol Sci. Technol. 51, 397–408. doi:10.1080/02786826.2016.1262530.
- Oxtoby, D. W. 1992. Homogeneous nucleation: Theory and experiment. J. Phys. Condens. Matter 4, 7627–7650. Online at: http://www.scopus.com/inward/record.url?eid=2-s2.0-0013306867 &partnerID=40&md5=09ca343f82ab68294d285a20e33e88b5
- Patterson, R. I. A., Singh, J., Balthasar, M., Kraft, M. and Norris, J. R. 2006. The linear process deferment algorithm: A new technique for solving population balance equations. SIAM J. Sci. Comput. 28, 303–320. Online at: http://www.scopus.com/inward/record.url?eid=2-s2.0-33846113883&partnerID=40&md5=7bdc70864d1e911f579ca0e81cfe24f0
- Press, W. H., Teukolsky, S. A., Vetterling, W. T. and Flannery, B. P. 2007. Numerical Recipes. The Art of Scientific Computing. 3rd ed. Cambridge University Press, Cambridge.
- Svenningsson, B., Arneth, A., Hayward, S., Holst, T., Massling, A. and co-authors. 2008. Aerosol particle formation events and analysis of high growth rates observed above a subarctic wetland-forest mosaic. Tellus B Chem. Phys. Meteorol. 60, 353–364. doi:10.1111/j.1600-0889.2008.00351.x.
- Tanaka, K. K., Kawano, A. and Tanaka, H. 2014. Molecular dynamics simulations of the nucleation of water: Determining the sticking probability and formation energy of a cluster. J. Chem. Phys. 140, 114302. doi:10.1063/1.4867909.
- Vemury, S., Kusters, K. A. and Pratsinis, S. E. 1994. Time-lag for attainment of the self-preserving particle size distribution by coagulation. J. Colloid Interface Sci. 165, 53–59. doi:10.1006/jcis.1994.1204.
- Wei, J. and Kruis, F. E. 2013. A GPU-based parallelized Monte-Carlo method for particle coagulation using an acceptance–rejection strategy. Chem. Eng. Sci. 104, 451–459. doi:10.1016/j.ces.2013.08.008.
- Wyslouzil, B. E. and Wölk, J. 2016. Overview. Homogeneous nucleation from the vapor phase – The experimental science. J. Chem. Phys. 145(21), 211702. doi:10.1063/1.4962283.
- Zhang, R., Khalizov, A., Wang, L., Hu, M. and Xu, W. 2012. Nucleation and growth of nanoparticles in the atmosphere. Chem. Rev. 112, 1957–2011. Online at: http://www.scopus.com/inward/record.url?eid=2-s2.0-84863338057&partnerID=40&md5= a4a3f5128beb39fd0902abd134fba850
- Zhang, Y., Seigneur, C., Seinfeld, J. H., Jacobson, M. Z. and Binkowski, F. S. 1999. Simulation of aerosol dynamics. A comparative review of algorithms used in air quality models. Aerosol Sci. Technol. 31, 487–514. doi:10.1080/027868299304039.
- Zhao, H. and Kruis, F. E. 2014. Dependence of steady-state compositional mixing degree on feeding conditions in two-component aggregation. Ind. Eng. Chem. Res. 53, 6047–6055. doi:10.1021/ie500316g.
- Zhao, H., Kruis, F. E. and Zheng, C. 2009. Reducing statistical noise and extending the size spectrum by applying weighted simulation particles in Monte Carlo simulation of coagulation. Aerosol Sci. Technol. 43, 781–793. doi:10.1080/02786820902939708.