
 ?Mathematical formulae have been encoded as MathML and are displayed in this HTML version using MathJax in order to improve their display. Uncheck the box to turn MathJax off. This feature requires Javascript. Click on a formula to zoom.
Abstract
Air moisture of oceanic origin can be subject to long-range transport and could contribute to precipitation at distant places. With ongoing climate change the relationship between water vapour sources and sinks is under constant evolution and plays an important role for water budget assessments. This study analysed monthly integrated and event-based precipitation samples from two field sites in the Western Pamir Mountains (Tajikistan) for stable isotope compositions of oxygen (δ18O) and hydrogen (δ2H) of water. The aim was to investigate water vapour sources and, in particular, to evaluate contributions of water vapour from the Mediterranean region. The latter has been often postulated as a potential moisture source region for Central Asia. Deuterium excess values (d), that serve as a fingerprint of moisture origin, were below 13‰ in monthly integrated samples, for most of the year. This indicates a smaller contribution of high Mediterranean moisture (∼20‰) to the Western Pamir Mountains than originally expected. A maximum d value of 19‰ was observed in March, which is not in agreement with the common observation of increased Mediterranean contribution during winter (DJF). A Lagrangian backward trajectory model (HYSPLIT) was applied to infer the general air mass origin for sampled precipitation events. A maximum contribution of ‘western’ moisture of 40% was also detected in March, while 40%–60% of moisture that contributed to precipitation events in winter was transported by trajectories that originated from the Northern Indian Ocean.
1. Introduction
Stable isotopes of oxygen and hydrogen in water have become state of the art parameters in hydrological studies to delineate water sources (Yurtsever and Gat, Citation1981; Joussaume et al., Citation1984; Rozanski et al., Citation1993; Bowen and Revenaugh, Citation2003; Terzer et al., Citation2013; Stumpp et al., Citation2014; Galewsky et al., Citation2016) and investigate processes, such as evaporation (Craig and Gordon, Citation1965; Gibson et al., Citation2016) and transpiration (Dongmann et al., Citation1974; Helliker and Ehleringer, Citation2000). Choosing the oceanic reservoir as a starting point of the hydrologic cycle, evaporation of isotopically relatively uniform ocean water enriches the resulting water vapour in light isotopes. Condensation of this water vapour in clouds during formation of rain is assumed to be an isotopic equilibrium process, which only depends on temperature. Consequently, the isotopic composition of precipitation is subject to several effects that mostly depend on the temperature during condensation. They include the altitude effect, the latitude effect, and seasonality. It also correlates with travel distance, and thus continentality because of Rayleigh fractionation during subsequent rainout events (Clark and Fritz, Citation1997; Gat et al., Citation2000).
On a global scale, these effects average the isotope abundance of oxygen and hydrogen in precipitation to a linear relationship, which has been termed the global meteoric water line (GMWL) and defined by Craig (Citation1961) as:
(1)
(1)
To reduce the number of effects that have to be taken into account during the evolution from ocean water to precipitation, Dansgaard (Citation1964) introduced the concept of a deuterium excess value (d), which ideally should not be altered by isotope equilibrium effects. It is defined as
(2)
(2)
and can be visualised as the intercept of a line with slope 8 which crosses the given isotope pair in a dual isotope plot of δ18O versus δ2H. Thus, the GMWL connects points of d = 10‰.
Evaporation as a non-equilibrium process is generally assumed to be the major modifier of d-values, allowing direct comparison of oceanic water vapour and moisture precipitating from clouds (Merlivat and Jouzel, Citation1979). On large scales and assuming a closed water cycle, d-values of average oceanic water vapour are mainly controlled by relative humidity (RH) and sea surface temperature (SST). Precipitation along the GMWL is generated for RH and SST values of 85% and 25 °C, respectively (Clark and Fritz, Citation1997). Based on the closure assumption of the water cycle, simple linear relationships between d and RH, and d and SST were introduced to use source values of d as a ‘fingerprint’ to trace water in the atmosphere up to its point of rainout (Rindsberger et al., Citation1983; Johnsen et al., Citation1989; Pfahl and Sodemann, Citation2014). An example for one of these linear relationships at the location of evaporation is expressed as
(3)
(3)
with d in ‰, SST in °C, and RH in % (Aemisegger et al., Citation2014).
Note that after the condensation of water vapour in clouds, rain droplets can be subject to additional evaporation during their fall through a warm and dry air column which shifts their d-value from its original vapour composition (Friedman et al., Citation1962; Stewart, Citation1975). This effect is more pronounced for small rain amounts and can be accounted for if precipitation amount weighted d-values are considered (Lee and Fung, Citation2008).
These theoretical basics enable applications to estimate contributions of recycled inland water to precipitation (Froehlich et al., Citation2008; Aemisegger et al., Citation2014; Parkes et al., 2017). They may also discern and compare meteorological patterns (Liotta et al., Citation2006; Guan et al., Citation2013), and enable the paleoclimate interpretation of ice cores (Jouzel et al., Citation1982; Steffensen et al., Citation2008).
Some of the highest natural deuterium excess values in precipitation have been recorded in the Mediterranean, with maximum long-term mean values of 22‰ (Gat and Carmi, Citation1970). High d water vapour is produced when cold dry air from the surrounding continents interacts with the warm Mediterranean seawater and enhances isotope fractionation during evaporation (Gat and Carmi, Citation1970; Gat et al., Citation1996). This high d signal is transported eastward, mainly by prevailing Westerlies. Extending from countries with direct contact to the Mediterranean, several studies from countries further away refer to Mediterranean moisture as an explanation of unusually high d-values in precipitation and surface waters. These include studies from Syria (Kattan, Citation1997; Al Charideh and Zakhem, Citation2010), Jordan (Bajjali, Citation1990), Saudi-Arabia (Alyamani, Citation2001; Michelsen et al., Citation2015), Iraq (Hamamin and Ali, Citation2013; Ali et al., Citation2015), Iran (Osati et al., Citation2014; Parizi and Samani, Citation2014), Pakistan (Hussain et al., Citation2015), Tajikistan (Liu et al., Citation2015), northern India (Jeelani et al., Citation2013, Citation2017), and western China (Yao et al., Citation2013; Wang et al., Citation2015). Moreover, the moisture source of precipitation in Central Asia was discussed by several studies, which identified several air travel pathways and identified Mediterranean moisture as one of the potential main sources for precipitation in Central Asia (Aizen et al., Citation1995; Kreutz et al., Citation2003; Tian et al., Citation2007) while other studies identified the Indian Ocean as another major moisture source (Aizen et al., Citation1996; Karim and Veizer, Citation2002; Jeelani et al., Citation2017). Additional proposed pathways include polar air masses (Tian et al., Citation2007) and more continental Westerlies (Aizen et al., Citation1996; Meier et al., Citation2013; Pang et al., Citation2014).
In several of these studies, the notion of Mediterranean moisture as the only explanation for high d-values appears quite speculative and is often not discussed in detail. Our study challenges this rather simple notion and aims for a detailed investigation of air and moisture pathways to the Western Pamir Mountains in Tajikistan. The central objective of this work is to identify and attempt to quantify the influence of Mediterranean moisture and its isotope composition on precipitation at our study region, to test the hypothesis that the Mediterranean is a major moisture source to this area. The Pamir Mountains (or the Pamirs) are an excellent choice for this task because they lie directly in the proposed pathway of Mediterranean moisture and occupy a central geographic position in the Asian continent.
2. Methods
2.1. Study region and concept
The Pamir Mountains are a high mountain region in Central Asia, mainly within Tajikistan. They are bordered by high mountain regions, such as the Kunlun Mountains, the Hindu Kush, the Karakoram Range, and the Tien Shan. Regarding morphology, the Pamir Mountains can be subdivided into the Western and Eastern Pamir Mountains. The Western Pamir Mountains exhibit a rugged alpine environment with deeply incised valleys while the Eastern Pamir Mountains show smaller flat-bottomed valleys based on a high plateau and a lower morphological gradient between peaks and the valley floor.
The selected study region to examine the fate of Mediterranean moisture lies in the Western Pamir Mountains. In order to study this region, water samples for stable isotope analyses were collected at two study sites, Khorugh and Navabad, which are 34 km apart, in Tajikistan (). Over the course of 15 months 19 monthly-integrated samples were collected in 2012 and 2013. Subsequently, sampling of single rain events took place in 2013 and 2014, resulting in further 89 event samples collected over a period of 13 months (Meier et al., Citation2015a, Citation2015b). Both sample types are examined separately to test our hypothesis of Mediterranean moisture influence in the Western Pamir Mountains.
Table 1. List of monthly integrated and event based precipitation samples and their isotope values from two stations in the Western Pamir Mountains.
In order to cope with the coarser temporal resolution of integrated samples, their d-values are compared to monthly d averages of isotope precipitation monitoring stations along the route of commonly assumed air travel pathways. As mentioned in the introduction, one of these pathways connects the Mediterranean to the Pamir Mountains. To access isotope data, the Global Network of Isotopes in Precipitation (GNIP) was used in a first step (GNIP, IAEA/WMO, Citation2018). Additional isotope data were collected and evaluated from numerous publications for areas with sparse spatial coverage by GNIP stations. A full list of GNIP stations and additional data from publications used in this study can be found in .
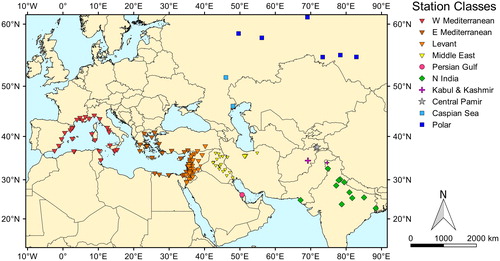
These stations and further isotope data were clustered and subdivided into ten regional classes based on their geographical position: W Mediterranean, E Mediterranean, Levant, Middle East, Caspian Sea, Polar, Persian Gulf, N India, Kabul & Kashmir, and Western Pamir ( and ). From monthly d-values for all stations in one class, two types of averages were calculated for each month: the arithmetic mean
(4)
(4)
and the precipitation amount-weighted arithmetic mean
(5)
(5)
where
is the d value of month m for one regional class,
is the precipitation amount, and n is the number of monthly values. This approach will unveil similarities and differences concerning extreme values of d and their seasonal distributions.
Fig. 1. Map of Global Network of Isotopes in Precipitation (GNIP) stations (larger symbols) and additional data (smaller symbols) used for calculation of regional deuterium excess averages. Grey stars show sampling sites of this study in the Western Pamir Mountains.
2.2. Trajectory calculation and classification
The d-values of event samples are more easily allocated to specific air travel pathways via computed backward air mass trajectory models, such as HYSPLIT (Stein et al., Citation2015). The necessary user input for these trajectory models consists of a location and a date of the associated precipitation event. From gridded meteorological data, such as the Global Data Assimilation System (GDAS; NOAA, Citation2018), HYSPLIT computes regularly spaced data points along trajectories which include additional parameters such as elevation of the air parcel, specific humidity of the air parcel and elevation of the planetary boundary layer (PBL). These parameters can be used to categorise the resulting trajectories into the wedge-shaped or radial regional classes that were pre-defined to represent areas of possible moisture origin. Note that classes for integrated and event samples are not necessarily identical. The classes of integrated monthly samples aggregate multiple, spatially close station and represent the regions where precipitation collection took place. Event samples were divided into classes that correspond to possible main moisture sources. They are wedge shaped due to the central starting point of the calculated trajectories. A detailed summary of data processing for event trajectories is given in the following paragraph.
Four of the 89 events that were sampled at Khorugh and Navabad in the Western Pamir Mountains showed d-values below –10‰, which hints at sample alteration (Michelsen et al., Citation2018). These events were excluded from further calculations. For the remaining 85 single precipitation events, backward air mass trajectories were calculated for each location with the Hybrid Single-Particle Lagrangian Integrated Trajectory model (HYSPLIT) of the National Oceanic and Atmospheric Administration (NOAA) Air Resources Laboratory (Stein et al., Citation2015; Rolph et al., Citation2017). GDAS1 grids with 1°×1° resolution from the National Oceanic and Atmospheric Administration and National Centers for Environmental Prediction (NOAA/NCEP) were used as meteorological input data. Starting times for the trajectories were chosen in accordance with precipitation records of the United States Air Force (USAF) station in Khorugh (Tajikistan; station ID 389540). The time period for all trajectories covered by this model was set to 7 days, and hourly data points along the backward trajectories were produced. In order to follow the specific air mass that produced precipitation at the sampling site, the trajectory starting altitude should correspond to the altitude of the rain clouds during sampled events. Since this cloud altitude was not measured, eight different trajectory starting altitudes were used as inputs with 150, 300, 500, 1000, 1500, 2000, 2500, and 3000 meters above ground level, thus generating eight trajectories per event. In order to select one of the eight starting altitudes for further evaluation, the evolution of specific humidity along each trajectory was assessed. For air mass altitudes below the height of the PBL derived from the HYSPLIT model, an increase in specific humidity was assumed to correspond to evaporation from the underlying ground area, and a decrease in specific humidity was assumed to correspond to precipitation (Bottyán et al., Citation2017). For air mass altitudes above the height of the PBL, humidity changes were assumed to be not due to ground surface interaction and consequently ignored. From the eight trajectories per event, the one with the largest sum of specific humidity increase below the PBL height along a trajectory was selected. This selection ensured that the trajectory that represents one precipitation event has a history of maximum moisture uptake and thus is regarded as the most representative for the sampled precipitation (Bottyán et al., Citation2017).
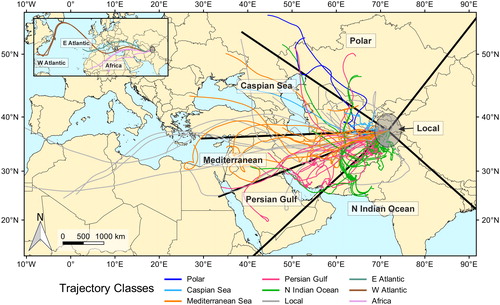
To evaluate the origin of moisture in these 85 selected trajectories, radial regional classes around the precipitation collection site were constructed (). Each trajectory was allocated to one of these radial classes. The class boundaries were chosen to include larger bodies of surface water that may act as moisture sources (Mediterranean Sea, Caspian Sea, northern Indian Ocean). If a trajectory crossed areas of several classes, it was associated with the class where most of the moisture entered the air parcel according to the model. Since the boundaries of the constructed wedge-shaped classes all converge to the sampling locations in the Pamir Mountains, a correct classification of air parcels that receive their moisture close to the sampling site is difficult. For this reason, an additional ‘local’ class was defined for air parcels that received most of their moisture in close proximity (<3° distance, ≈300 km) to the sampling sites. Further classes were introduced, because some trajectories originated, and had their moisture uptake, outside the reasonable boundaries of the area of the radial classes. This eventually resulted in nine classes: Polar, Caspian Sea, Mediterranean, Persian Gulf, N Indian Ocean, Local, Africa, W Atlantic, and E Atlantic ().
Fig. 2. Map of air mass trajectories leading up to rain events in the Western Pamir Mountains. Different classes of moisture origin are color-coded. Small insert displays long distance trajectories. For a detailed description of trajectory classification see text.
2.3. Field sampling and laboratory analyses
Monthly-integrated precipitation samples were collected from Hellmann-type rain gauges. To avoid evaporation effects, samples were collected at least twice per day, stored in high-density polyethylene (HDPE) bottles, and conflated to monthly samples. Event samples were transferred from the Hellman rain gauges into durable PE bags (Whirl-Pak, Nasco, Fort Atkinson, WI, USA). These water-filled bags were put into HDPE bottles for shipping. Precipitation samples were analysed in the laboratory for stable isotopes of the Department of Catchment Hydrology in the Helmholtz Centre for Environmental Research – UFZ in Halle/Saale (Germany). Water samples were analysed for δ18O and δ2H by an isotope ratio infrared spectroscopy (IRIS) analyser, based on wavelength-scanned cavity ring-down spectroscopy (L2120-i, Picarro Inc., Santa Clara, CA, USA). Each sample was measured by nine injections while the first three injections were rejected to exclude memory effects. All isotope measurements were scale normalised against the high and low international reference materials Vienna Standard Mean Ocean Water (VSMOW) and Standard Light Antarctic Precipitation (SLAP). The two-point calibration was controlled by a third laboratory reference water that was calibrated directly against VSMOW and SLAP. All values are reported in the standard δ-notation in per mil (‰) versus VSMOW according to
(6)
(6)
where R represents the ratio of heavy isotopes (mass i) to light isotopes (mass j) of an element E for a sample or a reference substance (Coplen, Citation2011). Values had an overall measurement precision of ±0.2‰ and ±0.8‰ (±1σ) for δ18O and δ2H, respectively.
3. Results
3.1. Oxygen and hydrogen stable isotopes
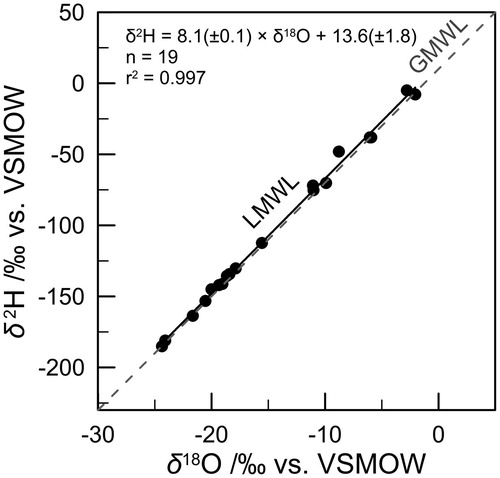
The results of monthly integrated samples for oxygen and hydrogen stable isotopes are shown in a dual isotope plot of δ2H against δ18O (). Values for δ18O range between –24.4‰ and –2.0‰, whereby minimum values are reached in the cold season (boreal winter), while maximum values were observed during warm season (boreal summer). The Local Meteoric Water Line (LMWL) calculated from the samples () has the equation
(7)
(7)
which is quite similar to the GMWL (EquationEq. 1
(1)
(1) ). As outlined in the introduction, several effects occurring during transport of atmospheric moisture and rainout have an impact on the isotopic composition of any precipitation sample. Therefore, we limit the subsequent detailed discussion to the deuterium excess parameter, which should be less affected by these processes and thus a better indicator for moisture transport.
Fig. 3. Dual isotope plot of δ2H against δ18O (VSMOW) for monthly integrated isotope samples of the Western Pamir Mountains. Grey dotted line is the Global Meteoric Water Line (GMWL, see EquationEq. 1(1)
(1) ). Black solid line is the Local Meteoric Water Line (LMWL) as calculated from the samples.
3.2. Monthly integrated samples
The monthly d-values associated with each of the ten regional classes (see Section 2.1) are summarised in .
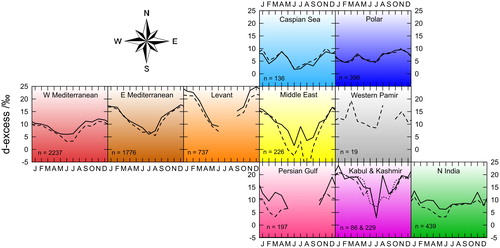
Fig. 4. Monthly deuterium excess (d) values for regional classes, corresponding to stations in . Plots are arranged in their respective geographic setting. Solid lines are precipitation amount weighted d-averages (EquationEq. 5(5)
(5) ), dashed lines are non-weighted arithmetic means (EquationEq. 4
(4)
(4) ). The dotted line in the “Kabul and Kashmir” subplot is the non-weighted arithmetic mean of the Kashmir valley after Jeelani et al. (Citation2017). Sample size is shown in lower left corner of each subplot.
The first region to consider along the proposed W–E transect is the Western Mediterranean. Stations in this region have an average deuterium excess of 10‰–12‰ in the cold season and around 3‰ in the warm season (). The seasonal evolution is a smooth sinusoidal course between those two extremes. The differences between precipitation-weighted and non-weighted averages increase from 1‰ in the cold season to 3‰ in the warm season.
This seasonal pattern continues in eastward direction in the eastern Mediterranean and Levant where cold season values reached 17‰ and 22‰, respectively (). Warm season values scatter around 6‰–7‰, which results in a more pronounced seasonal oscillation in the Levant region when compared with the eastern Mediterranean. For July and August, no monthly isotope values were recorded in the Levant region because of the absence of rain. Precipitation amount-weighted to non-weighted differences increase from cold to warm seasons in the eastern Mediterranean. However, these differences decrease in the Levant region. For all those three Mediterranean-influenced regions, the spatial and temporal resolution of isotope data is very good and averages of d-values can be assumed to be representative for their respective region.
The Middle East region (for extent of this region as defined in this study see ) is dominated by data from the GNIP station at Teheran (Iran), while additional measurements are mainly single monthly values from various sampling sites in Iraq (). The seasonal variations of d-values are similar to the regions located to the west (W and E Mediterranean, Levant) described above (), however, they show more variable values for late summer due to low volume sample sizes. An approximate difference between cold and warm seasons of about 15‰ in d-values is comparable to the seasonal differences in the Levant region. The Middle East absolute values range from about 0‰ to about 17‰ (), while d-values observed in Levant range from ∼7‰ to ∼22‰.
South of the Middle East region landmass, the Persian Gulf acts as a moisture source for passing air masses. In this region, the only available GNIP station of Bahrain exhibits d-values between 19‰ in the cold season and 7‰ at the beginning of the warm season (). A strong difference between precipitation-weighted and non-weighted d averages was found here. Moreover, in summer, absence of precipitation leaves a gap in the d-record. In general, the seasonal d-value patterns of the region around the Persian Gulf are comparable to the d-values of the Middle East region.
Following the transect further eastwards, a distribution between cold and warm seasons similar to the Mediterranean can also be observed in the GNIP station of Kabul (Afghanistan). This is also reflected in precipitation samples of Jeelani et al. (Citation2017) that were collected from the Kashmir Valley (India), with high d-values of ∼21‰ in the cold season and low values of 3‰–7‰ in the warm season ().
The d-values of stations in Northern India are less variable than those of stations described so far, with a minimum–maximum difference of around 8‰ (). Precipitation weighted values generally decrease from January with 14‰ to 6‰ in June. From July to October d-values are stable around 8‰. A notable difference between precipitation weighted and unweighted averages can be observed from March to June.
Stations that were assigned here to the Polar class show d-values between 4‰ and 10‰ (). Contrary to the seasonal distribution pattern with a single summer minimum that is observed eastward from the Mediterranean, this Polar class has two minima in February and July with low d-values around 4‰. A first maximum is found in April with around 7‰. From July to November d-values steadily increase to a second peak of ∼10‰.
Two stations to the northwest of the Pamir Mountains were assigned to the Caspian Sea class that exhibit a similar seasonal evolution when compared to the Polar class stations. However, they show increased amplitudes with minimum and maximum values of 2‰ and 10‰ in June and November ().
Integrated samples (unweighted monthly means here) from the Western Pamir Mountains display d-values between 9‰ and 19‰ (). Note that September values are missing, because of lack of precipitation. A first maximum in March of ∼19‰ is followed by a steady decrease to 9‰ in July. Another peak of around 17‰ is observed in August. December holds another minimum around 9‰, after which values increase until March.
3.3. Possible moisture uptake along air mass trajectories
The calculated air mass trajectories leading up to each sampled rain event in the Western Pamir Mountains are shown in . Note that none of the calculated trajectories for the sampling sites arrived from an eastern direction. Some of the trajectories had the majority of their moisture uptake and their origin beyond the reasonable boundaries of the radial classes introduced in the methods section. These six long-distance trajectories (, small box; ) include pathways with main moisture uptake over the northeastern Atlantic Ocean in January, from the western Atlantic Ocean in March, and from northern Africa in January and December.
Fig. 5. Statistics of air mass trajectories. (a) Number of trajectories per month that had the majority of their moisture uptake in the area of a certain class. (b) Monthly percentage of the total amount of specific humidity that arrived at the measurement site via the calculated trajectories.
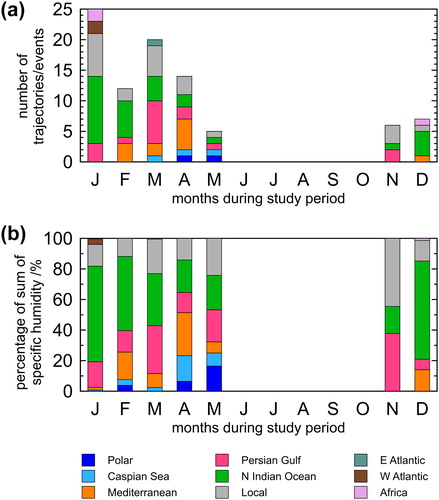
Statistics of events or trajectories per class and month are shown in . January holds the annual maximum of 25 sampled precipitation events, while June to October was dry and no precipitation was collected. Events assigned to the N Indian Ocean class are most frequent in January with a decrease in spring and an increase from November to January. If the Persian Gulf and the Mediterranean class are combined, they show a similar distribution, but with a maximum of precipitation events in March. Polar and Caspian Sea class precipitation events are rare and only obvious in late spring.
was generated using the specific humidity information along the trajectories. As stated in the methods section, an increase in specific humidity below the PBL is assumed to correspond to additional moisture uptake from the ground surface along the pathway of transported water vapour. Consequently, each point along the trajectories, where an increase in specific humidity is detected, is considered an additional source for the precipitation at the sampled rain event. For the month of January, the increase in specific humidity of all points of one class was added up. This sum of specific humidity increase of one class was expressed as a percentage relative to the sum of specific humidity increase of all classes, during the month of January. This operation was repeated for each month and enables to untangle the moisture contribution of the different classes to precipitation at the sampling site.
Moisture contribution of the N Indian Ocean class varies between 15% and 60%. The sum of Persian Gulf and Mediterranean moisture fluctuates between 20% and 40%. Moisture from the Caspian Sea and Polar classes each has maximum contributions of 15%.
Each trajectory eventually leads up to a rain event, for which the d-value was calculated according to EquationEq. (2)(2)
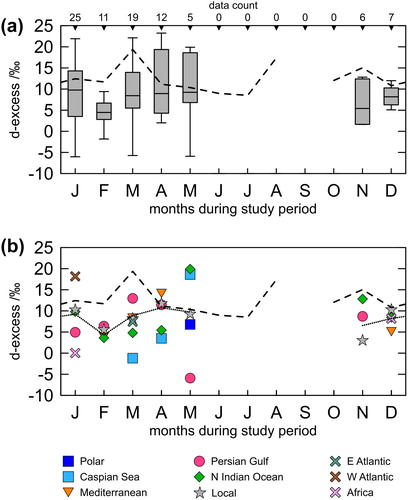
(2) . The d-values of the Western Pamir Mountain rain events are summarised as monthly boxplots in . In order to compare different classes and to retain a seasonal resolution, an average of d-values for each month and class was calculated. Thus, shows one point per class for each month, if at least one trajectory was assigned to this class.
Fig. 6. Deuterium excess of rain events at the termination of air mass trajectories. (a) Boxplot of all event samples (whiskers end at last values inside 1.5 IQR), including sample size for each box at the top axis. (b) Monthly averages for event samples of every class. For number of trajectories per plot symbol refer to . Dashed line represents monthly d values of the Western Pamir class of monthly-integrated samples (see grey plot of ), dotted line represents monthly average of all event values.
4. Discussion
4.1. Monthly averaged values
The evolution of d-values along the considered transect from the Mediterranean to Central Asia is initiated by Atlantic moisture, which arrives at the western Mediterranean. In winter, the deuterium excess of 10‰–12‰ is near the value of the GMWL and consistent with average moisture produced over the Atlantic Ocean (Dansgaard, Citation1964). Additional local moisture from evaporated water of the Mediterranean Sea strongly depends on the season. The atmospheric conditions during the cold season favour the formation of water vapour with higher d-values, when cold and dry air from the continent prevails (Gat and Carmi, Citation1970; Rindsberger et al., Citation1983; Liotta et al., Citation2006). In the warmer season more humid air prevents high d-values. Additionally, warm season sub-cloud evaporation of falling water droplets enhances d-value decrease, which results in even lower d-values (Stewart, Citation1975). This trend manifests itself in positive deviations of precipitation-weighted from non-weighted monthly averages, because lighter rain events, which increasingly suffer from sub-cloud evaporation, contribute less to precipitation-weighted averages. The general increase of d-values in precipitation from the western to the eastern Mediterranean is consistent with the meteorological evolution, where air becomes drier the further eastwards it moves. The warmer season d-values in the eastern Mediterranean are comparable to the western Mediterranean, whereas winter values increase eastward. This winter increase is due to stronger evaporation in the eastern, more enclosed part of the Mediterranean basin. There, continental influences of cold, dry air are increased (Gat and Carmi, Citation1970). This can also be observed in the residual seawater that undergoes a d-value shift from ∼–3‰ in the western Mediterranean to ∼–5‰ in the eastern Mediterranean. As local seawater serves as a source for precipitation, this shift is also transposed to the rainout trajectories. Compared to the Mediterranean, the Levant region is subject to increased continental influence with warmer summers and colder winters (Kalnay et al., Citation1996; their long term monthly mean temperature data), which increases the overall d-value together with its seasonal amplitude.
In the Middle East this trend does not continue, which can result from various influences. First, mixing of Mediterranean moisture with other less-enriched moisture sources (e.g. Black Sea; IAEA, Citation2005) can account for a decrease in average d-values. Second, another important factor is the lower relative humidity compared with the Eastern Mediterranean that can induce a more pronounced sub-cloud evaporation. Notably smaller rain amounts in the Middle East also increase this observable effect of the amount driven sub-cloud evaporation.
In the Persian Gulf, the GNIP station in Bahrain is dominated by dry air, which is also manifested by missing summer precipitation and large differences between amount-weighted and averaged d-values. These d-values are similar to those of the Eastern Mediterranean, however, the seasonal evolution does not show the smooth sinusoidal evolution of the Mediterranean stations and is noisier. One potential interpretation is that nearby local evaporation of Persian Gulf seawater plays a major part in the precipitation of this station. Further possible influences of moisture from the Indian Ocean were proposed by Rizk and Alsharhan (Citation1999).
In Northern India, the seasonal distribution pattern of d-values differs clearly from the simple sinusoidal trough-peak distribution of the Mediterranean. Since India is strongly influenced by air from the Indian Ocean, the seasons in this region differ from European ones and are comprised by winter, summer, monsoon, and post-monsoon season. The generally increased d-values in winter have been interpreted as of Mediterranean or generally western origin from where moisture is transported eastward by so-called Western Disturbances. These wind patterns are extra-tropical cyclones (Dimri et al., Citation2015; Dimri and Chevuturi, Citation2016) in high-altitude air masses (Jeelani et al., Citation2017). The warm season from March to June is hot and dry, a fact that causes decreasing d-values and a more pronounced sub-cloud evaporation effect. During the monsoon season from July to September d-values are stable around 8.5‰ and no difference between amount-weighted and non-weighted could be observed. This is due to heavy rainfall events that saturate the air quickly with moisture and prevent pronounced sub-cloud evaporation (Peng et al., Citation2005).
The GNIP station in Kabul and a site in the Kashmir valley (Jeelani et al., Citation2017), both located south of the Pamir Mountains, are located at the crossway of proposed Mediterranean and Monsoon air mass influences. Cold season values can be ascribed to moisture of Mediterranean origin with a high probability due to the extreme high d-values of around 20‰. Around July, monsoon and Mediterranean precipitation both show similar values and cannot be differentiated from monthly d-values. As a result, the overall annual d-value pattern is more similar to Mediterranean stations than to Indian ones ().
GNIP stations to the North and Northwest of the sampling site (Caspian Sea and Polar class in ) are located in cooler and more continental settings. Stations in both regions exhibit a similar seasonal d-value distribution. Their seasonal amplitude is smaller compared to more maritime stations and below 10‰ year-round.
The seasonal evolution in the Western Pamir Mountains is not so obvious with respect to the possible influence of the discussed sources or transit paths. The shape of the seasonal distribution in the Western Pamir is different from the simple sinusoidal trend westward and in Kabul and Kashmir (). The annual weighted average of d of 13‰ is higher than the 10‰ of average global precipitation, which suggests influence of enriched moisture. From October to February, during the cold season, values range between 10‰ and 12‰, with the exception of 15‰ in November. This is lower than the cold season values for the Eastern Mediterranean, and regions eastward, and suggests a divers and not exclusively Mediterranean moisture origin. The d-values of March and August are positive outlier with 19‰ and 17‰. Similar positive excursion could be observed in Bahrain in March, albeit only reaching 13‰, and in Kabul in August with 20‰. However, a causal connection between these month-long irregularities is highly speculative. During summer months, d-values decrease to a range between 8‰ and 9‰ in July that are comparable to the Kashmir Valley and Northern India during the monsoon season. Northern moisture with year-round d-values below 10‰ does not seem to exert significant influences on those in the Western Pamir Mountains with d-values above 10‰ during most of the year.
4.2. Event trajectories
Air mass trajectories give a good indication from where the moisture for a specific precipitation event originated. During the sampled period, a dry period from June to October made it difficult to analyse general year-round source variabilities. For the rest of the year, however, moisture sources were variable (). Most of the time, moisture from each sector contributed to precipitation in the Pamir Mountains.
Long-distance trajectories from Africa or the W Atlantic occurred with a higher frequency in December and January (). This can be due to the prevailing west wind zone in temperate latitudes during winter, where air can be transported westward over long distances. The accompanying d-values are diverse and range between 0‰ and 18‰. They also do not show a seasonal trend (). Because of the low number of occurrences, d-values of the long-distance trajectories are not further discussed here.
Moisture from northern and northwestern areas arriving in the Western Pamir Mountains could mainly be detected from March to May (). In March, moisture from the Caspian Sea class has slightly negative d-values (). The evolution to May with notably increasing d-values is consistent with average air temperature and relative humidity. Temperatures near 0 °C and high relative humidity keep d-values near 0‰ in winter. During spring, temperatures increase and the air becomes drier. This in turn increases the d-value of evaporated Caspian Sea water as well as the possible contribution of recycled water from soils and other surface water bodies.
The contribution of N Indian Ocean moisture decreases from January to May from around 60% to 20%, which can result from the hot and dry Indian summer season climate around March, April, and May (). Another hint to this Indian summer dryness are the notably lower d-values of ∼5‰, compared to 9‰–13‰ in the cold season (). After the monsoon season, air from the N Indian Ocean adds increasingly more moisture and dominates the winter months in the Western Pamir Mountains. Additionally, the d-averages of monthly integrated samples (dashed lines, Western Pamir plot, and ) compare relatively well with the averages of event samples from the N Indian Ocean (green diamonds, ) during November, December, and January, which also points to a cold season dominance of N Indian Ocean moisture.
Mediterranean and Persian Gulf moisture do not show a simple distribution concerning the contribution to the total amount of specific humidity in the Western Pamir Mountains. If both are summed up and subsequently interpreted as ‘western’ moisture, an increase from January to April and a subsequent decrease to May can be found (). In December, January, and February, moisture contributions from ‘western’ classes were as low as 20%–30%, while a maximum of around 40% occurred in March and April.
This observation is in contrast to several other studies in the wider region (Aizen et al., Citation1995; Kreutz et al., Citation2003; Tian et al., Citation2007), where Mediterranean moisture is often proposed to be a major source of precipitation and influences d-values during winter months. Especially in the notch formed by Himalaya and Hindu Kush Mountains, Western Disturbances contribute to the formation of a low pressure area in winter, resulting in precipitation events enriched in the heavy isotopes 18O and 2H (Lang and Barros, Citation2004). Regions on the southern flank of the Hindu Kush and Karakoram Mountains receive more Mediterranean moisture, which is indicated by high d-values of around 20‰ in the cold season (, Kabul and Kashmir region). The Western Pamir Mountains seem to be less influenced by these high d-values of Mediterranean origin. This tendency is even clearer when the type of precipitation in the Western Pamir Mountains is considered. In contrast to rain, snow formation in clouds happens under non-equilibrium conditions (Lamb et al., Citation2017) and tends to elevate the d-values of the resulting snow above the water vapour it was formed from (Jouzel and Merlivat, Citation1984; Uemura et al., Citation2005). Thus, snow samples derived from Mediterranean moisture should show even higher d-values. Since at least part of the precipitation during the winter months falls in the form of snow, a connection to high d-values of Mediterranean origin should be expected to be expressed more clearly.
Precipitation events that were assigned to the ‘local’ moisture source class represent moisture from within 3° radial distance. The d-values of these events are in the same range as N Indian Ocean and western moisture ().
Moisture from the proximity of the measurement stations ultimately also originates from evaporated vapour of different seas. Therefore, a comparison between its d-value and those of other source area classes can help to understand the moisture source of a wider region. In November, local moisture is a major contributor () with low d-values (). From December to February, ‘local’ d-values are in the range of N Indian Ocean values. This changes from February to April when they resemble western d-values more closely. This behaviour correlates well with the seasonal specific humidity contribution, where most moisture stems from the N Indian Ocean in December and January, and western moisture takes the lead in March. Over the course of the year, d-values of the ‘local’ class are closely related to the overall average of event samples (dotted line in ). This indicates that moisture in the 3° proximity to the sampling stations is well represented by the average of all discussed moisture sources at the sampling site. This shows that the sampled precipitation events are representative of a wider region.
5. Conclusions
The strong influence of Mediterranean or western air masses and moisture that seems to influence several sites on the southern slopes of Himalaya and Hindu Kush Mountains, could not be found as distinctively in our event-based and monthly integrated data. Specifically, deuterium excess values above 15‰ that are typical for cold season precipitation in the eastern Mediterranean and further east, as well as in the Persian Gulf and Kabul, were not as abundant in the Western Pamir Mountains during this time of the year.
With respect to our hypothesis regarding the influence of Mediterranean moisture, our data evaluation of trajectories from the Western Mediterranean to the Western Pamir show a maximum moisture contribution during March and April, when it was not initially expected. Stations with monthly integrated precipitation collection along this transect exhibit a seasonal d-excess trend of a clear sinusoidal shape. This characteristic was not observed in the Western Pamir Mountains, where month-long spikes are superimposed on a weaker seasonal trend.
Our findings confirm the complexity of precipitation moisture origin in Central Asia and suggest to refrain from simple conclusions, such as linking high d-values to Mediterranean moisture without thorough discussion. The observations of a maximum ‘western’ moisture contribution in March and April and its relatively low d-values of below 15‰ contradict the simplified assumptions of other studies concerning moisture sources in Central Asia. The seasonal distribution of d-values in Kabul and the Kashmir Valley resemble what can be expected from a continuation of the eastward trend from the Mediterranean to the Middle East and the transport of Mediterranean moisture.
The sparse distribution of isotope data in precipitation in the Middle East and Central Asia needs to be improved for a more thorough assessment of water availability and sources in these regions. Future studies would benefit from an increased number of stations that collect precipitation for stable isotope analyses along the transect from the Mediterranean to Central Asia, to address further important research questions such as the calculation of the contribution of recycled water to precipitation. Therefore, the authors like to encourage submission of isotope data to freely accessible online databases, such as the GNIP/GNIR database (iaea.org/water), the Waterisotopes Database of The University of Utah (waterisotopes.org) or the World Data Center PANGAEA (pangaea.de).
Acknowledgments
We thank Katja Trachte for her helpful comments on the trajectory analysis and two anonymous reviewers for their helpful comments. We thank the State Administration for Hydrometeorology of Tajikistan for their cooperation. We highly appreciate the help of the entire PAMIR-project team for their great support in the field. The PAMIR team further includes Malte Knoche, Eric Pohl, Richard Gloaguen, Karsten Osenbrück, Stefan Geyer, Tino Rödiger, Christian Siebert, and Wolfgang Busch.
Disclosure statement
The authors declare no conflict of interests.
Additional information
Funding
References
- Aemisegger, F., Pfahl, S., Sodemann, H., Lehner, I., Seneviratne, S. I., and co-authors. 2014. Deuterium excess as a proxy for continental moisture recycling and plant transpiration. Atmos. Chem. Phys. 14, 4029–4054. doi:10.5194/acp-14-4029-2014
- Aizen, V. B., Aizen, E. M. and Melack, J. M. 1995. Climate, snow cover, glaciers, and runoff in the Tien Shan, central Asia. J. Am. Water Resources Assoc. 31, 1113–1129. doi:10.1111/j.1752-1688.1995.tb03426.x
- Aizen, V. B., Aizen, E. M., Melack, J. and Martma, T. 1996. Isotopic measurements of precipitation on central Asian glaciers (southeastern Tibet, northern Himalayas, central Tien Shan). J. Geophys. Res. 101, 9185–9196. doi:10.1029/96JD00061
- Al Charideh, A. R. and Zakhem, B. A. 2010. Distribution of tritium and stable isotopes in precipitation in Syria. Hydrol. Sci. J. 55, 832–843. doi:10.1080/02626667.2010.487977
- Ali, K. K., Al-Kubaisi, Q. Y. and Al-Paruany, K. B. 2015. Isotopic study of water resources in a semi-arid region, western Iraq. Environ. Earth Sci. 74, 1671–1686. doi:10.1007/s12665-015-4172-6
- Alyamani, M. S. 2001. Isotopic composition of rainfall and ground-water recharge in the western province of Saudi Arabia. J. Arid. Environ. 49, 751–760. doi:10.1006/jare.2001.0815
- Bajjali, W. 1990. Isotopic Characteristic of Precipitation in Jordan. In: Proceedings of the International Symposium on the Use of Isotope Technique in Water Resources Development, Vienna, Austria.
- Bottyán, E., Czuppon, G., Weidinger, T., Haszpra, L. and Kármán, K. 2017. Moisture source diagnostics and isotope characteristics for precipitation in east Hungary: implications for their relationship. Hydrol. Sci. J. 62, 2049–2060. doi:10.1080/02626667.2017.1358450
- Bowen, G. J. and Revenaugh, J. 2003. Interpolating the isotopic composition of modern meteoric precipitation. Water Resour. Res. 39, 1299.
- Clark, I. D. and Fritz, P. 1997. Environmental Isotopes in Hydrogeology. CRC Press, New York.
- Coplen, T. B. 2011. Guidelines and recommended terms for expression of stable-isotope-ratio and gas-ratio measurement results. Rapid Commun. Mass Spectrom. 25, 2538–2560. doi:10.1002/rcm.5129
- Craig, H. 1961. Isotopic variations in meteoric waters. Science 133, 1702–1703. doi:10.1126/science.133.3465.1702
- Craig, H. and Gordon, L. I. 1965. Deuterium and oxygen 18 variations in the ocean and marine atmosphere. In: Proceedings of the Stable Isotopes in Oceanographic Studies and Paleotemperatures, Spoleto, Italy.
- Dansgaard, W. 1964. Stable isotopes in precipitation. Tellus 16, 436–468.
- Dimri, A. P. and Chevuturi, A. 2016. Western Disturbances – An Indian Meteorological Perspective. Springer International Publishing, Basel.
- Dimri, A. P., Niyogi, D., Barros, A. P., Ridley, J., Mohanty, U. C., and co-authors. 2015. Western disturbances: a review. Rev. Geophys. 53, 225–246. doi:10.1002/2014RG000460
- Dongmann, G., Nürnberg, H. W., Förstel, H. and Wagener, K. 1974. On the enrichment of H2 18O in the leaves of transpiring plants. Radiat. Environ. Biophys. 11, 41–52. doi:10.1007/BF01323099
- Friedman, I., Machta, L. and Soller, R. 1962. Water-vapor exchange between a water droplet and its environment. J. Geophys. Res. 67, 2761–2766. doi:10.1029/JZ067i007p02761
- Froehlich, K., Kralik, M., Papesch, W., Rank, D., Scheifinger, H., and co-authors. 2008. Deuterium excess in precipitation of Alpine regions – moisture recycling. Isotopes Environ. Health Stud. Environ. Health 44, 61–70. doi:10.1080/10256010801887208
- Galewsky, J., Steen-Larsen, H. C., Field, R. D., Worden, J., Risi, C. and co-authors. 2016. Stable isotopes in atmospheric water vapor and applications to the hydrologic cycle. Rev. Geophys. 54, 809–865. doi:10.1002/2015RG000512
- Gat, J. R. and Carmi, I. 1970. Evolution of the isotopic composition of atmospheric waters in the Mediterranean Sea area. J. Geophys. Res. 75, 3039–3048. doi:10.1029/JC075i015p03039
- Gat, J. R., Mook, W. G. and Meijer, H. A. J. 2000. Atmospheric water. In: Environmental Isotopes in the Hydrological Cycle – Principles and Applications (ed. W. G. Mook) Vol. 2, IAEA/UNESCO, Paris, p. 114.
- Gat, J. R., Shemesh, A., Tziperman, E., Hecht, A., Georgopoulos, D., and co-authors. 1996. The stable isotope composition of waters of the eastern Mediterranean Sea. J. Geophys. Res. 101, 6441–6451. doi:10.1029/95JC02829
- Gibson, J. J., Birks, S. J. and Yi, Y. 2016. Stable isotope mass balance of lakes: a contemporary perspective. Quat. Sci. Rev. 131, 316–328. doi:10.1016/j.quascirev.2015.04.013
- Guan, H., Zhang, X., Skrzypek, G., Sun, Z. and Xu, X. 2013. Deuterium excess variations of rainfall events in a coastal area of south Australia and its relationship with synoptic weather systems and atmospheric moisture sources. J. Geophys. Res. Atmos. 118, 1123–1138. doi:10.1002/jgrd.50137
- Hamamin, D. F. and Ali, S. S. 2013. Hydrodynamic study of karstic and intergranular aquifers using isotope geochemistry in Basara basin, Sulaimani, North-Eastern Iraq. Arab. J. Geosci. 6, 2933–2940. doi:10.1007/s12517-012-0572-z
- Helliker, B. R. and Ehleringer, J. R. 2000. Establishing a grassland signature in veins: 18O in the leaf water of C3 and C4 grasses. Proc. Natl. Acad. Sci. USA. 97, 7894. doi:10.1073/pnas.97.14.7894
- Hussain, S., Xianfang, S., Hussain, I., Jianrong, L., Dong Mei, H., and co-authors. 2015. Controlling factors of the stable isotope composition in the precipitation of Islamabad, Pakistan. Adv. Meteorol. 2015, 1–11. doi:10.1155/2015/817513
- IAEA 2005. Isotopic composition of precipitation in the Mediterranean Basin in relation to air circulation patterns and climate. In: Iaea-Tecdoc. International Atomic Energy Agency, Vienna.
- IAEA/WMO 2018. Global Network of Isotopes in Precipitation. The GNIP Database. IAEA, Vienna.
- Jeelani, G., Saravana Kumar, U. and Kumar, B. 2013. Variation of δ18O and δD in precipitation and stream waters across the Kashmir Himalaya (India) to distinguish and estimate the seasonal sources of stream flow. J. Hydrol. 481, 157–165. doi:10.1016/j.jhydrol.2012.12.035
- Jeelani, G., Deshpande, R. D., Shah, R. A. and Hassan, W. 2017. Influence of southwest monsoons in the Kashmir Valley, western Himalayas. Isot. Environ. Health Stud. 53, 400–412. doi:10.1080/10256016.2016.1273224
- Johnsen, S. J., Dansgaard, W. and White, J. W. C. 1989. The origin of Arctic precipitation under present and glacial conditions. Tellus B 41, 452–468. doi:10.3402/tellusb.v41i4.15100
- Joussaume, S., Sadourny, R. and Jouzel, J. 1984. A general circulation model of water isotope cycles in the atmosphere. Nature 311, 24–29. doi:10.1038/311024a0
- Jouzel, J. and Merlivat, L. 1984. Deuterium and oxygen 18 in precipitation: modeling of the isotopic effects during snow formation. J. Geophys. Res. 89, 11749–11757.
- Jouzel, J., Merlivat, L. and Lorius, C. 1982. Deuterium excess in an East Antarctic ice core suggests higher relative humidity at the oceanic surface during the last glacial maximum. Nature 299, 688–691. doi:10.1038/299688a0
- Kalnay, E., Kanamitsu, M., Kistler, R., Collins, W., Deaven, D., and co-authors. 1996. The NCEP/NCAR 40-year reanalysis project. Bull. Amer. Meteor. Soc. 77, 437–471. doi:10.1175/1520-0477(1996)077<0437:TNYRP>2.0.CO;2
- Karim, A. and Veizer, J. 2002. Water balance of the Indus River Basin and moisture source in the Karakoram and western Himalayas: implications from hydrogen and oxygen isotopes in river water. J. Geophys. Res.: Atmos. 107, 9-1–9-12.
- Kattan, Z. 1997. Chemical and environmental isotope study of precipitation in Syria. J. Arid. Environ. 35, 601–615. doi:10.1006/jare.1996.0228
- Kreutz, K. J., Wake, C. P., Aizen, V. B., DeWayne Cecil, L. and Synal, H. A. 2003. Seasonal deuterium excess in a Tien Shan ice core: influence of moisture transport and recycling in Central Asia. Geophys. Res. Lett. 30, 2-1–2-4.
- Lamb, K. D., Clouser, B. W., Bolot, M., Sarkozy, L., Ebert, V., and co-authors. 2017. Laboratory measurements of HDO/H2O isotopic fractionation during ice deposition in simulated cirrus clouds. Proc. Natl. Acad. Sci. USA. 114, 5612–5617. doi:10.1073/pnas.1618374114
- Lang, T. J. and Barros, A. P. 2004. Winter storms in the central Himalayas. JMSJ 82, 829–844. doi:10.2151/jmsj.2004.829
- Lee, J.-E. and Fung, I. 2008. Amount effect” of water isotopes and quantitative analysis of post-condensation processes. Hydrol. Process. 22, 1–8. doi:10.1002/hyp.6637
- Liotta, M., Favara, R. and Valenza, M. 2006. Isotopic composition of the precipitations in the central mediterranean: origin marks and orographic precipitation effects. J. Geophys. Res.: Atmos. 111, 1–12.
- Liu, Q., Tian, L. D., Wang, J. L., Wen, R., Weng, Y. B., and co-authors. 2015. A study of longitudinal and altitudinal variations in surface water stable isotopes in West Pamir, Tajikistan. Atmos. Res. 153, 10–18. doi:10.1016/j.atmosres.2014.07.029
- Meier, C., Knoche, M., Merz, R. and Weise, S. M. 2013. Stable isotopes in river waters in the Tajik Pamirs: regional and temporal characteristics. Isot. Environ. Health Stud. 49, 542–554. doi:10.1080/10256016.2013.835809
- Meier, C., Knoche, M., Merz, R. and Weise, S. M. 2015a. Single or multiple source(s) of precipitation in the Western Pamirs, Tajikistan? In: EGU General Assembly 2015. (ed. EGU). EGU, Vienna.
- Meier, C., Knoche, M., Merz, R. and Weise, S. M. 2015b. Monitoring of stable isotopes in river water and precipitation in the Tajik Pamirs. In: Proceedings of the International Symposium on Isotope Hydrology: Revisiting Foundations and Exploring Frontiers, Vienna.
- Merlivat, L. and Jouzel, J. 1979. Global climatic interpretation of the deuterium-oxygen 16 relationship for precipitation. J. Geophys. Res. 84, 5029–5033. doi:10.1029/JC084iC08p05029
- Michelsen, N., Reshid, M., Siebert, C., Schulz, S., Knöller, K., and co-authors. 2015. Isotopic and chemical composition of precipitation in Riyadh, Saudi Arabia. Chem. Geol. 413, 51–62. doi:10.1016/j.chemgeo.2015.08.001
- Michelsen, N., van Geldern, R., Roßmann, Y., Bauer, I., Schulz, S., and co-authors. 2018. Comparison of precipitation collectors used in isotope hydrology. Chem. Geol. 488, 171–179. doi:10.1016/j.chemgeo.2018.04.032
- NOAA 2018. Global Data Assimilation System (GDAS). (ed. NOAA). NOAA, Washington, DC.
- Osati, K., Koeniger, P., Salajegheh, A., Mahdavi, M., Chapi, K., and co-authors. 2014. Spatiotemporal patterns of stable isotopes and hydrochemistry in springs and river flow of the upper Karkheh River Basin, Iran. Isot. Environ. Health Stud. 50, 169–183. doi:10.1080/10256016.2014.857317
- Pang, H., Hou, S., Kaspari, S. and Mayewski, P. A. 2014. Influence of regional precipitation patterns on stable isotopes in ice cores from the central Himalayas. Cryosphere 8, 289–301. doi:10.5194/tc-8-289-2014
- Parizi, H. S. and Samani, N. 2014. Environmental Isotope Investigation of Groundwater in the Sarcheshmeh Copper Mine Area, Iran. Mine Water Environ. 33, 97–109. doi:10.1007/s10230-014-0277-5
- Parkes, S. D., McCabe, M. F., Griffiths, A. D., Wang, L. and Chambers, S. and co-authors 2017. Response of water vapour D-excess to land–atmosphere interactions in a semi-arid environment. Hydrol. Earth Syst. Sci. 21, 533–548. doi:10.5194/hess-21-533-2017
- Peng, H., Mayer, B., Norman, A. and Krouse, H. R. 2005. Modelling of hydrogen and oxygen isotope compositions for local precipitation. Tellus B 57, 273–282. doi:10.1111/j.1600-0889.2005.00145.x
- Pfahl, S. and Sodemann, H. 2014. What controls deuterium excess in global precipitation? Clim. Past. 10, 771–781. doi:10.5194/cp-10-771-2014
- Rindsberger, M., Magaritz, M., Carmi, I. and Gilad, D. 1983. The relation between air mass trajectories and the water isotope composition of rain in the Mediterranean Sea area. Geophys. Res. Lett. 10, 43–46. doi:10.1029/GL010i001p00043
- Rizk, Z. S. and Alsharhan, A. S. 1999. Application of natural isotopes for hydrogeologic investigations in United Arab Emirates. In: Proceedings of the Fourth Gulf Water Conference, Manama, Bahrain.
- Rolph, G. D., Stein, A. F. and Stunder, B. J. B. 2017. Real-time environmental applications and display system: READY. Environ. Modell. Softw. 95, 210–228. doi:10.1016/j.envsoft.2017.06.025
- Rozanski, K., Araguás-Araguás, L. J. and Gonfiantini, R. 1993. Isotopic patterns in modern global precipitation. In: Climate Change in Continental Isotopic Records (eds. P. K. Swart, K. C. Lohmann, J. Mckenzie and S. Savin). Washington, DC, pp. 1–36.
- Steffensen, J. P., Andersen, K. K., Bigler, M., Clausen, H. B., Dahl-Jensen, D., and co-authors. 2008. High-resolution Greenland ice core data show abrupt climate change happens in few years. Science 321, 680–684. doi:10.1126/science.1157707
- Stein, A. F., Draxler, R. R., Rolph, G. D., Stunder, B. J. B., Cohen, M. D., and co-authors. 2015. NOAA’s HYSPLIT atmospheric transport and dispersion modeling system. Bull. Amer. Meteor. Soc. 96, 2059–2077. doi:10.1175/BAMS-D-14-00110.1
- Stewart, M. K. 1975. Stable isotope fractionation due to evaporation and isotopic exchange of falling waterdrops: applications to atmospheric processes and evaporation of lakes. J. Geophys. Res. 80, 1133–1146. doi:10.1029/JC080i009p01133
- Stumpp, C., Klaus, J. and Stichler, W. 2014. Analysis of long-term stable isotopic composition in German precipitation. J. Hydrol. 517, 351–361. doi:10.1016/j.jhydrol.2014.05.034
- Terzer, S., Wassenaar, L. I., Araguás-Araguás, L. J. and Aggarwal, P. K. 2013. Global isoscapes for δ18O and δ2H in precipitation: improved prediction using regionalized climatic regression models. Hydrol. Earth Syst. Sci. 17, 4713–4728. doi:10.5194/hess-17-4713-2013
- Tian, L., Yao, T., MacClune, K., White, J. W. C. and Schilla, A. and co-authors 2007. Stable isotopic variations in west China: a consideration of moisture sources. J. Geophys. Res. 112, 1–12.
- Uemura, R., Matsui, Y., Yoshida, N., Abe, O. and Mochizuki, S. 2005. Isotopic fractionation of water during snow formation: experimental evidence of kinetic effect. Polar Meteorol. Glaciol. 19, 1–14.
- Wang, X., Li, Z., Tayier, R. and Wang, S. 2015. Characteristics of atmospheric precipitation isotopes and isotopic evidence for the moisture origin in Yushugou River basin, Eastern Tianshan Mountains, China. Quat. Int. 380-381, 106–115. doi:10.1016/j.quaint.2014.12.023
- Yao, T., Masson-Delmotte, V., Gao, J., Yu, W., Yang, X., and co-authors. 2013. A review of climatic controls on δ18O in precipitation over the Tibetan Plateau: observations and simulations. Rev. Geophys. 51, 525–548. doi:10.1002/rog.20023
- Yurtsever, Y. and Gat, J. R. 1981. Atmospheric waters. In: Stable Isotope Hydrology (eds. J. R. Gat and R. Gonfiantini). Technical Reports Series No. 210. International Atomic Energy Agency, Vienna, pp. 103–142.