
 ?Mathematical formulae have been encoded as MathML and are displayed in this HTML version using MathJax in order to improve their display. Uncheck the box to turn MathJax off. This feature requires Javascript. Click on a formula to zoom.
Abstract
In situ aircraft measurements of aerosols and clouds were performed over the eastern Loess Plateau in Shanxi Province, China. The microphysical properties of both aerosols and warm clouds, including aerosol number concentration (Na), particle effective diameter (ED), number concentration of cloud droplets (Nc), cloud droplet diameter (Dc), and liquid water content (LWC) of clouds, determined through six flight observations performed in May 2013 were obtained and analysed. The mean magnitude of measured Na over the six flights was 103 cm−3, and accumulation mode particles dominated the majority. Most EDs of aerosol particles were less than 1 μm. Large amounts of fine aerosol particles were constrained to the lower layer, with ED smaller than 0.5 μm, and Na decreased with height. The base heights of warm clouds ranged from 1000 to 2800 m. The maximum and average values of the measured Nc ranged from 147 to 311 cm−3 and 51 to 157 cm−3, respectively. The maximum and average Dc ranged from 13.5 to 28.9 and 5.8 to 13.1 μm, respectively. The average LWC of warm clouds was 0.05 g·m−3. Na was negatively correlated with Nc either in the vertical or horizontal direction. Nc was higher with a smaller size of cloud droplets under high aerosol loading conditions. A small number of cloud droplets with larger size were formed under low aerosol loading conditions. At a certain range of LWC, Nc and Dc showed a negative correlation. The increase in LWC was related to an increase in the size of cloud droplets rather than the number of cloud droplets. The cloud droplet size distribution showed that small droplets dominated the total cloud droplet concentration. A bimodal lognormal distribution function can be efficiently used to describe the average spectrum of warm cloud droplets.
1. Introduction
Atmospheric aerosols exert a significant effect on Earth’s radiative forcing by scattering and absorbing solar radiation directly (Yang et al., Citation2016a, Citation2016b). In addition, atmospheric aerosols affect the microphysical properties of clouds by acting as cloud condensation nuclei (CCN) or ice nuclei (IN) during cloud formation (Twomey, Citation1977; Garrett et al., Citation2004; Garrett and Zhao, Citation2006; Zhao et al., Citation2012; Qiu et al., Citation2017; Zhao et al., Citation2018a); this, in turn, modifies the formation regime of rain, snow, and other forms of precipitation and further affects the climate system (Haywood and Boucher, Citation2000; Haywood et al., Citation2003; Lohmann and Feichter, Citation2005; Andreae and Rosenfeld, Citation2008; Li et al., Citation2011a; Tao et al., Citation2012; Zhao et al., Citation2018b). The spatial distribution of aerosol particles, including the number concentration (Na) and effective diameter (ED), exerts strong effects on the estimates of direct and indirect radiative forcing by aerosols (Welton et al., Citation2002; Han et al., Citation2003; Garrett and Zhao, Citation2006; IPCC, Citation2007; Campbell et al., Citation2013; Ma and Yu, Citation2014; Zhao and Garrett, Citation2015; Li et al.,Citation2015a). Changes in the concentration, particle size, source, and type of aerosols also affect the optical properties, cover, and lifetime of clouds (Haywood and Boucher, Citation2000; Hudson et al., Citation2011; Hudson and Noble, 2011, Citation2014a, Citation2014b). Aerosol particles appearing at the cloud level can affect the microphysical properties of clouds, including cloud droplet number and size distribution and liquid water content (LWC), which are crucial factors in the formation process of precipitation (Deng et al., Citation2009; Zhang et al., Citation2011). Many studies have been conducted to understand the physical, chemical, and optical properties of aerosol particles and their effects on cloud, precipitation, and other weather phenomena (Yin et al., Citation2000, Citation2002; Zhao et al., Citation2006; Grützun et al., Citation2008; Li et al.,Citation2011b; Calvo et al., Citation2013; Junkermann and Hacker, Citation2015; Zhao et al., Citation2015; Citation2017; Yuan et al., Citation2016). However, an in-depth understanding of the properties of atmospheric aerosol particles is still lacking, and large uncertainties remain in the study of aerosols, especially in terms of interactions between aerosols and clouds. In particular, Fan et al. (Citation2018) indicated that the representation of the aerosol–cloud interaction in climate models is an important factor contributing to the poor simulation of cloud cover. Therefore, the spatial distribution of aerosols and the relationship between aerosols and clouds should be explored by performing extensive measurements and simulations in different places (Yin et al., Citation2000, Citation2002; Fan et al., Citation2012; Hudson and Noble, Citation2014a, Citation2014b).
In different observation methods, data on aerosols and clouds are mainly retrieved from ground-based instruments such as a ground-based LIDAR or cloud radar, and remote sensing measurements such as satellite data products; however, detailed microphysical parameters of aerosols and clouds remain poorly observed and analysed. Aircraft observations can afford the principal advantage of yielding detailed information on aerosol and cloud properties with height, albeit within short time periods over geographic areas of limited extent, thereby enabling the question of aerosol and clouds properties in the vertical direction to be addressed. So, aircraft measurements enable us to directly determine the spatial distribution characteristics of aerosols and the microphysical properties of cloud droplets with high temporal and spatial resolution in the target area (Junkermann and Hacker, Citation2015; Pace et al., Citation2015; Li et al., Citation2015a, Citation2015b). Thus, aircraft measurements are important for studying aerosol–cloud interactions (Bahreini et al., Citation2003; Andreae and Rosenfeld, Citation2008; Zhang et al., Citation2011; Hao et al., Citation2017; Zhao et al., 2018).
In recent decades, extensive airborne measurements of aerosol properties have been performed in China, such as in the North China Plain (Zhang et al., Citation2006, Citation2009; Liu et al., Citation2009; Yin et al., Citation2009; Sun et al., Citation2013), the Loess Plateau (Li et al., Citation2011, Citation2012, 2015a, Citation2015b), and eastern China (Hao et al., Citation2017). A few aircraft measurements of aerosol–cloud interactions have also been carried out, and some valuable results have been reported. For example, Deng et al. (Citation2009) used data from 75 flights around the Beijing area between 2005 and 2006 to analyse the statistical microphysical properties and parameterization of the effective radius of warm cloud droplets; they suggested that LWC plays an important role in controlling the cloud droplet number concentration and affects the droplet size. Zhang et al. (Citation2011) analysed aerosol–cloud interactions over highly polluted areas of Beijing by using data from seven aircraft flights and reported that the cloud droplet size is considerably affected by the aerosol number concentration and LWC. Zhao et al. (2018) used six in situ flight observations to study the relationship between aerosol loading and cloud microphysical properties in September 2015 over Hebei, China, and they reported that the aerosol first indirect effect was approximately 0.10–0.19. However, because of high operating costs, strict control of airspace, and other reasons, aircraft observations of the spatial distribution and microphysical properties of aerosols and clouds over different areas are still lacking. Therefore, this study evaluated uncertainties in measured aerosol and cloud properties including the measured characteristics of aerosols and cloud droplets. The relationship between aerosols and cloud droplets in different LWCs, and the effect of high and low aerosol concentrations on cloud formation were also discussed.
An airborne campaign focused on comprehensive observation of atmospheric aerosol and cloud characteristics was conducted in May 2013 in Shanxi Province over the eastern Loess Plateau of China. In this study, data from six flights on five cloudy days were selected to analyse the spatial distribution of aerosols and microphysical properties of clouds during spring.
This article is organised as follows. Section 2 describes the observation area, aircraft campaign details, and data sets. Section 3 presents and provides a detailed discussion of measured results. Section 4 presents the conclusion.
2. Description of the field campaign
2.1. Observation area
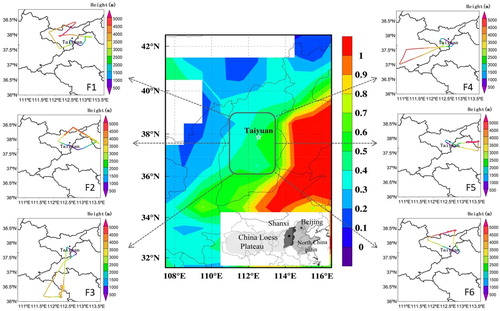
The observation area is located in Shanxi Province. As shown in , Shanxi Province is located on the eastern Loess Plateau of northern China, and the Loess Plateau covers most of the province. The average surface altitude of the entire province is approximately 1000 m (height above sea level [ASL]). As one of the most important energy and heavy chemical bases of China, coal burning, steel, and chemical industries are the main industries here (Li et al., Citation2011, Citation2012). An increase in the concentration of anthropogenic aerosol particles from industrial emissions may exert a strong effect on the regional atmospheric environment and climate. From the year 2011, a few observational experiments concerning aerosols and clouds have been performed in this area, and some results have been reported (Li et al., Citation2011, Citation2012, Citation2015a, Citation2015b, Citation2017a; Wang et al., Citation2012), which attracted considerable attention from researchers and the public. This aircraft observation campaign was conducted at Wusu International Airport located in Taiyuan (112.55°E, 37.867°N and altitude: 778 m ASL), the capital of Shanxi Province, and the observation area was mainly in the central area of Shanxi ().
Fig. 1. Map of Shanxi Province in North China with the six flight tracks. The shaded contour represents the mean distribution of aerosol optical depth during 121–151 days (May 1–May 30) in 2013 obtained from moderate resolution imaging spectroradiometer data, and Taiyuan City is marked with a white star. The inset map shows the location of the observation area in China, and the dark gray-shaded area shows Shanxi Province.
2.2. Instruments in the aircraft
A Y-12 turboprop airplane was used as the main observation platform. The typical flight speed is 60–70 ms−1, and the rate of ascent and descent is 2–5 ms−1. This airplane is equipped with multiple aerosol and cloud instruments. Each instrument was calibrated and tested rigorously before the airborne campaign. A passive cavity aerosol spectrometer probe (PCASP-100X, DMT) was used to observe aerosol particles with diameters of 0.09–3.0 μm within 30 variable size bins at a frequency of 1 Hz. The particle number concentration range recorded by the PCASP is 0–2.0 × 104 cm−3. And the estimated uncertainty of the aerosol number concentration by PCASP is approximately 10–15% (Duan et al., Citation2012; Cai et al., Citation2013). A cloud droplet probe (CDP, DMT, USA) was used to observe cloud droplets with diameters of 2–50 μm within 30 size bins at a frequency of 1 Hz. The width of the first 12 channels of the CDP is 1 μm, and the width of bins ranged from 13 to 30 is 2 μm. The measurement resolution of the CDP is 1 μm, and the observed cloud droplet number concentration range of CDP is 0–104 cm−3. The estimated uncertainty of the cloud droplet number concentration by CDP probe is about 20% (Lance, Citation2012). The PCASP and CDP were calibrated using polystyrene latex spheres manufactured by Particle Metrics Inc. (PMI, USA) before conducting measurements. The meteorological parameters including ambient temperature (T), relative humidity (RH), and location were measured by using a meteorological package named Aircraft Integrated Meteorological Measurement System (AIMMS-20, Advantech Research Inc.) at a frequency of 1 Hz. Temperature measured by AIMMS-20 ranges from −20 °C to 40 °C with a detection accuracy of 0.3 °C, and the relative humidity detection accuracy is 2.0% with a resolution of 0.1%. Cloud LWC was measured by a LWC King probe (DMT, USA). The estimated uncertainty of LWC data is approximately 15%. A global positioning system (GPS) device was used to record the airplane location during the flights, too. Data in the first bins of the PCASP (0.09–0.1 µm) and CDP (2–3 µm) were inaccurate due to detection limits; thus, they were eliminated from the analysis. In this study, all the concentrations of aerosol particles and cloud droplets are presented in terms of standard temperature and pressure conditions (STP, 273.15 K and 101.3 kPa.). The time indicated in this study refers to the China Standard Time (CST), and heights indicated in this paper refer to heights above ground level (AGL) of Taiyuan.
2.3. Data sets
Data from the six flights were used in this study. To obtain complete observational data, all equipments were turned on before the aircraft took off. After takeoff, the aircraft always slowly climbed to the designated observation area and performed observation. The sampling interval was 1 s during all flights. The aircraft flight altitudes were normally from surface to 6000 m height. If the aircraft penetrated clouds, horizontal observations were performed at different heights in the cloud region. Flight details are listed in , and flight tracks are shown in .
Table 1. Flight summary (date: yy-mm-dd, time: hh:mm (CST), height: m).
To define the appearance of clouds, several criteria were used according to previous studies. The number concentration of the CDP is often used as a criterion; for example, Nc > 10 cm−3 (Rangno and Hobbs, Citation2005; Stith et al., Citation2006), and LWC > 0.01 g·m−3 (Gultepe et al., Citation1996; Gultepe and Isaac, Citation2004) or LWC > 0.001 g·m−3 (Deng et al., Citation2009; Zhang et al., Citation2011) is another criterion. In this study, valid records of cloud measurements were determined using the following criterions. First, records with a total cloud droplet number concentration of >10 cm−3 and an integrated LWC of >0.001 g·m−3 were selected for analysis. Second, only records with ambient temperature warmer than 0 °C were chosen to avoid the influence of ice particles. Third, a record was removed if it was not in 5-s or longer consecutive serials. Cloud bases and tops were determined as the lowest and highest heights, respectively, for a continuous layer. Thus, a total of 18 cloud profile detections were performed through the six flights during the observation period, and the total number of warm cloud data records was 2871 (), including 2368, 233, and 270 records for altostratus (As), small cumulus (Cu), and stratocumulus (Sc) clouds, respectively. The measurements of aerosol particles in and out of clouds can affect cloud formation (Zhang et al., Citation2011; Hao et al., Citation2017). To discuss aerosol–cloud interactions, some studies have determined the aerosol–cloud relationship by using column aerosol properties (Yuan et al., Citation2008) or surface aerosol properties (Garrett et al., Citation2004; Garrett and Zhao, Citation2006). In this study, based on aircraft observations, aerosol properties at heights approximately 300 m below the cloud base were taken as the aerosol background, and aerosol properties in clouds were calculated as the average value at 200 m above the cloud base, which is more objective because most cloud properties are more affected by aerosol particles near cloud bases than by those at the surface (Zhao et al., 2018).
Table 2. Statistical values of warm clouds and aerosols below and in clouds (height: m, Na: cm−3, Nc: cm−3, Dc: μm, LWC: g·m−3, STP).
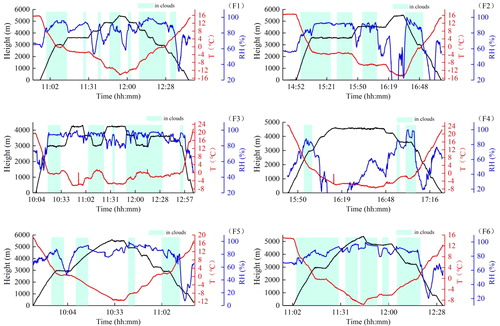
Flights were conducted across 5 days. Four flights were conducted in the morning, and two flights were conducted in the afternoon. All flights lasted for approximately 2–3 h. The six flights are labelled as F1 (20130508-1), F2 (20130508-2), F3 (20130523), F4 (20130525), F5 (20130526), and F6 (20130528), respectively. Most of the maximum flight heights were above 5000 m, except F3 and F4. The height of the 0 °C layer of the six flights ranged from 2890 to 3540 m. Three types of clouds were observed, including As in four flights, Cu in one flight, and Sc in one flight. Clouds with two or three layers were encountered in most flights, and cloud bases ranged from 978 to 2825 m. During the six flights, the maximum temperature (approximately 15 °C–25 °C) was observed near the ground. The temperature normally decreased with height, and the lowest temperature was below 0 °C. RH was normally relatively low when the aircraft was outside clouds, with the minimum value ranging from 16 to 66%, and the mean value ranging from 62 to 82%. When the aircraft entered clouds during the flight, RH was always higher with values greater than 90% due to the saturation of water vapour in clouds. shows the time series of the meteorological data (T and RH) with flight height from the six aircraft measurements, and the light green shades indicate in clouds data. The profiles of both aerosol and cloud properties were obtained from these aircraft observations.
Fig. 2. Time series of flight height (black line), T (red line), and RH (blue line) from the six aircraft measurements. (The light green shades indicate in clouds data.)
The aerosol number concentration (Na), cloud droplet number concentration (Nc), aerosol ED, and LWC are defined as follows:
(1)
(1)
(2)
(2)
(3)
(3)
(4)
(4)
where Nia is the aerosol number concentration of the ith bin in EquationEquation (1)
(1)
(1) , and Nic is the cloud droplet number concentration of the ith bin in EquationEquation (2)
(2)
(2) . Di is the diameter of the ith bin in EquationEquation (3)
(3)
(3) . The ri is the radius of the ith bin, and ρw is the water density in EquationEquation (4)
(4)
(4) .
3. Results and discussion
3.1. Statistical characteristics of aerosol particles and warm clouds
Aerosol particles are usually divided into groups or modes according to the particle size. Given that aerosol measurements were obtained from the PCASP, only particles with diameters of 0.1–3 μm could be detected. Thus, in this study, we discuss the total number concentration measured in the size range of 0.1 to 3 um (Na), the number concentrations of accumulation mode particles (Nacc, 0.1–1 μm) and coarse mode particles (1–3 μm). Statistical properties, including the maximum and minimum values (marked as Max. and Min.), median values (Md.), and 25 and 75 percentiles (25 Pct. and 75 Pct.) of aerosol particles in the six flights, are shown in , and shows the probability distribution function of Na.
Table 3. Statistical characteristics of aerosol particles (STP).
Fig. 3. The probability distribution function of Na and ED of aerosol particles from the six aircraft measurements.
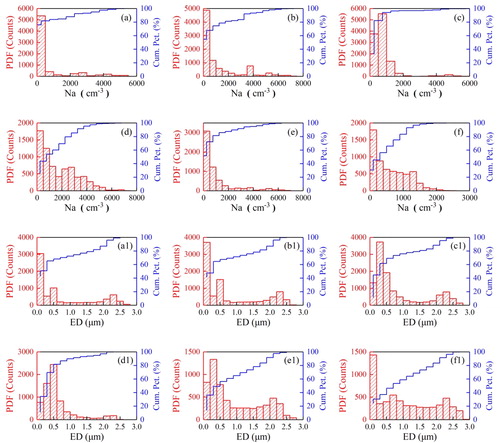
The highest number concentration of aerosol particles (Na) was observed on 23 May (F3), and the maximum Na reached 9745 cm−3. Although the maximum mean value of Na occurred on 25 May (F4), the mean Na reached 1749 cm−3 over the 2-h flight. The lowest value of Na was observed on 28 May (F6). The maximum and average Na values were 2518 cm−3 and 609 cm−3, respectively, during the flight. It rained slightly before the flight; thus, the precipitation wet removal effect on aerosol particles resulted in a relatively low Na on that day. The mean value of the maximum Na, the average value of Na, and the median value of Na over the six flights were 6962 cm−3, 1011 cm−3, and 564 cm−3, respectively. The mean and median values of Na of each flight showed relatively large differences, because only few large values of Na increased average Na values (). Nearly 80% of Na values were below 1500 cm−3, and the probability of obtaining high values of Na was small. Of the total aerosol particles measured from the six flights, accumulation mode particles dominated the majority (). The average value of maximum Nacc was 6924 cm−3, and the ratio of Nacc to Na ranged from 94.1% to 98.5% with an average value of 95.6%. Coarse mode particles were very few. Similar results were reported by Hao et al. (Citation2017) who reported that Nacc (ranging from 0.1 to 1.0 μm) accounted for more than 95% of Na (0.1–3 μm) during August 2014 over Anhui Province, east China. As shown in , most EDs of aerosol particles were less than 1 μm. In summary, the mean magnitude of Na over the observation area was 103 cm−3, the mean ED of aerosol particles over the six observation flights was 0.8 μm, and the average value of median ED was 0.5 μm. We compared these results with other aircraft measurements conducted in China, such as in Beijing (Zhang et al., Citation2006, Citation2009, Citation2011; Liu et al., Citation2009), Hebei (Sun et al., Citation2013), and Shanxi (Li et al., Citation2015a, Citation2015b), and found that the aerosol particle number concentration and particle size were comparable to the previous studies, but specific values differed due to different weather backgrounds, observation time periods, and locations.
shows the microphysical properties of warm clouds and aerosol particles below and in clouds. The cloud base height (AGL) from the six aircraft measurements ranged from 1000 to 2800 m, and the top of clouds ranged from 3000 to 3300 m. The total number of warm cloud data records was 2871 according to the cloud definition in this study. The value of Na in the cloud was always lower than that below the cloud, possibly reflecting the process of CCN activation. The aerosol activation ratio ([Na under cloud − Na in cloud]/Na under cloud) ranged from 0.14 to 0.91 with an average value of 0.46, suggesting that a high amount of aerosol particles were converted to cloud droplets under high humidity conditions in clouds. The maximum and average values of measured Nc ranged from 147 to 311 cm−3 and 51 to 157 cm−3, respectively. The maximum cloud droplet size ranged from 13.5 to 28.9 μm, and the average value ranged from 5.8 to 13.1 μm based on CDP measurements. The maximum LWC of warm clouds ranged from 0.06 to 0.53 g·m−3, and the average value of LWC was 0.05 g·m−3.
3.2. Vertical profiles of Na and ED of aerosol particles
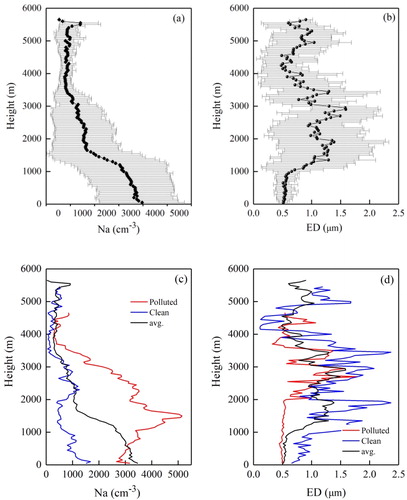
shows the mean vertical profiles of Na (a) and ED (b) and vertical profiles of Na (c) and ED (d) under relatively clean and polluted weather conditions, respectively, measured using the PCASP during the six flights. As shown in , large amounts of aerosol particles were constrained to the lower layer of the atmosphere (below 1000 m), and this amount decreased sharply with height, which might be attributed to the effects of the atmospheric boundary layer. The atmospheric boundary layer often hinders the vertical transmission and dispersion of aerosol and other pollutants. Large amounts of aerosol particles might be constrained below the boundary layer and formed an accumulation area. The maximum and average values of Na below 1500 m were approximately 3500 and 3000 cm−3 with an average standard deviation of 1700 cm−3. These results are considerably lower than the vertical profiles of aerosol particles obtained through aircraft observations in other regions, such as in Beijing from July to September 2008 (Zhang et al., Citation2011) (the average Na below 1 km was approximately 6600 cm−3). Furthermore, the results of this study are a little lower than those reported for September 2015 over Hebei Province (Zhao et al., 2018) and comparable to those reported for July and August 2013 in Shanxi (Li et al., Citation2015a, Citation2015b). In addition, the concentration of aerosol particles with sizes ranging from 10 nm to 0.1 μm could reach 104 cm−3 near the surface under clear sky conditions in the North China Plain (Wang et al., Citation2012; Zhang et al., Citation2014; Li et al., Citation2015a, Citation2017a). Above 1000 m, there was a sharp decrease in Na, and the average Na decreased to 1100 cm−3 at heights ranging from 1000 m to 3500 m. The average Na further decreased to approximately 400 cm−3 above the height of 3500 m. The vertical distribution of the particle size showed different features (). The EDs of particles were very small with an average value of 0.55 μm in the lower layer of the atmosphere, particularly below 1000 m, and the values gradually increased at heights ranging from 1000 to 3500 m and then decreased above the height of 3500 m. For example, the averaged ED was 1.0 and 0.7 μm at heights ranging from 1000 to 3500 m and from 3500 to 5500 m, respectively. The results of ED and Na vertical profiles suggested that the majority of aerosol particles within the lower layer (below 1000 m) were fine particles with ED less than 0.5 μm, indicating that aerosol particles mainly originated from local and regional surface emissions, which might include both direct emissions of particles and particles originate through gas-to-particle formation. Particles with ED larger than 0.5 μm were distributed at higher altitudes, suggesting that these particles were transported to the region from afar or because of the aging of aerosol particles. Furthermore, clouds present in the high layer may affect the particle size because of aerosol hygroscopicity under high humidity conditions. shows the vertical profiles of Na and ED under a relatively low and high aerosol loading conditions. Under polluted weather conditions (F4), Na was very high with a maximum value of 5000 cm−3 at a height of 1500 m. Under a relatively clean weather conditions (F6), Na was considerably lower, and even the maximum value of Na was less than 1700 cm−3. However, the vertical profiles of the particle size showed opposite properties. The ED of particles was considerably small under polluted weather conditions (F4) and relatively large under clean weather conditions (F6), indicating that fine particles contributed greatly to air pollution.
Fig. 4. Vertical profiles of averaged Na (a) and ED (b) with error bars (standard deviation), and the vertical profiles of Na (c), and ED (d) in relatively clean and polluted weather conditions.
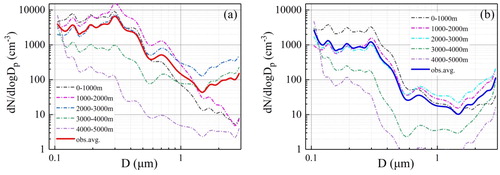
shows the size distributions of aerosol particles on relatively polluted (a) and clean (b) weather conditions. There were a lot of aerosol particles especially small particles on relatively polluted condition (). For example, the magnitude of Na with particle size less than 0.5 µm was above 103 cm−3, and the magnitude of Na with size from 0.5 to 1 µm is 102 cm−3. In addition, the particle number concentration was particularly large at low layer (below 3000 m height), and the peak value appeared at the particle size of 0.3 µm. In contrast, the Na was much lower on the relatively clean condition (), and most of particle concentration values were lower than 103 cm−3. The size distribution of aerosol particles also suggested that the large amount fine particles at low layer had a great impact on air pollution.
Fig. 5. Size distributions of aerosol particles on relatively polluted (a) and clean (b) weather conditions. The different coloured dashed lines are the average particle size distributions in different height ranges (0–1000 m, 1000–2000 m, 2000–3000 m, 3000–4000 m, 4000–5000 m), and the think solid red and blue lines show the average particle size distributions from the whole flights of F4 (a) and F6 (b), relatively.
3.3. Vertical and horizontal distribution of Na, Nc, and LWC
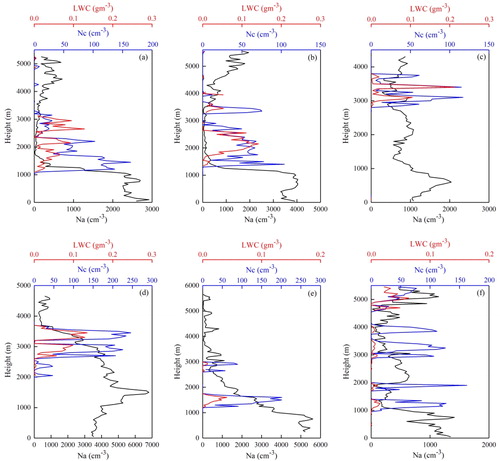
Data with cloud penetration during the aircraft ascent and descent periods of the six flights were selected to analyse the vertical structural characteristics of aerosols and clouds (). As shown in , when the aircraft passed through clouds, Na generally decreased significantly, and Na was negatively correlated with the number concentration of cloud particles (Nc), suggesting the process of aerosol activation in clouds. The LWC of clouds and Nc showed the same variation characteristics, and the large value area of LWC was generally located in the middle layer of clouds. Furthermore, the vertical distribution of aerosols and clouds indicated that aerosol concentrations were fairly well-mixed up to cloud levels from 1000 to 4000 m. Similarly, the ED of aerosols was fairly constant up to 1000 m and then increased in cloudy layers presumably due to aerosol hydration and hygroscopic growth (). The high aerosol number concentration could significantly affect cloud properties within the atmospheric boundary layer (, b, e, and f)). However, clouds with bases above the atmospheric boundary layer (approximately 900–1200 m over the time periods of the six flights) were less influenced by high aerosol concentrations near the ground surface (). Thus, it is better to choose aerosol data near the cloud base to study aerosol–cloud interactions (Zhao et al., 2018), and this is one of the advantages of the aircraft observation.
Fig. 6. Vertical distribution of Na, Nc, and LWC (a, b, and f were from the airplane ascent period and c, d, and e were from the descent period).
3.4. Horizontal distribution of Na, Nc, and LWC
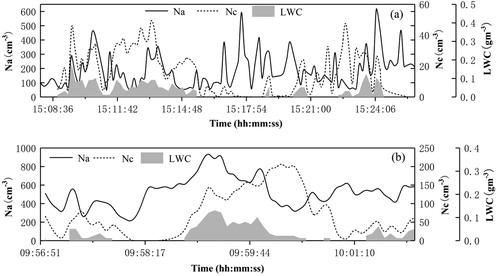
presents the Na, Nc, and LWC in two short time series, and the airplane was at a stable height in these two time segments. The Na, Nc, and LWC showed nonuniform characteristics in the horizontal direction. Similarly, when the aircraft started going into the clouds, Na normally decreased. When the aircraft flew through the cloud layer and out of clouds, Na usually showed an increaseding trend. During the period of cloud penetration, different features were observed at different locations of a cloud. Overall, Na and Nc showed a negative correlation through the whole time segments (). This phenomenon indicates that favourable humidity conditions in clouds are beneficial for the conversion process of aerosol particles to cloud droplets. The LWC of clouds and Nc showed the same variation in characteristics and a positive correlation.
Fig. 7. Horizontal distribution of Na, Nc, and LWC.
3.5. Cloud formation under different aerosol conditions
To analyse the cloud formation process under different weather conditions, two cases were selected in this study. One case was the flight observation on May 23, which was a less polluted case with a relatively low aerosol concentration (Case 1, F3, ). In this case, the average Na during the whole flight was 781 cm−3, and Na below the cloud base was 982 cm−3. The second case was the flight observation on May 25, which was a more polluted case with a high aerosol concentration (Case 2, F4, ). In this case, the average Na during the whole flight was approximately 1750 cm−3, and Na below the cloud base was 4573 cm−3.
Fig. 8. Relationships between Nc (a) and Dc (b) at different LWC ranges under low aerosol loading conditions.
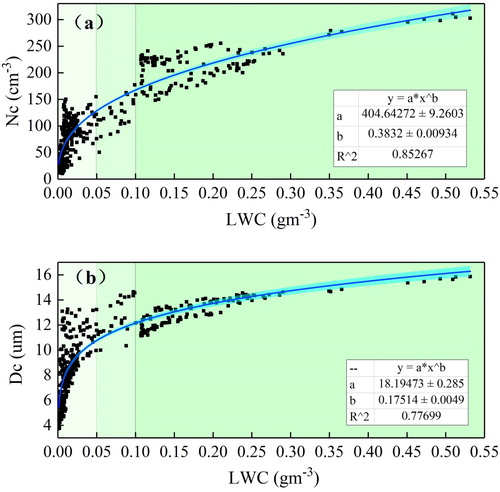
Fig. 9. Relationships between Nc (a) and Dc (b) at different LWC ranges under high aerosol loading conditions.
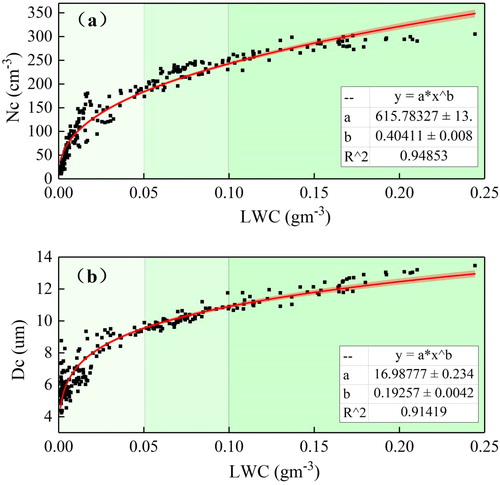
and show the relationship between Nc and Dc under different LWC conditions for the aforementioned two cases. The cloud droplet concentration (Nc) and the diameter of the cloud droplet increased with LWC, especially when LWC was higher than 0.1 g·m−3, based on these two cases. When the aerosol concentration was relatively low (Case 1), the magnitude of Nc increased from 101 cm−3 to 102 cm−3, and the minimum and maximum value of Nc were 11.4 cm−3 and 154 cm−3, respectively with LWC values ranging from 0 to 0.05 g·m−3. When LWC ranged from 0.1 to 0.5 g·m−3, the maximum value of Nc reached approximately 180 cm−3. When LWC was >0.1 g·m−3, the maximum Nc increased to 300 cm−3, but the majority were concentrated within 240 cm−3. LWC and Nc showed a good correlation with the correlation coefficient (r2) reaching 0.85 (). Meanwhile, with a certain number of cloud droplets, the increase in LWC led to an increase in the size of cloud droplets rather than in the number of cloud droplets. The size of cloud droplets increased rapidly as the value of LWC increased; Dc increased from 3.7 to 16 μm (the average Dc was 10.1 μm), and both LWC and Dc showed a good correlation, especially at a high LWC, with the correlation coefficient (r2) reaching 0.78 ().
When the amount of aerosol particles was considerably higher (Case 2), more particles could potentially be activated to become cloud droplets, and Nc in the three LWC ranges was larger than that in Case 1. When LWC ranged from 0 to 0.05 g·m−3, Nc increased to 200 cm−3. When LWC ranged from 0.05 to 0.1 g·m−3, the maximum value of Nc reached approximately 260 cm−3. The maximum Nc increased to more than 300 cm−3 when LWC was more than 0.1 g·m−3, and most of the Nc values were higher than 250 cm−3. Furthermore, Nc was strongly correlated to the abundance of LWC. For example, the correlation coefficient (r2) was 0.95 between LWC and Nc (), which is higher than the value obtained when the aerosol concentration was relatively low (Case 1). However, because a certain amount of liquid water was shared by many particles, the size of cloud droplets was limited. Therefore, many small cloud droplets were formed in clouds. For example, the size of cloud droplets in Case 2 increased slowly because of a high aerosol concentration with certain LWC (LWC ranges of <0.05, 0.05–0.1, and >0.1 g·m−3); Dc increased from 4.2 to 13 μm (the average Dc was 8.5) when the value of LWC increased. The Dc and LWC also showed a good correlation with the correlation coefficient (r2) being 0.91 ().
The results of both these cases indicate that background aerosol concentration can affect the formation of cloud droplets. The larger the number of aerosol particles, the more cloud droplets formed, and the cloud droplets sizes were smaller at a certain LWC range, which is consistent with Twomey theory (Twomey, Citation1977).
3.6. Nc and Dc under different LWC conditions
To investigate the relationship between Nc and Dc under different LWC conditions in detail, we calculated the mean values of Nc and Dc in three LWC ranges (˂0.05, 0.05–0.1, and >0.1 g·m−3) of each flight; the results are shown in and . At a certain range of LWC, if the cloud droplet number concentration was high, the droplet size was relatively small. Both of the two parameters showed negative correlations. We selected two cases from F1 and F2 on a same day, May 8 (data of each case was from one individual cloud), for analysis ().
Table 4. Mean values of Nc and Dc under different LWCs for each flight (Nc: cm−3, Dc: μm, LWC: g·m−3, STP).
Fig. 10. Two cases of Nc and Dc under three LWC ranges of <0.05, 0.05–0.1, and >0.1 g·m−3 in the same cloud system. (Case 1: a1, b1, and c1; Case 2: a2, b2, and c2).
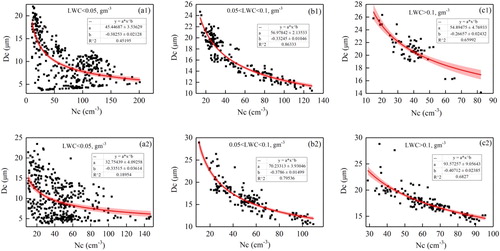
shows that the average cloud droplet diameters were strongly related to the values of LWC and strongly varied with the number of aerosol particles in the same cloud. Dc and Nc presented a negative correlation. Under certain LWC conditions, especially at a high LWC, Dc showed a negative exponential growth with a decline in Nc. Their correlation coefficient was approximately 0.8 at LWCs ranging from 0.05 to 0.1 g·m−3 and approximately 0.7 at LWCs larger than >0.1 g·m−3 in the two cases, respectively.
3.7. Number size distribution of cloud droplets in warm clouds
Cloud droplets have a variety of particle sizes. The distribution of the cloud droplet number concentration with different droplet sizes, called as the droplet spectral distribution, is an important physical quantity used to describe cloud droplet distribution features. Clouds in different atmospheric environments, different heights, and different stages of development have different spectral distributions. shows the cloud droplet size distributions of all detected clouds from the six flights (different coloured dashed lines), and the thick deep purple line shows the mean state of the cloud droplet size distribution. In this study, considering that many small cloud droplets were observed in the experiment, a multi-lognormal distribution function (EquationEquation 5(5)
(5) ) was used to fit the mean number size distribution of all measured cloud droplets of warm clouds.
(5)
(5)
where n is the number of modes per size distribution for the best fit, DP is the peak droplet diameter, Ni is the droplet number in mode i, Dg,i is the geometric mean diameter of the mode i, and
g,i is the standard deviation of mode i. The red and green lines in show the lognormal fits of the two modes to the mean cloud droplet spectrum, and parameters that characterise the number size distributions of the two modes are listed in . Normally, the cloud droplet spectrum showed one or two peaks. The first Nc peak was observed at the size of 4.56 µm in diameters for Mode I, and the second peak was observed at the size of 13.6 µm in diameters for Mode II. According to the two modal lognormal distribution fits, small droplets (Mode I) dominated the total cloud droplet number concentration, and a bimodal distribution best described the cloud droplet spectrum of warm clouds (the blue fit line in ). The fitting parameters can provide a scientific reference for the establishment and improvement of a cloud parametric numerical model.
Fig. 11. The cloud droplet size distributions of all detected clouds from six flights (the different coloured dashed lines are droplet size distributions from each cloud system, the thick deep purple line shows the mean state of the cloud droplet size distribution, and red and green lines show the lognormal fits of two modes to the mean cloud droplet spectrum).
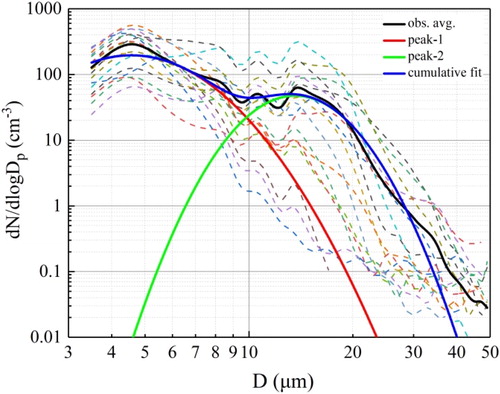
Table 5. Parameters characterising the number size distributions of warm cloud droplets (Nc: cm−3, Dg: μm).
4. Conclusions
Based on six flights measurements of aerosol and clouds during a spring aircraft campaign over the eastern Loess Plateau of China, this study analysed the aerosol and cloud droplet distribution characteristics and the relationship between aerosol loading and microphysical properties of warm clouds.
The mean magnitude of the measured aerosol number concentration was 103 cm−3 (1011 cm−3), and accumulation mode particles dominated. Most ED of aerosol particles was less than 1 μm, with a mean value of 0.8 μm. The vertical profiles of Na and ED showed that large amounts of fine aerosol particles were constrained to the lower layer (below 1000 m) with particle EDs less than 0.5 μm. Clear differences were demonstrated though a detailed analysis on the Na and ED vertical profiles and the aerosol particles size distribution on relatively clean and polluted weather conditions. The aerosol particle size distributions further showed that more particles concentrated within smaller size ranges under polluted weather condition. The results indicated that fine particles at the lower layer contributed greatly to air pollution.
Eighteen cloud detections with 2871 warm cloud data records during the observation period were analysed, and aerosol–cloud interactions in different weather backgrounds were discussed. The statistical properties of cloud droplets number concentration and effective radius were showed in this study, which were two critical parameters in calculating cloud albedo and estimating the direct effects of clouds. The Na values in the cloud base were always smaller than that below the clouds, and the average aerosol activation ratio was 0.46. The vertical and horizontal distribution of Na, Nc, and LWC indicated Na was normally negatively correlated with Nc either in the vertical or horizontal direction. The LWC of clouds and Nc showed a positive correlation, and the large value distribution area of LWC was generally located in the middle part of clouds in the vertical direction.
Two cases were selected to analyse the cloud formation process under different aerosol concentration conditions. Under high aerosol loading conditions, a large number of small cloud droplets were formed in clouds. By contrast, under low aerosol loading conditions, a relatively small number of cloud droplets were formed with larger size. The relationship between LWC and aerosol particles/cloud droplets was studied. The increase in LWC was related to an increase in the size of cloud droplets rather than the number of cloud droplets. At a certain range of LWC, Dc presented a negative exponential growth with a decline in Nc. The results indicate that the number of aerosol particles has important impacts on microphysical characters of clouds. And the LWC in clouds is also an important factor when discussing the aerosol–cloud interaction, which closely correlated to the average size of cloud droplets.
The cloud droplet size distributions of all detected warm clouds from the six flights were obtained, and a bimodal lognormal distribution function was used to fit the average cloud droplet spectrum. Furthermore, the characteristic parameters of warm clouds were reported in this study. The parameters are required in studying the radiation transfer and the microphysical processes, and also can provide real observation results for the cloud parameterization in numerical simulation.
Disclosure statement
No potential conflict of interest was reported by the authors.
Additional information
Funding
References
- Andreae, M. O. and Rosenfeld, D. 2008. Aerosol–cloud–precipitation interactions. Part 1. The nature and sources of cloud-active aerosols. Earth Sci. Rev. 89, 13–41. doi: 10.1016/j.earscirev.2008.03.001
- Bahreini, R., Jimenez, J. L., Wang, J. co-authors 2003. Aircraft-based aerosol size and composition measurements during ACE-Asia using an Aerodyne aerosol mass spectrometer. J. Geophys. Res. 108, 1191–1198.
- Cai, Y., Snider, J. R. and Wechsler, P. 2013. Calibration of the passive cavity aerosol spectrometer probe for airborne determination of the size distribution. Atmos. Meas. Tech. 6, 2349–2358. doi: 10.5194/amt-6-2349-2013
- Calvo, A. I., Alves, C., Castro, A. co-authors 2013. Research on aerosol sources and chemical composition: past, current and emerging issues. Atmos. Res. 120–121, 1–28. doi: 10.1016/j.atmosres.2012.09.021
- Campbell, J. R., Reid, J. S., Westphal, D. L., Zhang, J., Tackett, J. L. co-authors. 2013. Characterizing the vertical profile of aerosol particle extinction and linear depolarization over Southeast Asia and the Maritime Continent: the 2007–2009 view from CALIOP. Atmos. Res. 122, 520–543. doi: 10.1016/j.atmosres.2012.05.007
- Deng, Z., Zhao, C., Zhang, Q., Huang, M. and Ma, X. 2009. Statistical analysis of microphysical properties and the parameterization of effective radius of warm clouds in Beijing area. Atmos. Res. 93, 888–896. doi: 10.1016/j.atmosres.2009.04.011
- Duan, J., Chen, Y. and Guo, X. L. 2012. Characteristics of aerosol activation efficiency and aerosol and CCN vertical distributions in North China. Acta Meteorol. Sin. 26, 579–596. doi: 10.1007/s13351-012-0504-6
- Fan, J., Leung, L. R., Li, Z., Morrison, H., Chen, H. co-authors. 2012. Aerosol impacts on clouds and precipitation in eastern China: results from bin and bulk microphysics. J. Geophys. Res. 117. doi:10.1029/2011JD016537.
- Fan, T., Zhao, C., Dong, X., Liu, X., Yang, X. co-authors. 2018. Quantify contribution of aerosol errors to cloud fraction biases in CMIP5 AMIP simulations. Int. J. Climatol. 38, 3140., doi: 10.1002/joc.5490
- Garrett, T. J. and Zhao, C. 2006. Increased Arctic cloud longwave emissivity associated with pollution from mid-latitudes. Nature 440, 787–789. doi:10.1038/nature04636 doi: 10.1038/nature04636
- Garrett, T. J., Zhao, C., Dong, X. co-authors 2004. Effects of long-range pollution transport on North American Arctic stratus. Geophys. Res. Lett. 31, L17105. doi:10.1029/2004GL019928
- Grützun, V., Knoth, O. and Simmel, M. 2008. Simulation of the influence of aerosol particle characteristics on clouds and precipitation with LM-SPECS: model description and first results. Atmos. Res. 90, 233–242. doi: 10.1016/j.atmosres.2008.03.002
- Gultepe, I. and Isaac, G. A. 2004. Aircraft observations of cloud droplet number concentration: implications for climate studies. Q. J. R. Meteorol. Soc. 130, 2377–2390. doi: 10.1256/qj.03.120
- Gultepe, I., Isaac, G. A., Leaitch, W. R. and Banic, C. M. 1996. Parameterization of marine stratus microphysics based on in situ observations: implications for GCMs. J. Climate 9, 345–357. doi: 10.1175/1520-0442(1996)009<0345:POMSMB>2.0.CO;2
- Han, Z., Montague, D. C. and Snider, J. R. 2003. Airborne measurements of aerosol extinction in the lower and middle troposphere over Wyoming, USA. Atmos. Environ. 37, 789–802. doi: 10.1016/S1352-2310(02)00952-4
- Hao, J., Yin, Y., Kuang, X., Chen, J., Yuan, L. co-authors. 2017. Aircraft measurements of the aerosol spatial distribution and relation with clouds over Eastern China. Aerosol Air Qual. Res. 17, 3230–3243. doi: 10.4209/aaqr.2016.12.0576
- Haywood, J. M. and Boucher, O. 2000. Estimates of the direct and indirect radiative forcing due to tropospheric aerosols: a review. Rev. Geophys. 38, 513–543. doi: 10.1029/1999RG000078
- Haywood, J., Francis, P., Dubovik, O., Glew, M., Holben, B. co-authors. 2003. Comparison of aerosol size distributions, radiative properties, and optical depths determined by aircraft observations and Sun photometers during SAFARI 2000. J. Geophys. Res. 108. doi:10.1029/2002JD002250.
- Hudson, J. G., Jha, V. and Noble, S. 2011. Drizzle correlations with giant nuclei. Geophys. Res. Lett. 38. doi:10.1029/2010GL046207.
- Hudson, J. G. and Noble, S. 2014a. CCN and vertical velocity influences on droplet concentrations and supersaturations in clean and polluted stratus clouds. J. Atmos. Sci. 71, 312–331. doi:10.1175/JAS-D-13-086.1. doi: 10.1175/JAS-D-13-086.1
- Hudson, J. G. and Noble, S. 2014b. Low altitude summer/winter microphysics, dynamics and CCN spectra of northeastern Caribbean small cumuli; and comparisons with stratus. J. Geophys. Res. Atmos. 119, 5445. doi:10.1002/2013JD021442. doi: 10.1002/2013JD021442
- IPCC 2007. Climate Change 2007: The Physical Science Basis. Cambridge University Press, Cambridge, UK.
- IPCC. Climate Change 2013: The Physical Science Basis. Contribution of Working Group I to the Fifth Assessment Report of the Intergovernmental Panel on Climate Change. Cambridge University Press, Cambridge, UK.
- Junkermann, W. and Hacker, J. M. 2015. Ultrafine particles over Eastern Australia: an airborne survey. Tellus B Chem. Phys. Meteorol. 67, 25308. doi: 10.3402/tellusb.v67.25308
- Lance, S. 2012. Coincidence errors in a cloud droplet probe (CDP) and a cloud and aerosol spectrometer (CAS), and the improved performance of a modified CDP. J. Atmos. Oceanic Technol. 29, 1532–1542. doi: 10.1175/JTECH-D-11-00208.1
- Li, Z., Li, C., Chen, H. co-authors 2011a. East Asian studies of tropospheric aerosols and their impact on regional climate (EAST-AIRC): an overview. J. Geophys. Res. 116, D00K34. doi:10.1029/2010JD015257.
- Li, W., Li, P., Sun, G., Zhou, S., Yuan, Q. co-authors. 2011b. Cloud residues and interstitial aerosols from non-precipitating clouds over an industrial and urban area in northern China. Atmos. Environ. 45, 2488–2495. doi: 10.1016/j.atmosenv.2011.02.044
- Li, J., Liu, X., Yuan, L., Yin, Y., Li, Z. co-authors. 2015a. Vertical distribution of aerosol optical properties based on aircraft measurements over the Loess Plateau in China. J. Environ. Sci. 34, 44–56. doi: 10.1016/j.jes.2015.01.021
- Li, J., Li, P., Yuan, L., Yin, Y., Wang, Z. co-authors. 2017a. Physical and optical properties of atmospheric aerosols in summer at a suburban site in North China. Aerosol Air Qual. Res. 17, 1388–1474. doi: 10.4209/aaqr.2016.12.0525
- Li, Z., Niu, F., Fan, J., Liu, Y., Rosenfeld, D. co-authors. 2011. Long-term impacts of aerosols on the vertical development of clouds and precipitation. Nat. Geosci. 4, 888–894. doi: 10.1038/ngeo1313
- Li, W., Shi, Z., Zhang, D. co-authors 2012. Haze particles over a coal-burning region in the China Loess Plateau in winter: Three flight missions in December 2010. J. Geophys. Res. 117, D12306.
- Liu, P., Zhao, C., Liu, P., Deng, Z., Huang, M. co-authors. 2009. Aircraft study of aerosol vertical distributions over Beijing and their optical properties. Tellus 61, 756–767. doi: 10.1111/j.1600-0889.2009.00440.x
- Li, J., Yin, Y., Li, P., Li, Z., Li, R. co-authors. 2015b. Aircraft measurements of the vertical distribution and activation property of aerosol particles over the Loess Plateau in China. Atmos. Res. 155, 73–86. doi: 10.1016/j.atmosres.2014.12.004
- Li, Y., Zhang, F., Li, Z., Sun, L., Wang, Z. co-authors. 2017. Influences of aerosol physiochemical properties and new particle formation on CCN activity from observation at a suburban site of China. Atmos. Res. 188, 80–89. doi: 10.1016/j.atmosres.2017.01.009
- Lohmann, U. and Feichter, J. 2005. Global indirect aerosol effects: a review. Atmos. Chem. Phys. 5, 715–737. doi: 10.5194/acp-5-715-2005
- Ma, X. and Yu, F. 2014. Seasonal variability of aerosol vertical profiles over east US and west Europe: GEOS-Chem/APM simulation and comparison with CALIPSO observations. Atmos. Res. 140–141, 28–37. doi: 10.1016/j.atmosres.2014.01.001
- Pace, G., Junkermann, W., Vitali, L., Di Sarra, A., Meloni, D. co-authors. 2015. On the complexity of the boundary layer structure and aerosol vertical distribution in the coastal Mediterranean regions: a case study. Tellus B: Chem. Phys. Meteorol. 67, 27721. doi: 10.3402/tellusb.v67.27721
- Qiu, Y., Zhao, C., Guo, J. and Li, J. 2017. 8-Year ground-based observational analysis about the seasonal variation of the aerosol-cloud droplet effective radius relationship at SGP site. Atmos. Environ. 164, 139–146. doi: 10.1016/j.atmosenv.2017.06.002
- Rangno, A. L. and Hobbs, P. V. 2005. Microstructures and precipitation development in cumulus and small cumulonimbus clouds over the warm pool of the tropical Pacific Ocean. Q. J. R. Meteorol. Soc. 131, 639–e673. doi: 10.1256/qj.04.13
- Stith, J. L., Haggerty, J., Grainger, C. and Detwiler, A. 2006. A comparison of the microphysical and kinematic characteristics of mid-latitude and tropical convective updrafts and downdrafts. Atmos. Res. 82, 350–366. doi: 10.1016/j.atmosres.2005.12.008
- Sun, X., Yin, Y., Sun, Y., Sun, Y., Liu, W. co-authors. 2013. Seasonal and vertical variations in aerosol distribution over Shijiazhuang, China. Atmos. Environ. 81, 245–252. doi: 10.1016/j.atmosenv.2013.08.009
- Tao, W.-K., Chen, J.-P., Li, Z., Wang, C. and Zhang, C. 2012. Impact of aerosols on convective clouds and precipitation. Rev. Geophys. 50, RG2001. doi:10.1029/2011RG000369.
- Twomey, S. 1977. The influence of pollution on the shortwave albedo of clouds. J. Atmos. Sci. 34, 1149–1152. doi: 10.1175/1520-0469(1977)034<1149:TIOPOT>2.0.CO;2
- Wang, Z., French, J., Vali, G., Wechsler, P., Haimov, S. co-authors. 2012. Single aircraft integration of remote sensing and in situ sampling for the study of cloud microphysics and dynamics. Bull. Am. Meteor. Soc. 93, 653–668. doi:10.1175/BAMS-D-11-00044.1. doi: 10.1175/BAMS-D-11-00044.1
- Welton, E. J., Voss, K. J., Quinn, P. K. co-authors 2002. Measurements of aerosol vertical profiles and optical properties during INDOEX 1999 using micropulse lidars. J. Geophys. Res. 107, 8019. doi:10.1029/2000JD000038. doi: 10.1029/2000JD000038
- Yang, X., Zhao, C., Guo, J. and Wang, Y. 2016a. Intensification of aerosol pollution associated with its feedback with surface solar radiation and winds in Beijing. J. Geophys. Res. Atmos. 121, 4093–4099. doi: 10.1002/2015JD024645
- Yang, X., Zhao, C., Zhou, L., Wang, Y. and Liu, X. 2016b. Distinct impact of different types of aerosols on surface solar radiation in China. J. Geophys. Res. Atmos. 121, 6459–6471. doi: 10.1002/2016JD024938
- Yin, Y., Duan, Y., Zhang, Y., Shi, L., Yang, Z. co-authors 2009. Airborne measurements of the spatial and spectral distributions of aerosol particles over Hebei area, northern China. Proc. SPIE 7490, 74900X1–74900X8.
- Yin, Y., Levin, Z., Reisin, T. G. and Tzivion, S. 2000. The effects of giant cloud condensation nuclei on the development of precipitation in convective clouds-a numerical study. Atmos. Res. 53, 91–116. doi: 10.1016/S0169-8095(99)00046-0
- Yin, Y., Wurzler, S., Levin, Z. and Reisin, T. G. 2002. Interactions of mineral dust particles and clouds: effects on precipitation and cloud optical properties. J. Geophys. Res. 107, 4724. doi:10.1029/2001JD001544.
- Yuan, T., Li, Z., Zhang, R. and Fan, J. 2008. Increase of cloud droplet size with aerosol optical depth: An observation and modeling study. J. Geophys. Res. 113, D04201. doi:10.1029/2007JD008632.
- Yuan, L., Yin, Y., Xiao, H., Yu, X., Hao, J. co-authors. 2016. A closure study of aerosol optical properties at a regional background mountainous site in Eastern China. Sci. Total Environ. 550, 950–960. doi: 10.1016/j.scitotenv.2016.01.205
- Zhang, F., Li, Y., Li, Z., Sun, L., Li, R. co-authors. 2014. Aerosol hygroscopicity and cloud condensation nuclei activity during the AC3Exp campaign: Implications for cloud condensation nuclei parameterization. Atmos. Chem. Phys. 14, 13423–13437. doi:10.5194/acp-14-13423-2014. doi: 10.5194/acp-14-13423-2014
- Zhang, Q., Ma, X., Tie, X., Huang, M., Zhao, C. co-authors. 2009. Vertical distributions of aerosols under different weather conditions: analysis of in-situ aircraft measurements in Beijing, China. Atmos. Environ. 43, 5526–5535. doi: 10.1016/j.atmosenv.2009.05.037
- Zhang, Q., Quan, J., Tie, X., Huang, M. and Ma, X. 2011. Impact of aerosol particles on cloud formation: aircraft measurements in China. Atmos. Environ. 45, 665–672. doi: 10.1016/j.atmosenv.2010.10.025
- Zhang, Q., Zhao, C., Tie, X., Wei, Q., Huang, M. co-authors. 2006. Characterizations of aerosols over the Beijing region: a case study of aircraft measurements. Atmos. Environ. 40, 4513–4527. doi: 10.1016/j.atmosenv.2006.04.032
- Zhao, C. and Garrett, T. 2015. Effects of Arctic haze on surface cloud radiative forcing. Geophys. Res. Lett. 42, 557. doi: 10.1002/2014GL062015
- Zhao, C., Klein, S. A., Xie, S., Liu, X., Boyle, J. S. co-authors. 2012. Aerosol first indirect effects on non-precipitating low-level liquid cloud properties as simulated by CAM5 at ARM sites. Geophys. Res. Lett. 39.
- Zhao, C., Lin, Y., Wu, F., Wang, Y., Li, Z. co-authors. 2018a. Enlarging rainfall area of tropical cyclones by atmospheric aerosols. Geophys. Res. Lett. 45, 8604. doi:10.1029/2018GL079427. doi: 10.1029/2018GL079427
- Zhao, C., Qiu, Y., Dong, X., Wang, Z., Peng, Y. co-authors. 2018b. Negative aerosol-cloud re relationship from aircraft observations over Hebei. China Earth Space Sci. 5, 19–29. doi:10.1002/2017EA000346. doi: 10.1002/2017EA000346
- Zhao, C., Tie, X. and Lin, Y. 2006. A possible positive feedback of reduction of precipitation and increase in aerosols over eastern central China. Geophys. Res. Lett. 33, 11814.
- Zhao, P., Yin, Y. and Xiao, H. 2015. The effects of aerosol on development of thunderstorm electrification: a numerical study. Atmos. Res. 153, 376–391. doi: 10.1016/j.atmosres.2014.09.011
- Zhao, P., Zhou, Y., Xiao, H., Liu, J., Gao, J. co-authors. 2017. Total lightning flash activity response to aerosol over China area. Atmosphere 8, 26. doi: 10.3390/atmos8020026