
 ?Mathematical formulae have been encoded as MathML and are displayed in this HTML version using MathJax in order to improve their display. Uncheck the box to turn MathJax off. This feature requires Javascript. Click on a formula to zoom.
Abstract
Deep convective clouds can transport trace gases from the planetary boundary layer into the upper troposphere where subsequent chemistry may impact aerosol particle formation and growth. In this modelling study, we investigate processes that affect isoprene and its oxidation products injected into the upper troposphere by an isolated deep convective cloud in the Amazon. We run a photochemical box model with coupled cloud microphysics along hundreds of individual air parcel trajectories sampled from a cloud-resolving model simulation of a convective event. The box model simulates gas-phase chemical reactions, gas scavenging by liquid and ice hydrometeors, and turbulent dilution inside a deep convective cloud. The results illustrate the potential importance of gas uptake to anvil ice in regulating the intensity of the isoprene oxidation and associated low volatility organic vapour concentrations in the outflow. Isoprene transport and fate also depends on the abundance of lightning-generated nitrogen oxide radicals (NOx = NO + NO2). If gas uptake on ice is efficient and lightning activity is low, around 30% of the boundary layer isoprene will survive to the cloud outflow after approximately one hour of transport, while all the low volatile oxidation products will be scavenged by the cloud hydrometeors. If lightning NOx is abundant and gas uptake by ice is inefficient, then all isoprene will be oxidised during transport or in the immediate outflow region, while several low volatility isoprene oxidation products will have elevated concentrations in the cloud outflow. Reducing uncertainties associated with the uptake of vapours on ice hydrometeors, especially HO2 and oxygenated organics, is essential to improve predictions of isoprene and its oxidation products in deep convective outflows and their potential contribution to new particle formation and growth.
1. Introduction
Atmospheric aerosol particles affect the radiative budget of the Earth by absorbing and scattering solar radiation, and by affecting the lifetime and optical properties of clouds. The complex sources and transformations of aerosol particles and their convoluted impacts on clouds result in a significant uncertainty in climate change predictions (Boucher et al., Citation2013). A large fraction of aerosol particles that serve as cloud condensation nuclei (CCN) are formed from nucleation of precursor gases and subsequent growth by condensation of low volatility vapours (Merikanto et al., Citation2009). New particle formation (NPF) and growth are complex processes, involving multiple precursor gases and requiring specific thermodynamic conditions. Newly formed aerosol particles, identified by having sizes in lower tens of nm, have consistently been observed from aircraft in the upper troposphere in concentrations of up to cm3, exceeding the corresponding concentrations in the planetary boundary layer (Clarke et al., Citation1999; Twohy et al., Citation2002; Krejci et al., Citation2003; Weigel et al., Citation2011; Andreae et al., Citation2018; Williamson et al., Citation2019). These studies strongly suggested that the main source of such ultra-fine particles in the upper troposphere is in situ formation rather then their direct transport from the boundary layer.
Elevated upper tropospheric concentrations of ulfra-fine particles are common in the tropics and subtropics, in particular over the Amazon (see e. g. Clarke et al., Citation1999; Krejci et al., Citation2003; Andreae et al., Citation2018). Composition analysis of the aerosols retrieved over the Amazon has revealed that they predominantly consist of organic matter associated with compounds naturally produced and emitted by terrestrial vegetation (Andreae et al., Citation2018). Terpenes, including isoprene, monoterpenes, and sesquiterpenes, have received significant attention as possible contributors to aerosol formation and growth (Hoffmann et al., Citation1997; Claeys et al., Citation2004; Schobesberger et al., Citation2013; McFiggans et al., Citation2019). These reactive biogenic organic gases can be transported from the boundary layer into the upper troposphere by deep convective clouds, which are abundant in the Amazon region, thereby forming a potentially globally important natural supply of CCN. An early modelling study by Ekman et al. (Citation2008) emphasised the importance of convective transport of organic species for new particle formation over this region and suggested that it is necessary to add organic compounds, such as isoprene (C5H8), into the deep convective outflow in order to reproduce the observed concentrations of newly formed aerosols. Later, e.g. Murphy et al. (Citation2015) and Zhao et al. (Citation2020) showed that inclusion of organic gases with corresponding chemical processing leads to a significant increase of in-cloud production of aerosol particles compared to systems where nucleation is based only on inorganic compounds. Wagner et al. (Citation2015), during the SENEX and SEAC4RS campaigns, also observed an enhancement of biogenic SOA loading in the lower layers of the troposphere after cloud processing. Monoterpenes are now known to contribute significantly to particle formation and growth in boreal environment boundary layer (Mohr et al., Citation2017; Olenius et al., Citation2018), and the potential contribution of their atmospheric oxidation products could be also favourable at the high altitudes and cold conditions associated with regions of tropical deep convective cloud outflow (Kirkby et al., Citation2016).
With global biogenic emissions of Tg yr–1 (Guenther et al., Citation2006) and a yield of secondary organic aerosols (SOA) from isoprene photooxidation of 1-3% (Kroll et al., Citation2005, Citation2006), isoprene oxidation has the potential to contribute significantly to the aerosol burden; especially in the Amazon, where high concentrations of isoprene in the boundary layer were measured both in situ (e.g. Warneke et al., Citation2001) as well as recently estimated from satellite observations by Fu et al. (Citation2019). However, the process of isoprene oxidation is complex; product distributions and fates remain uncertain, especially in the context of transport through convective clouds and the chemistry occurring in the cloud outflow where oxidation product scavenging by cloud hydrometeors is likely important, but poorly quantified. Globally averaged, the daytime oxidation of isoprene is initiated mainly via reaction with OH, with small contributions from ozone (Calvert et al., Citation2008). At night, oxidation of isoprene is usually dominated by the nitrate radical (NO3). The potential for isoprene oxidation to produce condensable vapours depends upon both chemical and meteorological conditions. The volatility distribution of products formed during the radical-driven photo-oxidation is influenced by the concentration of nitrogen oxides (NOx = NO + NO2) and temperature given its impact on unimolecular reaction rates of intermediate organic peroxy radicals (RO2). Deep convection is often associated with lightning, which is a major source of nitric oxide (NO). During the TROCCINOX field campaign in the Amazon, average concentrations of NOx of 0.2-1.6 ppb were measured in the anvils of convective storms (Huntrieser et al., Citation2007). After extensive lightning events in the deep convective clouds, however, mixing ratios of NO in the upper portion of the cloud as well as the outflow can easily reach up to 3 ppb (Pollack et al., Citation2016), which could significantly alter isoprene oxidation pathways compared to the tropospheric background. Moreover, some products of gas-phase isoprene oxidation are reactive in acidic aqueous solutions typical of aerosol particles (Ervens et al., Citation2011), and can form low-volatility products which add to aerosol mass as a result. Laboratory studies have shown strong changes in isoprene SOA yields in the presence or absence of NOx and acidic aqueous aerosol, and with RO2 unimolecular reactions being relatively important (Paulot et al., Citation2009b; Surratt et al., Citation2010; D'Ambro et al., Citation2017; Wennberg et al., Citation2018; Thornton et al., Citation2020)
Another important process affecting the distribution of the gases during transport is the efficiency of gas uptake by ice particles. The process has been studied both theoretically (Kärcher and Basko, Citation2004; Marécal et al., Citation2010) and experimentally (Abbatt, Citation1997; Sokolov and Abbatt, Citation2002; Ullerstam et al., Citation2005; Abbatt et al., Citation2008) with the conclusion that a range of trace gases such as strong acids, weak acids, and polar organics can be adsorbed to the liquid-like surface layer of the ice particle. However, uptake by ice and retention of the dissolved species during freezing of droplets still remains uncertain for many organic gases (Hallquist et al., Citation2009; Bartels-Rausch et al., Citation2014), especially in a context of multiple species undergoing competitive adsorption. The reaction pathways of trace gases and in particular isoprene at low temperature and high NOx, and the fate of the isoprene oxidation products in the presence of anvil ice, are thus important to understand if we want to quantify the potential of isoprene oxidation to contribute to NPF in deep convective outflow.
The dynamic nature and vertical extent of deep convection makes in situ observations of associated composition changes challenging except partially by instrumented aircraft (Apel et al., Citation2012; Barth et al., Citation2015). Moreover, even though comprehensive mechanisms of isoprene gas-phase photo-oxidation have been developed, they are rarely applied to cloud-scale models. Theoretical studies of convective transport of trace gases are usually done using numerical models with different level of complexity, ranging from idealised box models to comprehensive Cloud Resolving Models (CRMs). In the box models, many processes such as precipitation removal of gas condensed onto droplets and mixing with air outside the box are neglected and only the some essential processes are kept. For instance, the box model developed by Barth et al. (Citation2003, Citation2016) included detailed chemical processing of CH3OOH and H2O2 within the cloud but the model showed elevated concentration of CH3OOH in the cloud outflow presumably due to a lack of precipitational removal. Convective transport of trace gases has also been extensively studied using CRMs, either using interactive chemical mechanisms directly embedded in the models or using dynamical output from the models (e.g. Wang and Chang, Citation1993; Grell et al., Citation2005; Barth et al., Citation2007; Ekman et al., Citation2008; Kim et al., Citation2012; Murphy et al., Citation2015). Interactive CRMs are powerful tools as they allow a direct connection between the chemical kinetics and the dynamical and microphysical core of the system. This means that dilution due to turbulence as well as soluble gas removal by precipitation is explicitly accounted for. The drawback of this approach is the excessive complexity, which makes it difficult to disentangle all the processes of the system.
In this study, we use and further develop the trajectory framework described in Bardakov et al. (Citation2020) to study the processes governing the impact of deep convective clouds on isoprene and its oxidation products over the Amazon during the rainy season. Our approach is to couple trajectories extracted from a CRM with a box model that captures all the essential interactions of the gases in the cloud environment, e.g. mixing with out-of-cloud air and chemical reactions between multiple gases. In particular, we investigate the relative roles of gas-phase chemistry, scavenging by hydrometeors and turbulent mixing in defining the concentrations of the 33 studied trace gas species during the ascent and in the cloud outflow. To yield further insights into the key sensitivities of the system, we also assess the roles of including a NO source from lightning and gas uptake by cloud ice in defining the evolution of isoprene and OH concentrations. Furthermore, we evaluate the representativeness of our results by simulating three different convective clouds and by calculating the fraction of gases transported to different heights for all three cases. Finally, we discuss the implications of the results for atmospheric chemistry and potential aerosol formation inside the cloud and within the cloud outflow.
2. Method
The large-eddy simulation/CRM code MIMICA (Savre et al., Citation2014) was used to simulate isolated deep convective clouds by solving a set of anelastic, nonhydrostatic, and thermodynamic governing equations in three dimensions for the wind components and potential temperature. The microphysics scheme applied in MIMICA is based on Grabowski (Citation1998) where two types of hydrometeors are considered: condensate particles (that follow the flow within the cloud) and precipitation particles (that are heavy enough to fall out of the cloud). The two types of hydrometeors are further divided into liquid (for temperatures of 273.15 K and higher) and ice (for temperatures of 253.15 K and lower). Between 253.15 and 273.15 K, the phase of the hydrometeors is mixed. Turbulence is parameterised following the Smagorinski-Lilly approach (Lilly, Citation1962; Smagorinsky, Citation1963). The trajectories extracted from MIMICA contain all the necessary information to calculate gas condensation/evaporation to/from cloud hydrometeors as well as reactions of gases with each other, namely: the number and sizes of the hydrometeors, temperature, pressure, and turbulent diffusivity (that allows to estimate the level of mixing of the parcel with the out-of-cloud air). All these data are then incorporated into a standalone python code simulating the gas-phase transport, scavenging by hydrometeors, and associated chemical reactions.
2.1. Cloud Resolving model (CRM) set-up
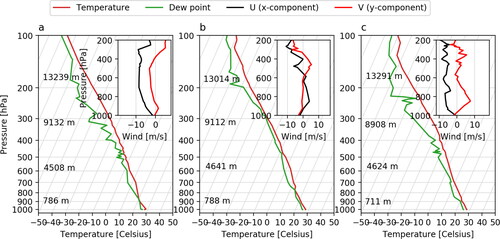
We used MIMICA to simulate three independent deep convective cloud cases with slightly different cloud dynamical and microphysical properties. Atmospheric soundings selected from the University of Wyoming sounding data archive (http://weather.uwyo.edu/upperair/sounding.html) were used to initialise the model. shows diagrams for the used profiles retrieved in Manaus, Brazil on April 8, 2020, April 23, 2020 and April 27, 2020 at 00 UTC time (20:00 local time). The selection of soundings was based on the value of convective available potential energy (CAPE) for all profiles retrieved during the rainy season in Manaus in April, 2020 at 00 UTC. The lower limit for CAPE was set to 2000 J kg–1 to guarantee strong enough convection for the cloud tops to reach higher layers of the upper troposphere. The chosen dates had CAPE values of 2086, 2401 and 2121 J kg–1, respectively. Since the thermodynamic properties of the atmospheric profiles were similar to each other we have randomly chosen the sounding from April 23, 2020 to serve as the reference.
Fig. 1. SkewT-logP and wind diagrams for the atmospheric soundings retrieved in Manaus, Brazil on April 8 (a), 2020, April 23, 2020 (b) and April 27, 2020 (c).
We used a grid consisting of 512 points in the two horizontal directions and 200 points in the vertical direction. The horizontal domain size was 200 km in both directions, and the vertical domain extent was 20 km. This results in a grid spacing between the nearest points equal to 390.6 m in the horizontal direction and 100 m in the vertical direction of the domain. At the left and right boundaries, we assigned periodic conditions, while at the top and bottom boundaries a no-flow condition was used. A damping layer was applied between 15 and 20 km.
Convection was triggered by a ‘bubble’ temperature perturbation that had the shape of an ellipsoid with a horizontal radius of 20 km and a maximum temperature located in its center, varied as a cosine squared towards the edges. The center of the bubble was located at km distance above the surface, x = 100 km and y = 100 km. The system was integrated for 7000s (
2 hours), allowing enough time for all air parcels to rise vertically to the maximum possible height and to be advected within the domain. This also ensures enough time to make necessary inferences about gas diffusion and chemical interactions in terms of gas transport to the upper troposphere. The initial positions of the 400 simulated air parcels were located inside the thermally perturbed bubble homogeneously in a plane, with a vertical coordinate z = 1 km. The advection of the air parcels started at the same time as the overall convection. After the simulation was completed, all trajectories were divided into 2 km altitude bins based on their end point. The bin-averaged environmental properties were used for further simulations of gas processing within the parcels (see below).
2.2. Trajectory framework: impact of chemistry and microphysics on a multicomponent gas mixture
The framework presented in Bardakov et al. (Citation2020), which we build upon, treated a system consisting of one non-reactive trace gas and four hydrometeor types. The advected trace gases can thus exist in five ‘containers’ within an air parcel: liquid precipitation (i = 1), ice precipitation (i = 2), condensate water (cloud water) (i = 3), condensate ice (cloud ice) (i = 4) as well as in the vapour phase (i = 5). Using tensor notations, the balance equations for the trace gas phase species can be written in a short form following (EquationEquations (9)(3)
(3) –Equation(13)
(3)
(3) from Bardakov et al. (Citation2020)):
(1)
(1)
where C is the trace gas concentration with the index pointing to the corresponding ‘container’ (
), the coefficients aij describe concentration changes occurring purely due to microphysical interactions between a gas within the i-th and j-th ‘containers’ (i.e. condensation/evaporation, melting/freezing, accretion, auto-conversion, removal by precipitation and expansion). b describes gas concentration changes due to mixing with background air.
is a Kronecker delta (accounting for processes occurring only within the vapour container). Both aij and b are defined in in Appendix A.
Table 1. Molecular properties for the system compounds used in the simulations.
In this work, we have modified the model by Bardakov et al. (Citation2020) to treat the evolution of a multi-component gas mixture as well as accounting for associated chemical reactions in the gas-phase. The equation for change of concentration, C, for a specific gas along an air parcel trajectory in general form can be written as follows:
(2)
(2)
where the first term in the right hand side describes concentration change due to microphysical processes such as condensation/evaporation to/from cloud hydrometeors, scavenging by hydrometeors, processes of autoconversion, accretion as well as expansion of air, etc., the second term describes concentration change due to mixing with background air, the third term describes concentration change due to bimolecular chemical reactions, the forth term describes concentration change due to unimolecular chemical reactions and the fifth therm describes concentration change due to a source/sink. For a system of N reactive trace gases advected in an air parcel, the exact balance equation based on EquationEquations (1)
(1)
(1) and Equation(2)
(2)
(2) can be written as:
(3)
(3)
where index l now points to the corresponding trace gas within the i-th ‘container’ (
). The matrix
describes the time-dependent rate coefficients for a reaction between the m-th and n-th chemical components. The tensor σlmn represents the stoichiometric coefficients of reactions and describes gas sources to the l-th compound from the reactions between m-th and and n-th compounds. The matrix ξlm represents the stoichiometric coefficients for the sinks of the l-th component due to reaction with the m-th component. ρlm describes the stoichiometric coefficients for sources of the l-th compound from photolysis of the m-th component. ψm are the rate coefficients for photolysis of the m-th compound. σlmn, ξlm and ρlm consist of zeros or corresponding stoichiometric coefficients and identify necessary reactions in the corresponding equations. γl is a possible source of the l-th trace gas from other processes (e.g. NO from lightning). The physical meaning of the different terms in EquationEquation (3)
(3)
(3) is summarised in . The model does not account for aqueous-phase chemistry, which also can impact the redistribution of trace gases and production of new particles. The impact of this assumption is discussed in Sect. 3.3.
2.3. Configuration of the modelled system: the compounds, their properties, reactions and initial concentrations
The modelled system included 33 chemical compounds relevant for isoprene photo-oxidation (see ). These compounds can interact with hydrometeors and react with each other in the gas phase according to EquationEquation (3)(3)
(3) while at the same time being transported aloft in an air parcel. Water vapour was not treated as a separate gas and its concentration was supplied from the CRM. All the reactions were assigned a temperature-dependent reaction rate where it was available (all the included effective reactions and corresponding reaction rates are given in ). The simplified isoprene oxidation mechanism presented here used a subset of reactions and rate constants from the Master Chemical Mechanism, MCM v3.2 (Jenkin et al., Citation2015), available via the website: http://mcm.leeds.ac.uk/MCM and additional reactions to describe certain RO2 reactions described in Thornton et al. (Citation2020). In order to maintain computational efficiency, the chemical mechanism was significantly reduced, but the general characteristics in terms of OH, HO2, NO, and distribution of oxidation products were similar to that predicted by a more comprehensive mechanism described by Thornton et al. (Citation2020) for the same conditions. Photolysis was done in a simplistic way using approximate photolysis frequencies (known as j-values) (in s–1) derived from the Troposphere Ultraviolet and Visible (TUV) v. 5.3 radiation code (Madronich and Flocke, Citation1999). The j-values were calculated assuming a solar zenith angle of 0 deg, overhead ozone column of 300 DU, an altitude of 12 km and clear sky conditions. Based on the studies by Ruggaber et al. (Citation1994) who indicated a decrease of photolysis frequencies by several times with increased liquid water content, the photolysis rates in our framework were assumed to be reduced by 60% when the amount of hydrometeors in the parcel reached its maximum of
g kg–3 for the considered cloud cases. The j-values in our model, however, do not account for in-cloud multiple scattering, which influences them in the lower and upper levels of the cloud (Madronich and Flocke, Citation1999; Brasseur et al., Citation2002).
Table 2. Different settings for the simulations.
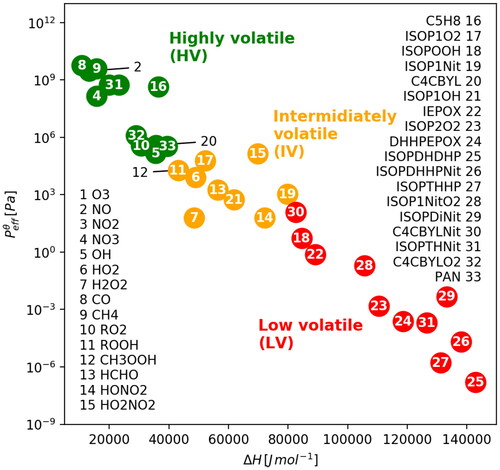
The enthalpy of vaporisation, and the effective saturation vapour pressure,
which is a product of the saturation vapour pressure at 298 K and the activity coefficient (see Bardakov et al., Citation2020, for details) for compounds 0-15 in were estimated using the Henry’s law function from Sander (Citation2015).
and
for the isoprene oxidation products (16-32 in ) were estimated using the UManSysProp (Topping et al., Citation2016) calculator and the AIOMFAC (https://aiomfac.lab.mcgill.ca, Zuend et al., Citation2008, Citation2011; Zuend and Seinfeld, Citation2012) model for the activity coefficient. shows a diagram depicting the volatilities of the considered compounds. In general, the more volatile and less soluble species tend to stay in the vapour phase whereas less volatile and more soluble gases are more readily taken up by hydrometeors. In the absence of aqueous-phase chemical reactions, Bardakov et al. (Citation2020) concluded that gases can be divided into three volatility bins depending on their
and
We have categorised the species into three volatility groups: twelve of the studied species belong to the high volatility (HV) group, eleven to the low volatility (LV) group, and the remaining nine species to the intermediate volatilities (IV) group in between these two extremes (see ). Condensation to both liquid and ice hydrometeors is an important factor controlling the concentrations of the chemical species, which may close certain chemical transformation pathways expected in a cloud-free environment. For simplicity and as a default, the interaction of the chemical species with ice were assumed to be the same as for liquid water. This is obviously a crude assumption (since in reality low volatile species are taken up by ice with different efficiencies), and its effect on the modelled results was also accessed and discussed in Sect. 3.3.
Fig. 2. Volatility diagram for the compounds in the modelled system.
Some trace gases have retention coefficients less than 1, which can impact the gas redistribution within the cloud (Jost et al., Citation2017; Ge et al., Citation2018; Bela et al., Citation2018). Nevertheless, we do a rough assumption that all species are completely retained upon droplet freezing since the majority of the modelled species still lack any experimentally derived retention efficiency values and assessing the influence of a hypothetical retention is out of the scope of this study.
To obtain representative boundary layer concentrations for the Amazon prior to the convective event, we included a spin-up period (of hours) before the simulation during which all the species (except for O3, NO, CO, CH4 and isoprene) were allowed to evolve without any interaction with hydrometeors until a stationary state was reached. Initial concentrations for the spin-up were based on available observational data (see in the SI) and corresponded to background concentrations at 1 km height. The vertical background profiles in this study are idealised, but derived based on available observational data from multiple campaigns ( for references and in the SI for all the profiles used). Resulting concentrations after the spin-up were then used as initial values in the parcel model. The exact conditions of the boundary layer chemistry and composition were, however, not considered particularly important as our main aim is to evaluate, in a relative sense, changes due to transport through a convective event.
NO affects the instantaneous OH concentration, and thus the isoprene oxidation rate, as well as the fate of the isoprene peroxy radicals. At NO concentrations much higher relative to HO2, the isoprene peroxy radical will react predominantly with NO to produce an alkoxy radical and an alkyl nitrate (RONO2) with an ∼85 and 15% yield, respectively (Paulot et al., Citation2009a). The alkoxy radical generally loses a carbon atom to produce C4 aldehydes and ketones such as methacrolein (MACR) and methylvinylketone (MVK). At low NO, isoprene peroxy radicals are thought to react mostly with HO2 (due to its abundance in the atmosphere) yielding a C5 hydroxy hydroperoxide, ISOPOOH, which is further oxidised by reaction with OH to form mostly an epoxy diol, IEPOX (Paulot et al., Citation2009b), as well as second-generation di-hydroxy hydroperoxy isoprene peroxy radical. Understanding the branching between all these isoprene oxidation products is likely necessary to predict new particle formation and growth as the resulting volatility distributions will differ depending on the predominant pathways.
We considered five simulations reflecting different plausible scenarios in the tropical atmosphere (see ). The reference simulation (REF) was used to study the sensitivity of gas transport to the different cloud cases and different parcels within the same cloud. REF was also used as the base for all other configurations. The simulation NULL_CHEM was used to study gas transport without chemical reactions to quantify how the reactions influence the fraction of isoprene transported into the cloud outflow. The LIGHTNING simulation included a constant source of NO of 0.0016 ppb s–1 that was added to the parcel between 8 and 12 km altitude to evaluate the impact of an NO source from lightning on the system evolution. This rate allows NO concentration reach levels similar to those observed in cloud anvils (see e.g. Huntrieser et al., Citation2007; Pollack et al., Citation2016) and used in analogous modelling studies (see e.g. Cuchiara et al., Citation2020).
LIGHTNING + NULL_COND_ICE was the same as LIGHTNING except that the condensation and evaporation of the gases to/from ice particles was completely neglected. This simulation allowed us to estimate the impact of the uncertain process of vapour condensation (or reactive uptake) on ice for the system enhanced by a lightning NO. The simulation NULL_ISOP was used to study gas transport without isoprene to see how OH is influenced in the cloud parcel by isoprene transport, as isoprene can deplete OH due to its high concentrations in the boundary layer over the Amazon and high reactivity towards OH.
3. Results
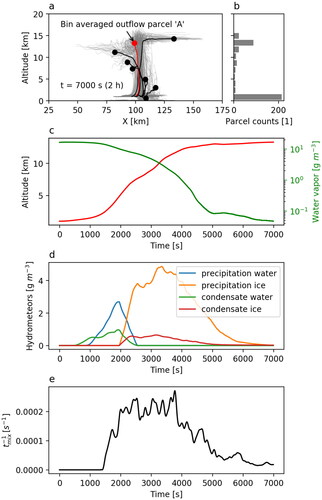
shows all the 400 simulated deep convective cloud parcel trajectories and the bin-averaged parcels for the reference case, i.e. April 23, 2020. Most buoyant parcels reach altitudes up to 16 km, but air parcels mainly end up within the 12-14 km altitude bin (cf. ). Parcel A is representative for the predominant transport pathway to high altitude cloud outflow and we investigated this parcel in more detail. , show the microphysical properties of parcel A (solid lines) together with its altitude as a function of time (red line). Water vapour concentrations decline quickly as hydrometeors appear in the system, and reach background values after s. The hydrometeors consist primarily of liquid water up to an altitude of about 6 km and then transition into ice upon further ascent. After
s, the mass of hydrometeors quickly declines in the system primarily due to precipitation. The height reached by parcel A at the end of the simulation is
12.6 km. shows the reversed timescale of gas mixing with the out-of-parcel air as a function of time (we use the reversed timescale since the timescale turns to infinity in some points, e.g. before
s). Most of the mixing occurs during transport between approximately 6 and 12 km with a maximum timescale of
s–1 when the parcel approaches the immediate cloud outflow. Once the parcel reaches the immediate outflow, and the cloud starts dissipating, the mixing decreases. For an insoluble non-reacting trace gas transported in clean air, this mixing leads to a dilution rate of
% km–1, which is in a reasonably good agreement with previous studies (see e.g. Fried et al., Citation2016; Barth et al., Citation2016; Cuchiara et al., Citation2020), where a corresponding rate of
% was typically reported.
Fig. 3. Trajectories of the 400 simulated deep convective cloud air parcels for the April 23, 2020 case (grey), parcels averaged by height bins (black), parcel A used for further analysis (red) (a), distribution of parcels according to their final altitude (b), the altitude of parcel A (red line) and the corresponding water vapour concentration (green line) (c), the total water mass of the different types of hydrometeors (d), and the reversed timescale of mixing (e).
3.1. Sensitivity of predicted concentrations to chemical processes, scavenging by hydrometeors and turbulent mixing
shows the concentrations of 21 selected modelled species (see ) as a function of time along the trajectory A for the REF and NULL_CHEM simulations (). A comparison between the reference system evolution (REF) and the one where chemical reactions were neglected (NULL_CHEM) allows us to quantify the influence of the chemical reactions during transport through the convective system.
Fig. 4. Evolution of gas phase concentrations of the 21 selected compounds (see ) along the trajectory A (see ) for the REF and NULL_CHEM simulations given in . The concentrations in ppb are normalised to the corresponding initial values also in ppb. The compound notations are followed by the corresponding volatility acronym in parentheses. Corresponding figures for all the 33 modelled species are provided in SI.
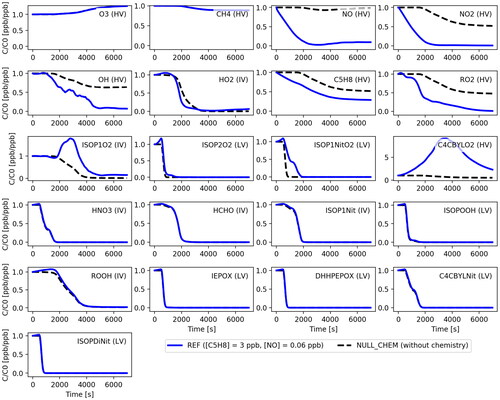
For some of the highly volatile gases, chemical reactions during vertical transport play a minor role in the evolution of the gas concentrations. Instead, mixing with out-of-cloud air is the defining factor. A clear example is O3 - the concentration steadily increases during the propagation of the parcel upwards due to mixing with the increasing background air O3 concentration. CH4 is also primarily affected by mixing. Its background concentration is high in the boundary layer, but also high in the upper layers of the troposphere (see in SI), so that when the parcel propagates upwards encountering turbulence there is no strong dilution of CH4 along the trajectory. The concentration towards the end of the simulation for parcel A decreases by % but can range between 5-15% for other outflow parcels (see Fig. S2-S35 in SI for the range of concentration values reached by different parcels in the outflow in the REF case). For CH4, there is no clear difference between REF and NULL_CHEM indicating that chemistry has a negligible impact in CH4 concentrations, which is also expected given its relatively long chemical lifetime compared to the timescale of convective transport.
The radical species, on the other hand, experience a greater impact from gas-phase chemical reactions. NO and NO2 are almost completely eliminated from the system during parcel advection. The concentration of NO at the end of the simulation in parcel A is % of its initial value primarily due to chemical reactions with O3, HO2, RO2, ISOP1O2, ISOP1NitO2 and C4CBYLO2. The concentration of NO shows a slight increase after t = 3000s (around the altitude of 8 km) due to dampened reactions with low-volatility species that disappear from the gas-phase by condensation onto hydrometeors, and due to mixing with the upper tropospheric background NO. The NO concentration at the end of simulation can decline by
% (cf. in SI) in other parcels that reach the outflow, showing its strong dependence on the thermodynamic properties of the particular parcel. The NO2 concentration in the parcel is reduced by almost 100% for parcel A but also for other outflow parcels at the end of the simulation, of which
% is attributed to mixing processes and the rest to chemical reactions. The simulation that includes a NO source during the ascent from lightning is discussed in Sect. 3.1.1.
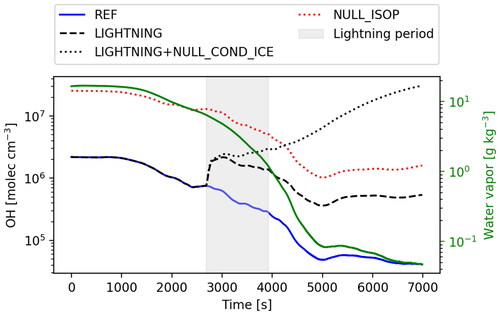
OH plays a crucial role for the evolution of isoprene and the subsequent production of lower-volatility species that could potentially contribute to NPF. A comparison between the REF and the NULL_CHEM simulations shows that chemistry is an important contributor to the OH concentration change. For better clarity, shows the concentration of OH (in molecules cm–3) and the concentration of water vapour (or H2O) along the trajectory A as a function of time for all the simulations. Production of OH through ozone photolysis occurs in the presence of water vapour and is generally proportional to the concentrations of these two species (Warneck, Citation1975). Since the level of O3 is sufficiently high along the whole trajectory, the OH production is primarily limited by the level of water vapour in the parcel, especially in the outflow. In the REF simulation, the OH concentration declines more than one order of magnitude from its initial value of molecules cm–3 as the parcel is advected from the cloud inflow to the region of outflow (i.e.
s and ∼ 10 km altitude). Further within the outflow region (at t > 4000s), OH continues to decline due to reaction with the remaining isoprene and its oxidation products and is around
molecules cm–3 for parcel A (or in range
molecules cm–3 for the parcels reaching outflow) by the end of the simulation.
Fig. 5. Evolution of OH along the trajectory A (see 3) for the REF (blue solid line), LIGHTNING (black dashed line), LIGHTNING + NULL_COND_ICE (black dotted line), NULL_ISOP (red dotted line) simulations as well as concentration of water vapour (or H2O, green solid line) as a function of time. Grey shaded area shows lightning period.
Reactions with OH significantly reduce the isoprene concentration, but dilution through entrainment of background air accounts for the majority of the decrease in the isoprene mixing ratio. In REF, isoprene declines by % for parcel A, initially due to rapid oxidation by OH and subsequently (after
s and an altitude of about 5 km) also due to mixing with the background air. The impact of mixing accounts for
% of the decrease of isoprene during the parcel ascent. The rest of the decline in isoprene (
%) is due to reaction with OH. We note here that there are strong feedbacks between isoprene and OH that depend upon the presence of NO and the uptake efficiency of HO2 to ice. In other parcels reaching the cloud outflow, isoprene concentrations decline by
% (cf. Fig. S17 in SI). The extent and rate of isoprene oxidation in the outflow depends on the isoprene concentration reaching the outflow and thus the boundary layer concentration through its titration of OH. Recycling of OH by reactions of RO2 and HO2 with NO is crucial for the isoprene chemical lifetime in the outflow. RO2 in NULL_CHEM only decreases due to mixing with the out-of-cloud air. The gas stays undiluted until around 2000s. Mixing starts from
s (see ) which corresponds to a height of 2 km. At this altitude the background for RO2 is still high (see vertical profiles in SI) and effectively does not dilute RO2 and does not lead to a noticeable mixing. It becomes stronger when the air parcel is mixed with the clean background at altitudes of > 4 km which corresponds to
s.
The isoprene oxidation products have different volatilities (see ) which defines whether they will be taken up by the hydrometeors or stay in the gas-phase in the absence of a chemical sink (see Bardakov et al., Citation2020). ISOP1O2, C4CBYLO2 and PAN have elevated concentrations because of their high volatility and due to the influence of cloud chemistry. The net production of ISOP1O2 and C4CBYLO2 is high after s, resulting in elevated concentrations in the immediate outflow compared to the cloud inflow. However, the concentrations of these species then rapidly decrease after
s (altitudes higher than about 10 km) when isoprene oxidation is dampened due to decreasing OH production. Compounds such as HO2, ISOP2O2, ISOP1NitO2, HNO3, HCHO, ISOP1Nit, ISOPOOH, ROOH, IEPOX, DHHPEPOX, C4CBYLNit and ISOPDiNit have sufficiently low volatilities to be almost entirely lost by condensation onto hydrometeors both inside the core of the cloud and in the immediate outflow. Only a small fraction of these species are predicted to stay in the vapour phase after the convective event.
3.1.1. Examining the impact of an NO source from lightning and the role of condensation onto ice
The evolution of isoprene and its oxidation products is significantly affected by a source of NO within the upper portion of the deep convective cloud, which was added to mimic the effects of lightning. shows concentrations of 21 selected compounds (see ) as a function of time along the trajectory A (see ) for the simulations REF, LIGHTNING and LIGHTNING + NULL_COND_ICE. For the LIGHTNING case, the NO concentration reaches ppb at 12 km. This value is in line with the range of values that are typically observed within storm anvils (see e.g. Huntrieser et al., Citation2007; Pollack et al., Citation2016) and leads to a number of impacts on other gases. The concentration of NO2 also increases to a maximum of 0.5 ppb which occurs simultaneously with the maximum in NO. The OH concentration is 50% higher within the region where lightning NO is added but then returns back to the initial value of
molecules cm–3 at the end of the simulation (see ). HO2 increases by a factor of 3, from 0.005 to 0.015 ppb, and then decreases again, mostly as a result of the high abundance of NO. The simulated lightning NOx leads to changes of less than 10% in O3, CH4, ROOH, HCHO and HNO3 over the simulated time period. However, as expected, there is a sharp decline in RO2 and related species such as ISOP1O2 and C4CBYLO2 due to the enhanced rate of reaction between organic peroxy radicals and NO. Isoprene declines more rapidly with lightning NOx present in the outflow due to the somewhat higher concentrations of OH (amounting to 0.5 ppb at the end of LIGHTNING compared to 0.9 ppb that of REF). Lightning NOx has a negligible influence on most of the isoprene oxidation products, including ISOP2O2, ISOP1NitO2, ISOP1Nit, ISOPOOH, IEPOX, DHHPEPOX, C4CBYLNit and ISOPDiNit (for clarity see Fig. S35 in SI where only the REF and LIGHTNING simulations are compared). The rate of production of many of these species, such as ISOP1Nit, does change substantially, but the production is cancelled by efficient scavenging by the anvil ice. These effects are further evaluated in the LIGHTNING + NULL_COND_ICE simulation.
Fig. 6. Evolution of gas phase concentrations of the 21 studied compounds (see ) along the trajectory A (see ) for the simulations REF (blue line), LIGHTNING (dashed black line) and LIGHTNING + NULL_COND_ICE (dotted black line), see . The grey shaded area denotes period of simulated lightning. The concentrations in ppb are normalised to the corresponding initial values also in ppb. The compound notations are followed by the corresponding volatility acronym in parentheses. Figures for all the 33 modelled species as well as a figure which compares the REF and LIGHTNING cases are provided in SI.
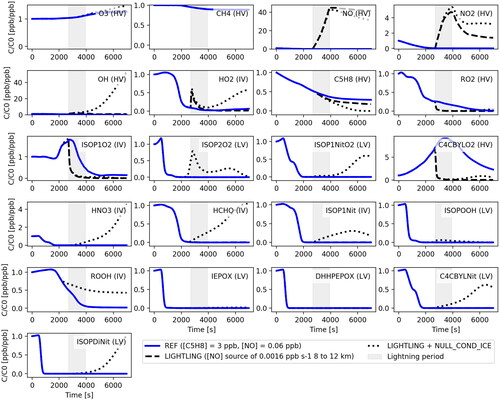
Neglecting gas condensation onto ice for the system with lightning NOx does not change the concentrations of O3 and CH4 appreciably over the simulation period, in part because of their initial abundance and high volatility, which prevents condensation to ice in the other simulations. In contrast, ROOH and HCHO survive transport and are not completely removed as in the REF and LIGHTNING simulations. The concentration of NO after transport through the region with a simulated lightning source (gray shading in ) is lower than for the LIGHTNING case. The lower NO is due to higher reaction rates of NO with HO2, which is no longer scavenged by the ice phase. The enhanced reaction of NO with HO2 leads to increased NO2 and HNO3. The concentration of HNO3 increases about four times compared to the initial concentration at the end of the simulation due to a higher production rate and lower scavenging to ice. Uptake of HNO3 to ice under cirrus conditions has been well documented and follows a Langmuir-Hinshelwood mechanism (Abbatt, Citation1997; Ullerstam et al., Citation2005). Thus, completely suppressing its condensation to ice is likely not accurate. Nevertheless, neglecting HNO3 uptake to ice does not affect the oxidation of isoprene substantially, which is of interest here. In contrast, neglecting HO2 uptake to ice for the system with lightning leads to significantly elevated OH concentrations of up to molecules cm–3 (see ). HO2 production is somewhat enhanced in LIGHTNING + NULL_COND_ICE due to reactions of NO with isoprene-derived peroxy radicals. These are more abundant because they do not condense onto ice and because higher OH leads to faster oxidation of isoprene. When gas uptake by ice is suppressed, isoprene is eliminated completely within 2 hours of simulation due to the high OH. Products of isoprene oxidation, especially ISOP2O2, ISOP1NitO2, ISOP1Nit, C4CBYLNit, and ISOPDiNit are strongly enhanced after the beginning of the lightning period compared to the other simulations. Of particular interest are the clear enhancements in multifunctional products, such as di-hydroxy di-nitrates of isoprene (ISOPDiNit), which at outflow temperatures have saturation vapour pressures and enthalpy of vaporisation that place them well into the extremely low volatility (ELVOC) range. Their concentrations are enhanced by a factor of
in LIGHTNING + NULL_COND_ICE compared to the simulations that include their condensation to anvil ice. All other compounds are relatively unaffected as compared to the LIGHTNING simulation. The evolution of the concentrations on a logarithmic scale as well as with concentrations in ppb are found in Fig. S2 - S34 in the SI.
3.2. Sensitivity to the parcel height and simulated cloud case
We calculated gas concentrations at different parcel altitudes and for three different simulated deep convective clouds. , and shows the trajectories of the 400 air parcels for the three cases together with the bin-averaged parcels for the corresponding REF simulation (). The three clouds were initiated in a very unstable environment and all cloud tops reach up to 16 km height (see Sect. 2.1). More than half of the simulated parcels sink downwards while the buoyant parcels mainly end up within the 12-14 km outflow height bin (see ). The maximum updraft velocity within the parcels reaches up to 53, 43 and 40 m s–1 for the April 8, 23 and 27 cases, respectively. The maximum precipitation content in the parcels within the outflow bin ranges from 48 to 68 g m–3 and the condensate content from 0.9 to 11 g m–3. Based on this comparison we conclude that the three cloud cases are similar in terms of their dynamical and microphysical properties, supporting the choice of the April 23 case as a representative example. Moreover, convective systems with similar dynamical properties can often be observed over tropical and subtropical regions (see e.g. Teitelbaum and D'Andrea, Citation2015; DiGangi et al., Citation2016).
Fig. 7. Trajectories from three different simulated deep convective cloud events (a, b and c). All parcels were divided into bins as a function of their arrival altitude and their properties were thereafter averaged (filled circles in a, b and c). Histogram of the final altitudes of the parcels (d) and chemical concentrations (e) in the out-of-cloud background (dashed line) and in the binned parcels after 2 h of simulation for three deep convective cloud cases (colored lines). Simulation settings are according to REF (see ).
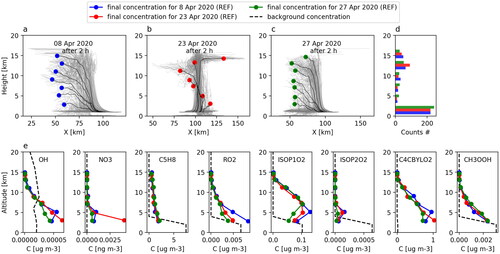
In general, the vertical profiles of most chemical species are similar for the three convective events. shows concentrations of 8 selected compounds inside the bin-averaged air parcels after 2 hours of deep convective cloud simulation (the filled circles) for the three REF simulations. The concentration differences for the selected chemical species are less than 20%; the only exception is the NO3 concentration in the lowest altitude bin. The high concentration in one of the cases (April 23) is explained by a smaller condensation sink for this case which led to a much higher concentration of HNO3. All other compounds show either very low concentrations or similar concentrations for all cloud cases (concentrations for all compounds are shown in in SI). We therefore conclude that it is sufficient to use output from one simulation to assess tracer transport for a typical deep convective cloud event over the Amazon.
3.3. Discussion
Our results elucidate the impact of convective clouds on isoprene-driven gas-phase chemistry and potential to form precursors for aerosol formation in the tropical upper troposphere. The transport of isoprene, its oxidation products, and the corresponding effects on atmospheric oxidant profiles within the cloud are highly dynamic. The fraction of isoprene that makes it to the cloud outflow is mainly influenced by turbulent mixing which dilutes the convective core and outflow. Chemistry and related chemical sinks depending on radical oxidant concentrations is next in importance. Isoprene itself is an important sink for OH during vertical transport. The decrease of OH related to the reaction with isoprene was also highlighted in studies by Martinez et al. (Citation2010) and Taraborrelli et al. (Citation2012). This process makes the isoprene lifetime in convective outflow sensitive to NO and the fate of HO2. Assumptions about NO levels and HO2 scavenging to ice hydrometeors result in an up to two-orders-of-magnitude range in the predicted OH levels in the cloud outflow (typical OH concentrations are reported to be ∼106 molecules cm–3 in the ambient atmosphere, Brune et al., Citation2018). The strength of NO production from lightning and efficiency of gas condensation to ice allows for at least two distinct scenarios of the precursor transport leading to different possibilities for NPF.
In the first scenario, when the system evolves without lightning activity and where there is efficient gas uptake by ice (REF simulation), our results indicated that transport of low volatility isoprene oxidation products (which could contribute to NPF or growth) is inefficient mainly due to scavenging by water and ice hydrometeors. For a typical outflow air parcel (parcel A in ), isoprene mixing ratios decreased by % compared to the inflow due to chemistry and turbulent mixing with the background air. The range of decrease in the whole set of air parcels that reached the outflow varied between
%, depending on the variability in the thermodynamic properties of the air parcels. The suppressed OH in the outflow set the chemical lifetime of the remaining isoprene to approximately a day. In the discussion following next, we will neglect many other processes that may influence NPF besides isoprene and its oxidation products. For the REF case (where gas condensation to ice is considered efficient and lighting NOx neglected), our results imply that NPF from isoprene oxidation products within the aged outflow is possible, but likely very slow. In a variation of the first scenario, when NOx from lightning was introduced to the system but the uptake on ice was still efficient (LIGHTNING simulation), the isoprene oxidation was more intense due to enhanced OH concentrations. However, the low volatility products quickly condensed onto ice and were ultimately removed by precipitation. This scenario was thus similar to REF in terms of NPF potential within the cloud outflow. For both REF and LIGHTNING, condensation to ice can still be a source of organic aerosols to the upper troposphere - if the ice sublimates and as long as the temperatures are low enough to keep the vapour pressures of the organic compounds low so that they stay in the residual particle and thus contribute to particle growth. In the third scenario, where large amounts of NO from lightning were added to the system and where gas uptake on ice was inefficient (LIGHTNING + NULL_COND_ICE simulation), there were remarkably high concentrations of several low volatile organic gases in the immediate cloud outflow. This should lead to an enhanced probability of NPF (lightning-enhanced SOA production was also pointed out by Schulz et al., Citation2018, based on aircraft measurements)), but the exact NPF-potential of these low volatility species would depend on the nucleation mechanism and whether other relevant species are present in the system.
We use a relatively simple representation of trace gas uptake to ice in this study which includes only two extreme approximations: efficient (treated as for water droplet) or inefficient (simply neglected) gas uptake. Support for using both of these approximations is found in the literature for different gases, e.g. efficient condensation of HNO3 onto ice (Abbatt, Citation1997; Ullerstam et al., Citation2005) for the former approximation and small HO2 uptake on ice (Brune et al., Citation2018) for the latter. This means that there is a strong need for identifying more precise atmospheric trace gas properties and a better understanding of the process of gas interaction with cloud ice, especially the interactions of low volatility organics with ice. In this study we employed a simplified isoprene oxidation mechanism for the simulations as compared to the MCM chemical mechanism due to computational limitations. This simplification could increase the uncertainty for the concentrations of some species (in particular OH) in the system.
Although relevant observational data in the UT Amazon region are scarce, some rough comparisons can be made with current existing data sets to evaluate our results. Apel et al. (Citation2012) reported an isoprene concentration of 400-1000 pptv and 200-600 pptv in the boundary layer and in the cloud outflow regions ( km), respectively, over Canadian boreal forest environment. This indicates a possible loss of the order of
% during convective transport. This value is lower, but in the same order of magnitude, as the value of
% reported here for the average outflow parcel in REF. The discrepancy could be explained by the very different conditions for our simulated case and the observed events described by Apel et al. (Citation2012), including the different location, environment, type of convection and thermodynamic conditions. We should also highlight that the results in our study reflect the behaviour of a typical outflow parcel, where the isoprene concentration declined to 0.9 ppb (for all parcels reaching outflow, the range was
ppb).
Our results can also be compared with the work by Murphy et al. (Citation2015) who simulated very efficient homogeneous nucleation of aerosol particles (with rates up to 5 cm–3 s–1) inside and in the immediate outflow of a deep convective cloud over the Amazon, even though effects of lightning were not considered. Murphy et al. (Citation2015) concluded that nucleation occurred inside the cloud through transport of organic vapours from the boundary layer and subsequent oxidation, which is at odds with the conclusions from our work. There are a number of key differences between our study and the one by Murphy et al. (Citation2015). One difference is that Murphy et al. (Citation2015) included monoterpenes and sesquiterpenes in their calculations. Furthermore, they did not simulate chemical reactions during the convective activity. Instead, the whole chain of oxidation steps was approximated through converting the precursors to end-products with a range of volatilities with a fixed yield. The oxidation was assumed to take place before the convective event, and the oxidation products were assumed to be initially in equilibrium with the background aerosol. We also make different assumptions for the mechanism of gas uptake by ice: Murphy et al. (Citation2015) assumed perfect adsorption to ice while we approximate ice with liquid water when it comes to condensation on ice. In particular, these differences could result in the contrasting behaviours of the in-cloud OH profiles as well as differences in the condensation sink values simulated in the outflow region ( s–1 in Murphy et al. (Citation2015) vs. ∼
s–1 in this study). The differences in condensation sink values between our study and Murphy et al. (Citation2015) could in itself explain the difference in transport of the lower-volatility species.
As discussed above, we did not consider organic particle precursors other than isoprene in this study. Mono- and sesquiterpenes will be less sensitive to the OH concentration due to relatively more rapid reactions with ozone, which produce more lower volatility products than similar ozone reactions with isoprene. As demonstrated by e.g. Kirkby et al. (Citation2016) and Zhao et al. (Citation2020), monoterpenes (and also sesquiterpenes while much less abundant) are expected to produce oxidation products with much lower volatilities and hence higher NPF-potential as compared to isoprene. However, McFiggans et al. (Citation2019) and Heinritzi et al. (Citation2020) demonstrated a suppressing effect of isoprene on monoterpene-driven aerosol formation and NPF in conditions resembling the atmospheric boundary layer. Thus, accurately accounting for the oxidation of isoprene in deep convective cloud outflow is still important to NPF simulations, regardless of its direct contribution. That said, neither the NPF-potential of isoprene oxidation products nor their interaction with the monoterpene system (along with other chemical species) at upper tropospheric conditions has not, to our knowledge, been studied to date. To further develop the work by Zhao et al. (Citation2020), who demonstrated the potential importance of monoterpenes in upper tropospheric aerosol formation, it would therefore be crucial to conduct studies that explicitly simulate the transport, chemistry, mixing and aerosol formation processes in systems containing all the relevant chemical species. Finally, yet another aspect that was not considered in this study, and that deserves further attention for a complete picture of the chemistry within convective clouds, is the aqueous-phase chemistry involving isoprene oxidation products such as isoprene-derived epoxides and organic nitrates that potentially can form organic aerosol mass (Tsui et al., Citation2019; Lamkaddam et al., Citation2021). While we expect acid-catalyzed reactions to be slow in these dilute droplet conditions and the time spent in the warm phase of the cloud to be short (as was also previously demonstrated by e.g. Barth et al. (Citation2001) and Bela et al. (Citation2018)), the impact on net organic aerosol formation should still be assessed.
4. Conclusions
Based on the framework of Bardakov et al. (Citation2020), we have studied the transport of 33 gases involved in isoprene photo-oxidation from the boundary layer to the upper atmosphere over the Amazon during the wet season. We simulated three isolated deep convective clouds and analyzed the effects of vertical transport and mixing, chemical reactions, and gas uptake to water and ice hydrometeors - within the cloud, during the ascent and in the cloud outflow. Furthermore, we studied the sensitivity of the predicted gas-phase evolution to an assumed lightning-driven source of NO and to the vapour uptake on ice hydrometeors. Both these processes add large uncertainties to the calculations and have, in particular, a considerable effect on the predicted OH concentrations.
The final abundance of the chemical species in the upper troposphere was primarily defined by the paths of the individual air parcel trajectories, as different paths could produce strong variations in the thermodynamic properties of the air. Differences in the overall cloud dynamics (generated by different initial meteorological conditions) played a minor role. For a system with no lightning and efficient gas condensation on ice (REF simulation), up to % of the boundary layer isoprene could be transported by an ‘average’ parcel into the cloud outflow. Our simulations showed that
% of the isoprene was lost due turbulent mixing of the parcel with the out-of-cloud air and
% was lost due to chemical reaction with OH. In general, there were only small amounts of isoprene oxidation products available within the deep convective cloud and in the immediate outflow due to the high condensation sink within the cloud. Any formation of new aerosol particles would, in this case, need to be initiated through a slow oxidation of isoprene and subsequent condensation of the oxidation products in the aged (i.e. after ∼
h of convection) cloud outflow where NPF would also be promoted by a lower condensation sink, in line with the mechanisms proposed by e.g. Kulmala et al. (Citation2006) or Williamson et al. (Citation2019).
Adding a source of NO from lightning had little effect on the transport of isoprene and its oxidation products through the convective cloud. The overall results were similar to the REF simulation, except that the OH concentrations were enhanced at altitudes right above the region of enhanced NO. However, in an extreme case where any gas uptake by ice was neglected, OH concentrations reached molecules cm–3 as a result of a higher abundance of HO2. In this case, there were relatively high concentrations of low volatile isoprene oxidation products, such as ISOP2O2, ISOP1NitO2, ISOP1Nit, C4CBYLNit, ISOPDiNit, in the cloud outflow. These oxidation products could enhance the NPF potential.
Due to the extreme sensitivity of the system to lightning NOx (which led to enhanced production of isoprene oxidation compounds) as well as the approximations used for treating gas condensation on ice (which defined the sink of the low volatile species), we recommend that future research should aim at reducing the uncertainty associated with gas uptake by ice. In particular, estimates of e.g. coefficients of gas accommodation on ice relative to those on liquid droplets from molecular dynamic simulations in combination with lab experiments are needed for most of the species considered in this study. Also, investigating retention coefficients upon droplet freezing for a range of gases would be valuable. Furthermore, while this study focussed solely on isoprene and its oxidation products, we recognise the presence of mono- and sesquiterpene emissions in the tropical atmosphere, their known NPF-potential and interactions with the isoprene system. Obtaining a comprehensive picture of aerosol formation from organic vapours in the upper troposphere would require (a) accounting for the full interactive chemical system, (b) an understanding the thermodynamic and chemical environment set by convection and associated lightning, (c) the resulting volatility distributions of the precursor species produced and transported in regions of high biogenic volatile organic compound emissions (not only the Amazon but also over Africa, Southeast US, and Southeast Asia), (d) a molecular-level picture of the initial clustering and further condensational growth of new particles by these species in the relevant conditions.
Code and data availability
Air parcel trajectories data generated by the MIMICA code as well as the trajectory box model simulation results are available online (Bardakov et al., Citation2021)
zelb_a_1979856_sm9300.pdf
Download PDF (6.8 MB)Disclosure statement
The authors declare that they have no conflict of interest.
Supplemental data
Supplemental data for this article can be accessed here.
Additional information
Funding
References
- Abbatt, J. P. 1997. Interaction of HNO3 with water-ice surfaces at temperatures of the free troposphere. Geophys. Res. Lett. 24, 1479–1482. doi:https://doi.org/10.1029/97GL01403
- Abbatt, J., Bartels-Rausch, T., Ullerstam, M. and Ye, T. 2008. Uptake of acetone, ethanol and benzene to snow and ice: effects of surface area and temperature. Environ. Res. Lett. 3, 045008. doi:https://doi.org/10.1088/1748-9326/3/4/045008
- Andreae, M. O., Afchine, A., Albrecht, R., Holanda, B. A., Artaxo, P. and co-authors. 2018. Aerosol characteristics and particle production in the upper troposphere over the Amazon Basin. Atmos. Chem. Phys. 18, 921–961. doi:https://doi.org/10.5194/acp-18-921-2018
- Apel, E., Olson, J., Crawford, J., Hornbrook, R., Hills, A. and co-authors. 2012. Impact of the deep convection of isoprene and other reactive trace species on radicals and ozone in the upper troposphere. Atmos. Chem. Phys. 12, 1135–1150. doi:https://doi.org/10.5194/acp-12-1135-2012
- Bardakov, R., Thornton, J. A., Riipinen, I., Krejci, R. and Ekman, A. M. L. 2021. Air parcel trajectories data generated by MIMICA code and simulation results generated by a trajectory box model,.
- Bardakov, R., Riipinen, I., Krejci, R., Savre, J., Thornton, J. A. and co-authors. 2020. A novel framework to study trace gas transport in deep convective clouds. J. Adv. Model. Earth Syst. 12, e2019MS001931.
- Bartels-Rausch, T., Jacobi, H.-W., Kahan, T. F., Thomas, J. L., Thomson, E. S. and co-authors. 2014. A review of air–ice chemical and physical interactions (AICI): liquids, quasi-liquids, and solids in snow. Atmos. Chem. Phys. 14, 1587–1633. doi:https://doi.org/10.5194/acp-14-1587-2014
- Barth, M. C., Cantrell, C. A., Brune, W. H., Rutledge, S. A., Crawford, J. H. and co-authors. 2015. The deep convective clouds and chemistry (DC3) field campaign. Bulletin of the American Meteorological Society 96, 1281–1309. doi:https://doi.org/10.1175/BAMS-D-13-00290.1
- Barth, M., Bela, M., Fried, A., Wennberg, P., Crounse, J. and co-authors. 2016. Convective transport and scavenging of peroxides by thunderstorms observed over the central US during DC3. J. Geophys. Res. Atmos. 121, 4272–4295. doi:https://doi.org/10.1002/2015JD024570
- Barth, M., Kim, S.-W., Wang, C., Pickering, K., Ott, L. and co-authors. 2007. Cloud-scale model intercomparison of chemical constituent transport in deep convection. Atmos. Chem. Phys. 7, 4709–4731. doi:https://doi.org/10.5194/acp-7-4709-2007
- Barth, M., Sillman, S., Hudman, R., Jacobson, M., Kim, C.-H. and co-authors. 2003. Summary of the cloud chemistry modeling intercomparison: Photochemical box model simulation. J. Geophys. Res. 108, 1–9.
- Barth, M., Stuart, A. L. and Skamarock, W. 2001. Numerical simulations of the July 10, 1996, stratospheric-tropospheric experiment: radiation, aerosols, and ozone (STERAO)-deep convection experiment storm: Redistribution of soluble tracers. J. Geophys. Res. 106, 12381–12400. doi:https://doi.org/10.1029/2001JD900139
- Bela, M. M., Barth, M. C., Toon, O. B., Fried, A., Ziegler, C. and co-authors. 2018. Effects of scavenging, entrainment, and aqueous chemistry on peroxides and formaldehyde in deep convective outflow over the central and Southeast United States. J. Geophys. Res. Atmos.. 123, 7594–7614. doi:https://doi.org/10.1029/2018JD028271
- Boucher, O., Randall, D., Artaxo, P., Bretherton, C., Feingold, G. and co-authors. 2013. Clouds and aerosols. In: Climate change 2013: the physical science basis. Contribution of Working Group I to the Fifth Assessment Report of the Intergovernmental Panel on Climate Change, Cambridge University Press, pp. 571–657.
- Brasseur, A., Ramaroson, R., Delannoy, A., Skamarock, W. and Barth, M. 2002. Three-dimensional calculation of photolysis frequencies in the presence of clouds and impact on photochemistry. J. Atmos. Chem. 41, 211–237. doi:https://doi.org/10.1023/A:1014952630482
- Brune, W. H., Ren, X., Zhang, L., Mao, J., Miller, D. O. and co-authors. 2018. Atmospheric oxidation in the presence of clouds during the Deep Convective Clouds and Chemistry (DC3) study. Atmos. Chem. Phys. 18, 14493–14510. doi:https://doi.org/10.5194/acp-18-14493-2018
- Calvert, J. G., Derwent, R. G., Orlando, J. J., Wallington, T. J. and Tyndall, G. S. 2008. Mechanisms of Atmospheric Oxidation of the Alkanes.
- Claeys, M., Wang, W., Ion, A. C., Kourtchev, I., Gelencsér, A. and co-authors. 2004. Formation of secondary organic aerosols from isoprene and its gas-phase oxidation products through reaction with hydrogen peroxide. Atmos. Environ. 38, 4093–4098. doi:https://doi.org/10.1016/j.atmosenv.2004.06.001
- Clarke, A., Eisele, F., Kapustin, V., Moore, K., Tanner, D. and co-authors. 1999. Nucleation in the equatorial free troposphere: Favorable environments during PEM-Tropics. J. Geophys. Res. 104, 5735–5744. doi:https://doi.org/10.1029/98JD02303
- Cuchiara, G., Fried, A., Barth, M., Bela, M., Homeyer, C. and co-authors. 2020. Vertical transport, entrainment, and scavenging processes affecting trace gases in a modeled and observed SEAC4RS case study. J. Geophys. Res. Atmos. 125, e2019JD031957.
- D'Ambro, E. L., Møller, K. H., Lopez-Hilfiker, F. D., Schobesberger, S., Liu, J. and co-authors. 2017. Isomerization of second-generation isoprene peroxy radicals: Epoxide formation and implications for secondary organic aerosol yields. Environ. Sci. Technol. 51, 4978–4987. doi:https://doi.org/10.1021/acs.est.7b00460
- DiGangi, E., MacGorman, D., Ziegler, C., Betten, D., Biggerstaff, M. and co-authors. 2016. An overview of the 29 May 2012 Kingfisher supercell during DC3. J. Geophys. Res. Atmos. 121, 14–316.
- Ekman, A. M. L., Krejci, R., Engström, A., Ström, J., de Reus, M. and co-authors. 2008. Do organics contribute to small particle formation in the Amazonian upper troposphere? Geophys. Res. Lett. 35, 1–5.
- Ervens, B., Turpin, B. and Weber, R. 2011. Secondary organic aerosol formation in cloud droplets and aqueous particles (aqSOA): a review of laboratory, field and model studies. Atmos. Chem. Phys. 11, 11069–11102. doi:https://doi.org/10.5194/acp-11-11069-2011
- Fried, A., Barth, M., Bela, M., Weibring, P., Richter, D. and co-authors. 2016. Convective transport of formaldehyde to the upper troposphere and lower stratosphere and associated scavenging in thunderstorms over the central United States during the 2012 DC3 study. J. Geophys. Res. Atmos. 121, 7430–7460. doi:https://doi.org/10.1002/2015JD024477
- Fu, D., Millet, D. B., Wells, K. C., Payne, V. H., Yu, S. and co-authors. 2019. Direct retrieval of isoprene from satellite-based infrared measurements. Nat. Commun. 10, 3811–3812. doi:https://doi.org/10.1038/s41467-019-11835-0
- Ge, C., Zhu, C., Francisco, J. S., Zeng, X. C. and Wang, J. 2018. A molecular perspective for global modeling of upper atmospheric NH3 from freezing clouds. Proc. Natl. Acad. Sci. USA. 115, 6147–6152. doi:https://doi.org/10.1073/pnas.1719949115
- Grabowski, W. W. 1998. Toward cloud resolving modeling of large-scale tropical circulations: A simple cloud microphysics parameterization. J. Atmos. Sci. 55, 3283–3298. doi:https://doi.org/10.1175/1520-0469(1998)055<3283:TCRMOL>2.0.CO;2
- Grell, G. A., Peckham, S. E., Schmitz, R., McKeen, S. A., Frost, G. and co-authors. 2005. Fully coupled “online” chemistry within the WRF model. Atmos. Environ. 39, 6957–6975. doi:https://doi.org/10.1016/j.atmosenv.2005.04.027
- Guenther, A., Karl, T., Harley, P., Wiedinmyer, C., Palmer, P. and co-authors. 2006. Estimates of global terrestrial isoprene emissions using MEGAN (Model of Emissions of Gases and Aerosols from Nature). Atmospheric Chem. Phys. 6, 3181–3210. doi:https://doi.org/10.5194/acp-6-3181-2006
- Hallquist, M., Wenger, J. C., Baltensperger, U., Rudich, Y., Simpson, D. and co-authors. 2009. The formation, properties and impact of secondary organic aerosol: current and emerging issues. Atmos. Chem. Phys. 9, 5155–5236. doi:https://doi.org/10.5194/acp-9-5155-2009
- Heinritzi, M., Dada, L., Simon, M., Stolzenburg, D., Wagner, A. C. and co-authors. 2020. Molecular understanding of the suppression of new-particle formation by isoprene. Atmos. Chem. Phys. 20, 11809–11821. doi:https://doi.org/10.5194/acp-20-11809-2020
- Hoffmann, T., Odum, J. R., Bowman, F., Collins, D., Klockow, D. and co-authors. 1997. Formation of organic aerosols from the oxidation of biogenic hydrocarbons. J. Atmos. Chem. 26, 189–222. doi:https://doi.org/10.1023/A:1005734301837
- Huntrieser, H., Schlager, H., Roiger, A., Lichtenstern, M., Schumann, U. and co-authors. 2007. Lightning-produced NO x over Brazil during TROCCINOX: airborne measurements in tropical and subtropical thunderstorms and the importance of mesoscale convective systems. Atmos. Chem. Phys. 7, 2987–3013. doi:https://doi.org/10.5194/acp-7-2987-2007
- Jenkin, M., Young, J. and Rickard, A. 2015. The MCM v3. 3.1 degradation scheme for isoprene. Atmos. Chem. Phys. 15, 11433–11459. doi:https://doi.org/10.5194/acp-15-11433-2015
- Jost, A., Szakáll, M., Diehl, K., Mitra, S. K. and Borrmann, S. 2017. Chemistry of riming: The retention of organic and inorganic atmospheric trace constituents. Atmos. Chem. Phys. 17, 9717–9732. doi:https://doi.org/10.5194/acp-17-9717-2017
- Kärcher, B. and Basko, M. 2004. Trapping of trace gases in growing ice crystals. J. Geophys. Res. 109, D22204.
- Kim, S.-W., Barth, M. and Trainer, M. 2012. Influence of fair-weather cumulus clouds on isoprene chemistry. J. Geophys. Res. 117, D10302.
- Kirkby, J., Duplissy, J., Sengupta, K., Frege, C., Gordon, H. and co-authors. 2016. Ion-induced nucleation of pure biogenic particles. Nature 533, 521–526. doi:https://doi.org/10.1038/nature17953
- Krejci, R., Ström, J., de Reus, M., Hoor, P., Williams, J. and co-authors. 2003. Evolution of aerosol properties over the rain forest in Surinam, South America, observed from aircraft during the LBA-CLAIRE 98 experiment. J. Geophys. Res. 108, 1–17.
- Kroll, J. H., Ng, N. L., Murphy, S. M., Flagan, R. C. and Seinfeld, J. H. 2005. Secondary organic aerosol formation from isoprene photooxidation under high-NOx conditions. Geophys. Res. Lett. 32, n/a–n/a. doi:https://doi.org/10.1029/2005GL023637
- Kroll, J. H., Ng, N. L., Murphy, S. M., Flagan, R. C. and Seinfeld, J. H. 2006. Secondary organic aerosol formation from isoprene photooxidation. Environ. Sci. Technol. 40, 1869–1877. doi:https://doi.org/10.1021/es0524301
- Kulmala, M., Reissell, A., Sipilä, M., Bonn, B., Ruuskanen, T. M. and co-authors. 2006. Deep convective clouds as aerosol production engines: Role of insoluble organics. J. Geophys. Res. 111, 1–7.
- Lamkaddam, H., Dommen, J., Ranjithkumar, A., Gordon, H., Wehrle, G. and co-authors. 2021. Large contribution to secondary organic aerosol from isoprene cloud chemistry. Sci. Adv. 7, eabe2952. doi:https://doi.org/10.1126/sciadv.abe2952
- Lilly, D. K. 1962. On the numerical simulation of buoyant convection. Tellus 14, 148–172.
- Madronich, S. and Flocke, S. 1999. The role of solar radiation in atmospheric chemistry, In: Environmental Photochemistry. Berlin, Heidelberg: Springer, pp. 1–26.
- Marécal, V., Pirre, M., Riviere, E., Pouvesle, N., Crowley, J. and co-authors. 2010. Modelling the reversible uptake of chemical species in the gas phase by ice particles formed in a convective cloud. Atmos. Chem. Phys. 10, 4977–5000. doi:https://doi.org/10.5194/acp-10-4977-2010
- Martinez, M., Harder, H., Kubistin, D., Rudolf, M., Bozem, H. and co-authors. 2010. Hydroxyl radicals in the tropical troposphere over the Suriname rainforest: airborne measurements. Atmos. Chem. Phys. 10, 3759–3773. doi:https://doi.org/10.5194/acp-10-3759-2010
- McFiggans, G., Mentel, T. F., Wildt, J., Pullinen, I., Kang, S. and co-authors. 2019. Secondary organic aerosol reduced by mixture of atmospheric vapours. Nature 565, 587–593. doi:https://doi.org/10.1038/s41586-018-0871-y
- Merikanto, J., Spracklen, D., Mann, G., Pickering, S. and Carslaw, K. 2009. Impact of nucleation on global CCN. Atmos. Chem. Phys. Discuss. 9, 8601–8616.
- Mohr, C., Lopez-Hilfiker, F. D., Yli-Juuti, T., Heitto, A., Lutz, A. and co-authors. 2017. Ambient observations of dimers from terpene oxidation in the gas phase: Implications for new particle formation and growth. Geophys. Res. Lett. 44, 2958–2966. doi:https://doi.org/10.1002/2017GL072718
- Murphy, B. N., Julin, J., Riipinen, I. and Ekman, A. M. 2015. Organic aerosol processing in tropical deep convective clouds: Development of a new model (CRM-ORG) and implications for sources of particle number. J. Geophys. Res. Atmos. 120, 10–441.
- Olenius, T., Yli-Juuti, T., Elm, J., Kontkanen, J. and Riipinen, I. 2018. New particle formation and growth: Creating a new atmospheric phase interface, In: Physical Chemistry of Gas-Liquid Interfaces. Elsevier, pp. 315–352.
- Paulot, F., Crounse, J. D., Kjaergaard, H. G., Kürten, A., Clair, J. M. S. and co-authors. 2009b. Unexpected epoxide formation in the gas-phase photooxidation of isoprene. Science 325, 730–733. doi:https://doi.org/10.1126/science.1172910
- Paulot, F., Crounse, J., Kjaergaard, H., Kroll, J., Seinfeld, J. and co-authors. 2009a. Isoprene photooxidation: new insights into the production of acids and organic nitrates. Atmos. Chem. Phys. 9, 1479–1501. doi:https://doi.org/10.5194/acp-9-1479-2009
- Pollack, I., Homeyer, C., Ryerson, T., Aikin, K., Peischl, J. and co-authors. 2016. Airborne quantification of upper tropospheric NOx production from lightning in deep convective storms over the United States Great Plains. J. Geophys. Res. Atmos. 121, 2002–2028. doi:https://doi.org/10.1002/2015JD023941
- Ruggaber, A., Dlugi, R. and Nakajima, T. 1994. Modelling radiation quantities and photolysis frequencies in the troposphere. J. Atmos. Chem. 18, 171–210. doi:https://doi.org/10.1007/BF00696813
- Sander, R. 2015. Compilation of Henry’s law constants (version 4.0) for water as solvent. Atmos. Chem. Phys. 15, 4399–4981. doi:https://doi.org/10.5194/acp-15-4399-2015
- Savre, J., Ekman, A. M. L. and Svensson, G. 2014. Introduction to MIMICA, a large-eddy simulation solver for cloudy planetary boundary layers. J. Adv. Model. Earth Syst. 6, 630–649. doi:https://doi.org/10.1002/2013MS000292
- Schobesberger, S., Junninen, H., Bianchi, F., Lönn, G., Ehn, M. and co-authors. 2013. Molecular understanding of atmospheric particle formation from sulfuric acid and large oxidized organic molecules. Proc. Natl. Acad. Sci. USA. 110, 17223–17228. doi:https://doi.org/10.1073/pnas.1306973110
- Schulz, C., Schneider, J., Amorim Holanda, B., Appel, O., Costa, A. and co-authors. 2018. Aircraft-based observations of isoprene-epoxydiol-derived secondary organic aerosol (IEPOX-SOA) in the tropical upper troposphere over the Amazon region. Atmos. Chem. Phys. 18, 14979–15001. doi:https://doi.org/10.5194/acp-18-14979-2018
- Smagorinsky, J. 1963. General circulation experiments with the primitive equations: I. The basic experiment. Mon. Wea. Rev. 91, 99–164. doi:https://doi.org/10.1175/1520-0493(1963)091<0099:GCEWTP>2.3.CO;2
- Sokolov, O. and Abbatt, J. 2002. Adsorption to ice of n-alcohols (ethanol to 1-hexanol), acetic acid, and hexanal. J. Phys. Chem. A. 106, 775–782. doi:https://doi.org/10.1021/jp013291m
- Surratt, J. D., Chan, A. W., Eddingsaas, N. C., Chan, M., Loza, C. L. and co-authors. 2010. Reactive intermediates revealed in secondary organic aerosol formation from isoprene. Proc. Natl. Acad. Sci. USA. 107, 6640–6645. doi:https://doi.org/10.1073/pnas.0911114107
- Tan, Z., Lu, K., Hofzumahaus, A., Fuchs, H., Bohn, B. and co-authors. 2019. Experimental budgets of OH, HO 2, and RO 2 radicals and implications for ozone formation in the Pearl River Delta in China 2014. Atmos. Chem. Phys. 19, 7129–7150. doi:https://doi.org/10.5194/acp-19-7129-2019
- Taraborrelli, D., Lawrence, M., Crowley, J., Dillon, T., Gromov, S. and co-authors. 2012. Hydroxyl radical buffered by isoprene oxidation over tropical forests. Nature Geosci. 5, 190–193. doi:https://doi.org/10.1038/ngeo1405
- Teitelbaum, H. and D'Andrea, F. 2015. Deep convection east of the Andes Cordillera: four hailstorm cases. Tellus A: Dynamic Meteorology and Oceanography 67, 26806. doi:https://doi.org/10.3402/tellusa.v67.26806
- Thornton, J. A., Shilling, J. E., Shrivastava, M., D’Ambro, E. L., Zawadowicz, M. A. and co-authors. 2020. A near-explicit mechanistic evaluation of isoprene photochemical secondary organic aerosol formation and evolution: simulations of multiple chamber experiments with and without added NOx. ACS Earth Space Chem. 4, 1161–1181. doi:https://doi.org/10.1021/acsearthspacechem.0c00118
- Topping, D., Barley, M., Bane, M. K., Higham, N., Aumont, B. and co-authors. 2016. UManSysProp v1. 0: an online and open-source facility for molecular property prediction and atmospheric aerosol calculations. Geosci. Model Dev. 9, 899–914. doi:https://doi.org/10.5194/gmd-9-899-2016
- Tsui, W. G., Woo, J. L. and McNeill, V. F. 2019. Impact of aerosol-cloud cycling on aqueous secondary organic aerosol formation. Atmosphere 10, 666. doi:https://doi.org/10.3390/atmos10110666
- Twohy, C. H., Clement, C. F., Gandrud, B. W., Weinheimer, A. J., Campos, T. L. and co-authors. 2002. Deep convection as a source of new particles in the midlatitude upper troposphere. J. Geophys. Res. 107, AAC 6-1–6.
- Ullerstam, M., Thornberry, T. and Abbatt, J. P. 2005. Uptake of gas-phase nitric acid to ice at low partial pressures: evidence for unsaturated surface coverage. Faraday Discuss. 130, 211–226. doi:https://doi.org/10.1039/b417418f
- Wagner, N. L., Brock, C. A., Angevine, W. M., Beyersdorf, A., Campuzano-Jost, P. and co-authors. 2015. In situ vertical profiles of aerosol extinction, mass, and composition over the southeast United States during SENEX and SEAC 4 RS: observations of a modest aerosol enhancement aloft. Atmos. Chem. Phys. 15, 7085–7102. doi:https://doi.org/10.5194/acp-15-7085-2015
- Wang, C. and Chang, J. S. 1993. A three-dimensional numerical model of cloud dynamics, microphysics, and chemistry: 3. Redistribution of pollutants. J. Geophys. Res. 98, 16787–16798. doi:https://doi.org/10.1029/93JD01865
- Warneck, P. 1975. OH production rates in the troposphere. Planet. Space Sci. 23, 1507–1518. doi:https://doi.org/10.1016/0032-0633(75)90004-5
- Warneke, C., Holzinger, R., Hansel, A., Jordan, A., Lindinger, W. and co-authors. 2001. Isoprene and its oxidation products methyl vinyl ketone, methacrolein, and isoprene related peroxides measured online over the tropical rain forest of Surinam in March 1998. Journal of Atmospheric Chemistry 38, 167–185. doi:https://doi.org/10.1023/A:1006326802432
- Weigel, R., Borrmann, S., Kazil, J., Minikin, A., Stohl, A. and co-authors. 2011. In situ observations of new particle formation in the tropical upper troposphere: the role of clouds and the nucleation mechanism. Atmos. Chem. Phys. 11, 9983–10010. doi:https://doi.org/10.5194/acp-11-9983-2011
- Wennberg, P. O., Bates, K. H., Crounse, J. D., Dodson, L. G., McVay, R. C. and co-authors. 2018. Gas-phase reactions of isoprene and its major oxidation products. Chem. Rev. 118, 3337–3390. doi:https://doi.org/10.1021/acs.chemrev.7b00439
- Williamson, C. J., Kupc, A., Axisa, D., Bilsback, K. R., Bui, T. and co-authors. 2019. A large source of cloud condensation nuclei from new particle formation in the tropics. Nature 574, 399–403. doi:https://doi.org/10.1038/s41586-019-1638-9
- Zhao, B., Shrivastava, M., Donahue, N. M., Gordon, H., Schervish, M. and co-authors. 2020. High concentration of ultrafine particles in the Amazon free troposphere produced by organic new particle formation. Proc Natl Acad Sci U S A … 117, 25344–25351. doi:https://doi.org/10.1073/pnas.2006716117
- Zuend, A. and Seinfeld, J. 2012. Modeling the gas-particle partitioning of secondary organic aerosol: the importance of liquid-liquid phase separation. Atmos. Chem. Phys. 12, 3857–3882. doi:https://doi.org/10.5194/acp-12-3857-2012
- Zuend, A., Marcolli, C., Booth, A., Lienhard, D. M., Soonsin, V. and co-authors. 2011. New and extended parameterization of the thermodynamic model AIOMFAC: calculation of activity coefficients for organic-inorganic mixtures containing carboxyl, hydroxyl, carbonyl, ether, ester, alkenyl, alkyl, and aromatic functional groups. Atmos. Chem. Phys. 11, 9155–9206.
- Zuend, A., Marcolli, C., Luo, B. P. and Peter, T. A thermodynamic model of mixed organic-inorganic aerosols to predict activity coefficients, 2008.
Appendix A:
Elements of the matrix of the environmental conditions
Table A1. Coefficients aij used for meteorological interactions.
Appendix B:
Atmospheric trace gases reactions and their rates
Table B1. Photolysis reactions.
Table B2. Chemical reactions for the system components and their rates. Part 1.