
Abstract
Objective: Developing countries, including Tanzania, are increasingly characterised by undernutrition. It is very disheartening, affecting a large proportion of the country’s population. Women in the reproductive age group are affected the most. Undernourished women are likely to face reproductive health problems, leading to maternal and infant death. Thus, studying and eliminating undernutrition risk factors in women is very important in order to avoid maternal health complications and prevent infant illness and death. Therefore, this study focused on identifying the determinant factors of undernutrition in women of reproductive age, i.e. aged 15-49 years, on the Tanzania mainland, using the data extracted from the Tanzanian Demographic and Health Survey 2010.
Subjects and setting: Six thousand, nine hundred and thirty-three eligible non-pregnant women of reproductive age were selected from urban and rural areas on the Tanzania mainland.
Design: A cross-sectional study was conducted.
Outcome measures: An anthropometric measure (body mass index) was used to determine the prevalence of undernutrition and the generalised estimating equation (GEE) was adopted to assess the impact of the proposed determinants of undernutrition.
Results: It was shown from the findings of this study that overall prevalence of undernutrition was 11%. Also, the results from the fitted GEE revealed that the effect of age, the family’s wealth index and marital status were independent significant risk factors for undernutrition. The impact of education on undernutrition was significantly associated with place of residence.
Conclusion: There was a high prevalence of undernutrition in this study, with significant differences with respect to age, wealth index and marital status. In order to improve women’s nutritional status, policies should focus on improving family wealth and education.
Introduction
Undernutrition is considered to be one of the world’s most serious, but least addressed, health problems.Citation1 It incorporates underweight, wasting, stunting and deficiencies of essential minerals and vitamins. The evidence indicates that women with a body mass index (BMI) ≤ 18.5 kg/mCitation2 in developing countries are associated with a progressive increase in the mortality rate, and are at increased risk of illness.Citation2
In 1995, the World Health Organization approximated that 1 million adult deaths resulting from health problems were caused by overnutrition, and that half a million related to undernutrition.Citation3 Over one half of deaths of children aged ≤ 5 years in developing countries were caused by malnutrition.Citation4 Undernutrition is one of the most serious health problems affecting women of reproductive age, and is the single greatest cause of child mortality in Tanzania.Citation5 Despite the progress made in Tanzania between 1999 and 2010 in reducing child undernutrition, millions of children and women of reproductive age still suffer from different forms of undernutrition.Citation5
According to the findings of the Tanzania Demographic and Health Survey (TDHS) 2004/2005, 40% of children aged ≤ 5 years were short in relation to their age (i.e. stunted); an indicator of chronic undernutrition. Ten per cent of non-pregnant women, excluding those who gave birth two months prior to the survey, had undernutrition, while 48% of women aged 15-49 years were anaemic, of whom 1% were severely anaemic.Citation6
Although mothers are the main care providers for children and families, they ignore their own health, which results in undernutrition, making those who offer care vulnerable to undernutrition. The susceptibility of women to undernutrition throughout their reproductive lives has also been emphasised in several reviews.Citation7,Citation8
Malnutrition among women not only has a major impact on their own health, but also on their children’s.Citation9 A chronically undernourished woman is likely to give birth to an undernourished child, causing the cycle of undernutrition to be repeated over generations. Both social and biological factors are responsible for women being vulnerable to undernutrition throughout their lives in countries like Tanzania. Factors at individual, household and community level, or a combination thereof, also contribute to women’s health status. It was revealed in a study conducted in Ethiopia that age, marital status, wealth index, education, religion and region of residence were important determinants of undernutrition.Citation9
The Millennium Development Goal (MDG) of reducing maternal mortality by three-quarters between 1990 and 2015 (MDG 5) is highly related to women’s nutritional status. Poor maternal nutrition is associated with maternal ill health, a lack of resistance to infection by mothers, as well as poor maternal and childbirth outcomes. In order to resolve the challenge of maternal mortality, researchers have suggested the provision of emergency obstetric services using skilled birth attendants and effective referral systems.Citation10 Although the provision of improved obstetric care is very important, it is not enough to resolve the issue unless the nutritional status of poor women is also well addressed.
Little research has been conducted on the determinants of maternal nutritional status in Tanzania. This may be owing to a lack of relevant data at national level, and a limited number of researchers in the area. Most of the studies have only focused on the determinants of malnutrition in young children.Citation11–Citation13 Relative risk factors for undernutrition among women of reproductive age in Tanzania mainland were considered in the present study, which was based on a dataset from the TDHS 2010. This constitutes an important contribution in minimising the research gap. It has important policy consequences from a global health perspective, as well as from the specific viewpoint of Tanzania. The study may help with assessing the progress made by countries in achieving the 2005-2015 MDGs and the African Regional Nutrition Strategy from a global health standpoint. At country level, the study helps government and other health stakeholders to ascertain where to allocate limited resources to improve the nutritional and health status of the general population, women and infants.
Method
Data description
The present study was based on the data extracted from the TDHS 2010, with reference to 6 933 eligible non-pregnant women aged 15-49 years.Citation14 BMI was used as an indicator to assess undernutrition in the study groups.
This study adopted the sampling design and sample size from the TDHS 2010. The TDHS 2010 sample was designed to provide estimates on important indicators, such as family welfare, maternal and child health, nutrition, and family life and education for urban and rural areas of the Tanzania mainland, as well as Zanzibar. The sample design allowed an estimation of indicators in all of the 26 regions.
A representative probability sample of 10 300 households was selected for the TDHS 2010. The sample was selected in two stages. In the first stage, 475 clusters were selected from a list of enumeration areas in the 2002 population and housing census. Twenty-five sample points were selected in Dar es Salaam, and 18 in each of the remaining 20 regions on the Tanzania mainland. Eighteen clusters were selected in each region in Zanzibar for a total of 90 sample points.
In the second stage, a complete household listing was carried out in all of the selected clusters between July and August 2009. The households were then systematically selected for participation in the survey. Twenty-two households were chosen from each of the clusters in all of the regions, except for Dar es Salaam, where 16 households were selected.
Women aged 15-49 years, and who were either permanent residents or visitors present in the households on the night before the survey, were included in the TDHS 2010 sample. In the interviewed households, 10 522 women were identified for individual interviews. The present study included only non-pregnant eligible women aged 15-49 years from the Tanzania mainland, and whose BMI was known. This resulted in a sample size of 6 933 women extracted from 10 522 women in the TDHS 2010.
Measures
Anthropometry is a widely accepted technique for the evaluation of physical growth and the nutritional status of individuals. The four possible anthropometric indicators used to assess women’s chronic undernutrition are:
BMI ≤ 18.5 kg/m2 (thinness).
Height ≤ 145 cm.
Mid-arm circumference ≤ 22.5 cm.
Weight ≤ 45 kg.
The present study used BMI, defined as the ratio of weight (in kg) to height (in m2) as an indicator to assess women’s nutritional status.
The World Health Organization classifications for chronic under- nutrition were applied in this study, in which BMI was used to assess nutritional status:
Severely thin: ≤ 15.9 kg/m2
Moderately thin: 16.0-16.9 kg/m2
Thin: 17.0-18.4 kg/m2
Normal: ≥ 18.5 kg/m2.Citation15
Therefore, undernutrition refers to a BMI ≤ 18.5 kg/m2 in the analysis. The objective of this study was to examine the determinants of undernutrition in women of reproductive age on the Tanzania mainland, based on the dataset from TDHS 2010. Demographic and socio-economic variables used in the analysis were age, the family’s wealth index, marital status, education and place of residence. Definitions of the variables and respective codes used in this study are presented in .
Table I: Definitions of the variables (and their codes) used to determine undernutrition
Ethical considerations
Ethics approval was obtained from Tanzania’s National Institute for Medical Research, the Zanzibar Medical Research and Ethics Committee, the Institutional Review Board of ICF International, and the US Centers for Disease Control and Prevention. Informed consent for the survey was obtained from the respondents at the start of each individual interview. Respondents were not restricted to answer all questions during the interviews. In addition, a statement was read to them at the start of the domestic violence section, informing them that they were going to be asked questions which could be personal in nature as they explored different aspects of a relationship between a couple. Respondents were assured that their answers were confidential, would not be shared with anyone else and that no one else in the household would be asked the same questions.
Generalized estimating equation
Repeated measurements are usually taken from the same unit in clustered data. Thus, this information forms a cluster of correlated observations. For instance, the dependent variable (nutritional status) in the TDHS 2010 was measured once for each eligible woman (the unit of analysis) in the selected household, and the units of analysis were nested within the households (cluster of units). Proper analysis of the clustered data is required in modelling the association between the response variable and given set of covariates. Ignoring clustering in analyses may exaggerate the precision, and so the risk factors are reported as significant, even when this may not be correct.Citation16,Citation17 A generalised estimating equation (GEE) approach can be used for binary data to account for the correlation between the responses of interest from subjects in the same cluster.Citation18 The GEE approach is a non-likelihood method which uses correlation to capture the association within the clusters or subjects in terms of marginal correlations.Citation19 Since the present study utilised the multiple observations of women from the same household (thus likely to be closely correlated), GEE was used to identify the relative contribution of the selected independent variables to explain the total variance in the women’s nutritional status, while accounting for the correlation between responses of interest from subjects in the same cluster.
Results
Women’s nutritional status
Six thousand, nine hundred and thirty-three women of reproductive age from the Tanzania mainland were eligible for inclusion in the study. Undernutrition was reported in 11% of them. The percentage distribution of the nutritional status of non-pregnant women aged 15-49 years, according to selected demographic and socio- economic characteristics, is presented in .
Table II: Distribution of the nutritional status of women aged 15-49 years on the Tanzania mainland, according to background characteristics
A large proportion of the women (75%) were selected from the rural areas, of whom 13% were undernourished. A quarter (25%) of the sampled women were from urban areas, of whom 7% were undernourished. The proportion of women with undernutrition decreased dramatically using the family’s wealth index (from 17% of the women with the poorest economic status, to 6% of those with the wealthiest economic status). Just over two thirds of the women [67% (51% rural and 16% urban] had received a primary education, while 19% (17% rural and 2% urban) did not have any education. The rest 14% (7% rural and 7% urban) had attained secondary education or higher. Thirteen per cent of the women with no education were undernourished, and the proportion of undernourished women with primary and secondary or higher education was 11% and 8%, respectively. Women who had never married were reported to be the most affected by undernutrition, when compared to other groups. Of the women who had never married, 16% were chronically undernourished, whereas 10% of those who were widowed or divorced, or married or living together, were chronically undernourished. Of all the ages, the results showed that women aged 15-19 and 40-49 years were mostly affected, with a prevalence of 18% and 12%, respectively.
The level of women’s undernutrition, as determined by place of residence and education level, is shown in .
Figure 1: Percentage distribution of women on the Tanzania mainland with undernutrition, according to place of residence and education
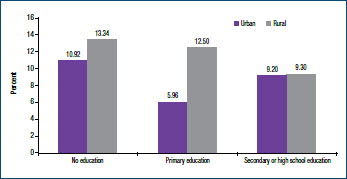
In rural areas, the prevalence of undernutrition among women with no an education (13%), was almost the same as that women with a primary education (13%). However in urban areas the prevalence of undernutrition was highest among women with no education (11%), followed by women with secondary or higher education (9%).
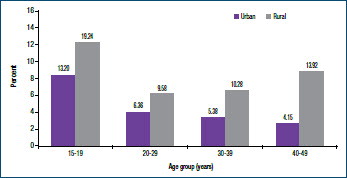
The level of undernutrition in women (rural and urban) by age group women is shown in . Regardless of age, a relatively large proportion of the women with undernutrition were rural. Of the women aged 15-19 years, 19% from rural and 13% from urban areas were chronically undernourished. Similarly, of the women aged 40-49 years, 14% from rural and 4% from urban areas were chronically undernourished. It was observed that the level of undernutrition in the rural areas declined sharply from the 15- to 19-year age group to the 20- to 29-year age group, then remained fixed in the 30- to 39-year age group. The level of undernutrition increased slightly in the age group of 40-49 years. By contrast, a sharply decreasing trend with an increase in age was observed with regard to the level of undernutrition in urban women.
Figure 2: Percentage distribution of the women with undernutrition, according to place of residence and age group
Generalized estimating equation
To assess the impact of the proposed predictors on undernutrition, GEE was used, as stated in the methodology. The results of the model are presented in the form of a regression parameter estimate and odds ratios (ORs). The estimated OR, determined by taking the exponent of the regression parameter estimates, determines the increase or decrease in the chances of undernutrition being present in individuals with respect to a given level of the independent variable, when compared to those in the reference category. An estimate of OR>1 indicates that the risk of undernution with respect to a given level of the independent variable is greater than that for the reference category. Similarly, an estimate of OR<1 specifies that the risk of undernutrition with respect to a given level of independent variable is less than that for the reference category.
The parameter estimates and empirical standard errors of the fitted model, using an exchangeable working assumption, are depicted in . This analysis adds to the descriptive statistics presented in by identifying the factors which significantly affected the likelihood of the women being undernourished.
Table III: Generalized estimating equation parameter estimates and empirical standard errors using an exchangeable working assumption
The findings revealed that all of the proposed predictors were significantly associated with women’s nutritional status. However, the effect of education on women living in urban areas was found to be significantly different when compared to the effect of education on women in rural areas. The findings of the study with respect to the risk factors for undernutrition are discussed as follows.
Risk factors for undernutrition
Age
Controlling the other factors in the model, the association of undernutrition with age was statistically significant. Women aged 20-29 and 30-39 years were less likely to suffer from undernutrition than women aged 15-19 and 40-49 years. An OR of 0.69 was reported for undernutrition in women aged 20-29 years, and an OR of 0.75 in women aged 30-39 years in comparison to women aged 40-49 years. The effect of age on women who were 15-19 years’ old, compared to the effect of age on those who were 40-49 years’ old, was not significant (p-value 0.131).
Wealth index
As has been shown from the results in , the proportion of women with undernutrition decreased dramatically as the family’s wealth index increased. The fitted model confirmed that women from families with the poorest economic status (OR of 4.55), poor economic status (OR of 3.07), middle-income status (OR of 2.93) and wealthy status (OR of 1.90) were significantly more likely to be affected by undernutrition than women with the wealthiest economic status.
Marital status
Women who had never married (OR of 1.73) were more likely to be undernourished than married women or those living with their partner. Although not significant (p-value 0.580), the prevalence of undernutrition in widowed or divorced women was lower than that in married women or those living together with their partner.
Education and place of residence
As indicated in , the results of the fitted model confirmed that the effect of education on women’s nutritional status differed in the urban and rural areas (p-value 0.012). Urban women with a primary education only (OR 0.75) were less likely to be affected by chronic undernutrition than women with a secondary or higher education. Although not significant (p-value 0.218), urban women with no education were more likely to experience undernutrition than women with secondary or higher education (OR of 1.08). By contrast, rural women without an education (OR of 1.77) or with a primary education (OR of 1.68) were significant more likely to experience undernutrition than women with secondary or higher education.
Discussion
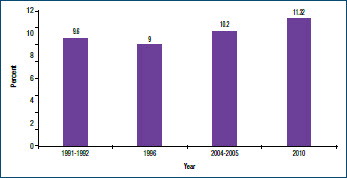
The third target of the MDG to eradicate extreme poverty and hunger was to halve the proportion of people with hunger by 2015. Based on the 2013 MDG report, one in eight people worldwide still did not consume enough food on a regular basis to obtain their minimum dietary energy requirements. The majority of undernourished people (852 million) reside in developing countries.Citation9 The underlying causes of welfare indicators, including nutritional outcome, are associated with poverty. According to the National accounts of Tanzania mainland 2001-2012, on average, Tanzania experienced a steady economic growth of 7%.Citation20 However, this growth is not reflected in the nutritional status of women of reproductive age at national level, as demonstrated by a general increase in the prevalence of undernutrition between 1996 and 2010 ().
Figure 3: Undernutrition prevalence in women aged 15-49 years on the Tanzania mainland from1991-2010
Thus, it is likely that the third target of the MDG to eradicate extreme poverty and hunger has not been met. It was reported that the prevalence of underweight in several countries in sub- Saharan Africa was decreasing. However, the opposite is true at present. For example, the prevalence of underweight in rural areas of Senegal decreased by 0.23% annually between 1992 and 2005, then increased by 1.60% for the same period between 2005 and 2010.Citation21 According to TDHS 2010, the prevalence of undernutrition in Tanzanian women of reproductive age is 11%. Based on the recent DHSs conducted between 2003 and 2011, when compared to the prevalence of undernutrition in other sub-Saharan African countries [i.e. Ethiopia (30%), Kenya (12%), Malawi (9%), Mozambique (9%), Rwanda (8%), Uganda (12%) and Zambia (10%)], the prevalence of undernutrition in Tanzania is below that of Ethiopia, Kenya, and Uganda. However it is higher than that of Malawi, Mozambique, Zambia and Rwanda.Citation22
It was found in this study that the household wealth index appeared to be an important determinant of nutritional status in women. As expected, the results from the fitted model confirmed that women with the poorest economic status were at the highest risk of undernutrition, when compared with their wealthy counterparts. Poverty is associated with poor housing and access to basic and social needs, including water and sanitation. Thus, poverty that leads to a scarcity of resources also results in low purchasing power with respect to adequate and nutritious food, resulting in macro- and micronutrient deficiencies and overall undernutrition. Therefore, measures to improve the nutritional status of women of reproductive age should include government action to support the poorest households, and the creation of rapid economic growth at national level, as this will reflect at household level.
An analysis of the relationship between the marital status of women and nutritional status indicated that those who had never married were more likely to be undernourished than those who were currently married or living with their partner. Similar findings were reported in Bangladesh.Citation23 Many married women are financially dependent on their partners. Thus, single women are economically disadvantaged, and less able to achieve food security and maintain optimum health on a sustainable basis.Citation24 Undernourished women who had never been married accounted for 26% of the total women in this study, and are likely to deliver children of low birthweight, as well as experience adverse maternal complications due to malnutrition. Single motherhood was associated with adverse effects on their children’s well-being, including poor nutritional status and a lower chance of survival between the age of 0-59 months, in studies from other regions, particularly the west.Citation24,Citation25 In addition, in many cases women who have never married occupy households of relatively poorer economic status than those of married women, making it more difficult for them to obtain sufficient food.Citation26
It was found that women aged 15-19 years, and those aged 40-49 years, were more likely to be undernourished than those aged 20- 29 and 30-39 years. The results of the fitted model also confirmed that women aged 15-19 and 40-49 years were significantly more affected by undernutrition than women aged 20-29 and 30-39 years. Adolescent women often have no or little power in decision- making about food distribution in the household, and can be marginalised, leading to poor nutritional status. Lack of awareness among adolescent women about their own health and nutritional status is another reason why their nutritional status is poor.Citation9 In addition, early sexual activity and associated health problems, such as the termination of pregnancy and miscarriage, also endanger the nutritional status of adolescent women.Citation27 The high risk of undernutrition in older women in rural areas is associated with many contributing factors. Generally, older women have relatively higher- level parity (more children ever born), obligating them to take care of their children, rather than protecting their own health and nutritional status, given the limited household resources. Similar results were found in other studies in Ethiopia.Citation9,Citation27 A detailed investigation into the dietary habits and physical activities of these population groups is required.
The effect of education as a predictor of nutritional status in the general population was not significant. However, it appeared to depend upon the place of residence. In this study, the results of the fitted model illustrated that urban women with a primary education only were less likely to be affected by chronic undernutrition than women with secondary or higher education. This may be owing to the fact that most women with a primary education only in urban areas are mothers (housewives). As secondary and higher educated women are likely to be employed, their responsibilities as workers, mothers and wives tends to increase, which may affect the time taken to care for themselves. Stress also negatively affects psychological well-being and nutritional status.
Unlike women residing in urban areas, those with or without a primary education in the rural areas were more likely to be undernourished than those in the rural areas with a secondary or higher education. This may be because women without an education or with primary education only in the rural areas were housewives with responsibility for the agricultural activities, and fetching water and wood for cooking, in addition to their responsibilities as mothers and wives. Rural women are also more likely to have more children, and to be less aware of their health status. These results are consistent with those reported by Teller and Yimar,Citation28 and Hazarika et al.Citation29 Thus, further exploration of the causes and patterns of variation with respect to the impact of education on the nutritional status on women of reproductive age in Tanzania would be worthwhile.
Conclusion
While the focus of attention in the field of nutrition continues to be on a substantial proportion of women with chronic energy deficiency, the problem of undernutrition cannot be ignored. A substantial incidence of overweight or obese, together with a continuing high level of undernutrition, has resulted in a dual nutrition burden on the state. This study revealed that the prevalence of undernutrition can be predicted in women according to age, the family’s wealth index, marital status, place of residence and educational level.
Acknowledgements
The authors thank the Tanzania National Bureau of Statistics for making the TDHS available, and thereby enriching the research findings.
References
- Sun Movement. Scaling up nutrition: a framework for action. Sun Movement [homepage on the Internet]. 2011. Available from: http://scalingupnutrition.org/wp-content/uploads/pdf/SUN_Framework.pdf
- Rotimi C, Okosun I, Johnson L, et al. The distribution of chronic energy deficiency among adult Nigerian men and women. Eur J Clin Nutr.1999;53(9):734–739. doi: 10.1038/sj.ejcn.1600842
- World Health Organization. Physical status: the use and interpretation of anthropometry. Geneva: WHO, 1995.
- Pelletier DL, Frongillo EA, Schroeder DG, Habicht JP. The effects of malnutrition on child mortality in developing countries. Bull World Health Organ. 1995;73:(4):443–448.
- United Republic of Tanzania. National nutritional strategy, July 2011/2012-June 2015/2016. Dar es Salaam: Ministry of Health and Social Welfare, 2011.
- Tanzania National Bureau of Statistics, Macro International. Tanzania demographic and health survey, 2004–2005. Calverton: NBS: 2005.
- Tinker A, Daly P, Green C, et al. Women’s health and nutrition. Washington DC: World Bank, 1995.
- Merchant KM, Kurtz KM. Women’s nutrition through the life cycle: social and biological vulnerabilities. In: Marge Koblinsky, Judith Timyan and Jill Gay, editors. The health of women: a global perspective. Boulder: Westview Press, 1993; p. 63–90.
- Bitew FH, Telake DS. Undernutrition among women in Ethiopia: rural-urban disparity. Calverton: ICF Macro, 2010.
- Ronsmans C, Collin S, Filippi V. Maternal mortality in developing countries. In: Semba RD, Bloem MW editors. Nutrition and health: nutrition and health in developing countries. 2nd ed. Totowa: Humana Press, 2008.
- Sichona FJ. Family structures and children’s nutritional status in Tanzania. Tanzania Journal of Population Studies and Development. 2001;8(1–2):91–109.
- Kandala NB, Lang S, Klasen S, Fahrmier L. Semiparametric analysis of the socio-demographic and spatial determinants of undernutrition in two African countries [homepage on the Internet]. 2001. c2015. Available from: https://epub.ub.uni-muenchen.de/1626/1/paper_245.pdf.
- Leach V, Kilama B. Preventing malnutrition in Tanzania: a focused strategy to improve nutrition in young children. Policy Research for Development [homepage on the Internet]. 2009. c2015. Available from: http://dspace.africaportal.org/jspui/bitstream/123456789/33073/1/brief_15-repoa.pdf.
- Mukuria A, Aboulafia C, Themme A. The context of women's health: results from the Demographic and Health Surveys, 1994–2001. Calverton: ORC Macro, 2005.
- Administration Committee on Coordination Subcommittee on Nutrition. Second report on the world nutrition situation. Geneva: United Nations, 1992.
- Bennett S, Woods T, Liyanage WM, Smith DL. A simplified general method for cluster-sampling surveys of health in developing countries. World Health Stat Q. 1991;44(3):98–106.
- Faes C, Hens N, Aerts M, et al. Estimating herd-specific force of infection by using random-effects models for clustered binary data and monotone fractional polynomials. Journal of Royal Statistical Society. 2006;55(5):595–613. doi: 10.1111/j.1467-9876.2006.00555.x
- Diggle PJ, Liang KY, Zeger SL. Analysis of longitudinal data. Oxford: Claredon Press, 1994.
- Molenberghs G, Verbeke G. Models for discrete longitudinal data. New York: Springer, 2005.
- The United Republic of Tanzania. National accounts of Tanzania mainland 2001–2012. Dar-es-Salaam: National Bureau of Statistics, Ministry of Finance, 2013.
- Jaacks LM, Slining MM, Popkin BM. Recent underweight and overweight trends by rural-urban residence among women in low- and middle-income countries. J Nutr. 2014;145(2):352–357. doi: 10.3945/jn.114.203562
- Sanderson AM, Auricht C. An overview of population undernutrition in a selection of countries in eastern and southern Africa. Perth: Australian International Food Security Centre, 2012.
- Kamal M, Islam A. Socio-economic correlates of malnutrition among married women in Bangladesh. Mal J Nutr. 2010;16(3):349–359.
- Thomson E, Hanson TL, Mclanahan SS. Family structure and child wellbeing: economic resources vs parent behaviors. Soc Forces. 1994;73:221–242. doi: 10.1093/sf/73.1.221
- Bramlett MD, Blumberg SJ. Family structure and children's physical and mental health. Health Aff (Millwood). 2007;26(2):549–558. doi: 10.1377/hlthaff.26.2.549
- Lipowicz A, Gronkiewicz S, Malina RM. Body mass index: overweight and obesity in married and never married men and women in Poland. Am J Hum Biol. 2002;14(4):468–475. doi: 10.1002/ajhb.10062
- Girma W, Genebo T. Determinants of nutritional status of women and children in Ethiopia. Calverton: ORC Macro, 2002.
- Teller CH, Yimar G. Levels and determinants of malnutrition in adolescent and adult women in Southern Ethiopia. Ethiopian Journal of Health Development. 2000;14(1):57–66.
- Hazarika J, Saikia I, Hazarika PJ. Risk factors of undernutrition among women in the reproductive age group of India. American-Eurasian Journal of Scientific Research. 2012;7(1)5–11.