
 ?Mathematical formulae have been encoded as MathML and are displayed in this HTML version using MathJax in order to improve their display. Uncheck the box to turn MathJax off. This feature requires Javascript. Click on a formula to zoom.
Abstract
Objectives: A study was undertaken to quantify added sugar intake; to show the association between added sugar intake and body mass index (BMI); and to identify determinants of added sugar and sugar-sweetened beverage (SSB) intake.
Design: This was a cross-sectional study.
Subjects: Non-probability sampling was used to recruit a sample of 387 undergraduate students, aged 18–25 years: 128 males and 259 females.
Setting: The study was conducted at the University of KwaZulu-Natal, Pietermaritzburg campus.
Outcome measures: BMI was calculated using weight and height. The mean added sugar and dietary energy intake was measured using a 24-hour dietary recall. The frequency and mean amount of added sugars consumed was analysed using a food frequency questionnaire.
Results: Females (66.1%), Black Africans (90.4%), and students living away from home (76.7%) formed the majority of the study sample. The prevalence of overweight and obesity was 19.1% and 8.5%, respectively, with 64.9% of students having a normal BMI. There was a significant association between the frequency of consuming flavoured milks, hot chocolate drinks, jam and chocolate bars and BMI. Female students and those living at home consumed added sugars significantly more frequently than their counterparts. Taste and price were significantly associated with purchasing/consuming SSBs.
Conclusion: A significant association between the frequency of consuming certain food items containing added sugar and the students’ BMI was observed. Poor dietary habits could impact negatively on an individual's weight status, thus highlighting the need for strategies to promote healthier dietary and lifestyle behaviours among young adults.
Introduction
Worldwide, the increased prevalence of overweight and obesity has become a major health problem, accounting for approximately 2.8 million deaths each year.Citation1 According to a systematic analysis that was conducted on the prevalence of overweight and obesity among adults and children worldwide, the number of overweight and obese individuals had increased from 921 million to 2.1 billion between the years 1980 and 2013.Citation2 Being overweight or obese increases the risk of developing non-communicable diseases.Citation1 The prevalence of overweight and obesity has progressively increased among students attending nationalCitation3–6 and international universities.Citation7–9 A meta-analysis of 32 studies conducted among first-year university students found that more than half gained an average of 3.38 kg during their first year.Citation10 Similarly, a significant overall weight gain of 8.5 kg and a BMI increase of 3.3 kg/m2 was observed among Malawian students.Citation11
The causes of overweight and obesity are complex; however, recent studies have indicated that changes in dietary and lifestyle habits are often responsible for the increase in these conditions.Citation12 University students are vulnerable to these changes, as the transition to tertiary education requires various adjustments that have an impact on their dietary and lifestyle habits.Citation10 Students who live away from home are required to make their own dietary choices, but a lack of sound dietary knowledge can lead them to adopt poor dietary and lifestyle behaviours.Citation10 Previous studies conducted at South African universities have shown that students often adopt sedentary behaviour and consume a diet that is low in fruit and vegetables and high in added sugar and fat.Citation3,Citation4 Various internal and external factors tend to influence the dietary and lifestyle habits of university students.Citation13 Therefore, in order to improve these habits, it is important to assess their dietary intake and determine the factors that influence their dietary and lifestyle habits.Citation13
The increased consumption of sugar-sweetened beverages (SSBs) has raised much concern regarding their impact on health,Citation14 as they contain empty calories, have a low satiety and facilitate an increased intake of foods that have very little or no nutritional value.Citation15 Thus, the increased consumption of SSBs has been associated with the possible development of overweight and obesity.Citation14 Sugar-sweetened beverages contribute a significant amount of added sugars to the total energy intake,Citation16 as a 330 ml can of a carbonated beverage or fruit juice contains approximately 8–9 teaspoons of sugar.Citation16
There is a dearth of literature discussing the dietary intake of added sugars among university students in South Africa. Although nationalCitation3–5 and internationalCitation7–9 studies have assessed the dietary habits of university students, only a few studies have specifically assessed the added sugar intake and its influence on their body mass index (BMI).
The purpose of this study was to determine the prevalence of overweight and obesity among undergraduate university students; to quantify their added sugar intake and any association between the frequency of consumption of added sugars and BMI; to determine the differences in added sugar intake across gender, race and place of residence; and to determine the factors related to the purchase/consumption of SSBs.
Method
Study design, sampling and sample size determination
A cross-sectional study was conducted on undergraduate students of all races, aged between 18 and 25 years, attending the University of KwaZulu-Natal (UKZN), Pietermaritzburg, in 2016. Students were selected on the following basis: Did they consume foods and beverages containing added sugar and were they involved in purchasing the foods and beverages that they consumed? Non-probability sampling was used to recruit the students from a sampling frame of 2 253 registered students.Citation17 Students were recruited by word-of-mouth and flyers that were distributed around the campus. The sample size was calculated using Cochran's sample size formulaCitation18 (with the correction for population size) for categorical data. Convenience sampling was thereafter used to obtain the required sample number (n0) as calculated. This formula uses a 95% confidence interval with an accepted margin error of 0.05 (d), alpha at 0.05 , with the population number being used for the calculation.
p = maximum possible proportion (0.5); q = one minus maximum possible proportion (1 − p = 0.5).
n1 = final sample size; n0 = sample size according to Cochran's formula; population size = actual population size from which the sample will be drawn (n = 2 253).Citation17
An estimated sample size of 329 was obtained and 20% was added to this figure to compensate for those with incomplete data (n = 395). Of the original sample of 395 students who agreed to participate, eight did not complete the questionnaire; therefore, the results from 387 students were included in the analysis.
Data collection
Data were collected using a three-part questionnaire that consisted of open-ended and closed questions. Part One of the questionnaire consisted of three sections: Section One was used to assess the students’ weight and height, with measurements being taken and recorded by trained fieldworkers. Sections Two and Three were completed by the students: Section Two assessed the students’ demographics and Section Three assessed the factors relating to the purchases/consumption of SSBs. Parts Two and Three assessed the dietary intake of the students using a Food Frequency Questionnaire (FFQ) and a 24-hour dietary recall. The students completed the FFQ and the trained fieldworkers administered the 24-hour dietary recall.
The FFQ consisted of two sections: the first section measured the amount of added sugars consumed and the second measured the frequency of their consumption. A total of nine food and beverage groups were included, and 50 items were listed. This list was based on the food items that were sold at, or around, the university; as well as data obtained from a narrative review that assessed the dietary habits of South African adults between the year 2000 and 2015;Citation19 and food items that were listed in studies conducted at local universities.Citation3,Citation4 The FFQ was constructed under the guidance of a statistician and the layout was based on published studies that assessed the dietary intake of university students.Citation3,Citation4,Citation11
The 24-hour dietary recall consisted of three meals and three snacks, with students reporting the type and amount of foods and beverages consumed, as well as the preparation method. A list of food groups (starch, starchy vegetables, breakfast cereals, vegetables, fruit, dairy, meat and meat substitutes, hot and cold beverages, sauces, oils, spreads, table sugar and milk flavourings, confectionery items, sweets, chocolates, savoury snacks and chips, and desserts) were included in the 24-hour dietary recall to assist with reporting and to ensure that students recorded all items consumed. The 24-hour dietary recall was constructed under the guidance of a statistician with the layout being based on published studies that assessed the dietary intake of university students.Citation3,Citation4 For the purpose of this study, a single 24-hour dietary recall was used to assess the mean added sugar intake; dietary energy intake; percentage contribution of added sugars to the total dietary energy intake; differences in the mean consumption based on gender, race and place of residence; and differences in the mean consumption across individual students’ BMI.
Food groups included in the FFQ and 24-hour dietary recall were adapted from the South African Food Based Dietary GuidelinesCitation20 as well as the Diabetic Exchange List, compiled by the American Dietetic Association.Citation21 Students were also provided with a pictorial representation of various foods and beverages to assist with quantifying portion sizes while completing the FFQ and 24-hour dietary recall. The pictorial guide was designed using household food measurements found on MRC Food Finder 3 (Medical Research Council, South Africa), as per quantities found in the MRC Food Quantities Manual.Citation22
Anthropometric measurements
Weight and height were taken using a standardised procedureCitation23 with each measurement repeated three times and the mean calculated. Bodyweight was measured using a calibrated, portable SECA 813 electronic flat scale (Seca GmbH, Hamburg, Germany), and recorded to the nearest 0.1 kg. Height was measured using a calibrated free-standing, portable SECA 213 height measure, and recorded to the nearest 0.5 cm. The BMI was calculated using mean weight and height measurements and was categorised as follows: Underweight (BMI < 18.5 kg/m2), Normal Weight (BMI 18.5–24.9 kg/m2), Overweight (BMI 25–29.9 kg/m2), Obese Class I (BMI 30–34.9 kg/m2), Obese Class II (BMI 35–39.9 kg/m2) and Obese Class III (BMI ≥ 40 kg/m2).Citation13
Ethical considerations
Ethics approval was received from the Human and Social Sciences Research Ethics Committee (HSS/0175/016M) and gatekeeper's approval was obtained from the UKZN Registrar. Only students who provided written informed consent were included in this study.
Statistical analysis
The data were analysed using the Statistical Package for Social Sciences Version 21 (IBM Corp, Armonk, NY, USA). The results were presented as percentages, frequencies and means. A p-value of less than 0.05 was considered to be statistically significant. The chi-square test of independence was used to determine the association between the place of residence and the demographic characteristics of the students as well as the association between the BMI categories and gender.
MRC Food Finder 3 was used to quantify the added sugar intake from the 24-hour dietary recall. Descriptive statistics was used to determine the frequency of consuming each item listed in the FFQ using the responses under the section titled ‘How often consumed’. The mean consumption of each item listed in the FFQ was calculated using grouped data for each of the responses under the section titled ‘How much consumed’.
The independent sample t-test was used to determine whether the mean added sugar intake, dietary energy intake and percentage contribution of added sugars to the total dietary energy intake differed significantly across gender. Analysis of variance (ANOVA) was used to determine whether the mean added sugar intake, dietary energy intake and percentage contribution of added sugars to the total dietary energy intake differed significantly for the categories of race and place of residence. The consumption frequency of added sugars across each demographic variable was quantified in order to calculate a mean rank. Wilcoxon’s signed rank test was then used to investigate whether the mean rank of consumption of the food and beverage groups was significantly different for the categories of gender and place of residence. The Kruskal–Wallis test was used to investigate whether the mean rank of consumption of the food and beverage groups differed significantly across the categories of race.
ANOVA was used to determine whether the mean added sugar intake, dietary energy intake and percentage contribution of added sugars to the total dietary energy intake was significantly different across the students’ BMI categories. The chi-square test of independence was used to determine whether there was any significant association between the BMI categories and the frequency of consuming food items containing added sugar.
A one-sample t-test was used to determine if significant importance was given to the factors that relate to the purchases/consumption of SSBs, and mean scores were used to determine which factors were considered more important when purchasing/consuming SSBs. The chi-square goodness-of-fit test was used to determine which, if any, of the consumption characteristics were selected significantly more than the others.
Results
Demographic characteristics
Data from 387 students were analysed in this study. Most of the students were female (66.9%, n = 259) and from the Black African race group (90.4%, n = 350) (). More than half of the students were reported to live away from home (76.7%, n = 297) during the semester. A significantly greater proportion of students lived at residences on campus (47.3%, n = 183, chi-square (3) = 126.230, p < 0.05) than at home or in other accommodation.
Table 1: Students’ place of residence across their demographic characteristics
There was no significant difference between the distribution of male and female students according to their place of residence. Across race and the place of residence, a significant proportion of Indian and Coloured students reported living at home, while a significant proportion of Black African students reported living in a residence on campus, and a significant proportion of White students lived in a type of lodging that consisted of a room with shared facilities.Citation24
Body mass index of the students
A significant proportion of the students were classified as having a normal BMI (64.9%, n = 251, chi-square (3) = 695.217, p < 0.0005), rather than being underweight (7.5%, n = 29), overweight (19.1%, n = 74) or obese (8.5%, n = 33). A significantly higher proportion of male than female students had a normal BMI classification (77.3%, n = 99 and 58.7%, n = 152, respectively), and the prevalence of overweight and obesity was significantly higher among the female than male students (22.0%, n = 57; 11.6%, n = 30 and 13.3%, n = 17; 2.3%, n = 3, respectively) (p = 0.001). The proportion of underweight students was similar across both genders (males: 7.0%, n = 9 and females: 7.7%, n = 20).
Added sugar intake
The mean added sugar and dietary energy intake from the 24-hour dietary recall was 56.8 g and 6 796.0 kJ, respectively. On average, added sugars contributed 14.2% to the total energy intake.
A total of 50 foods and beverages containing added sugars were used to analyse the frequency and mean consumption of added sugars. represents only those food/beverage items that were consumed by a larger proportion of the students. Each response listed under the section titled ‘How often consumed’ (‘Never’, ‘Less than once a month’, ‘About once a month’, ‘1–2 times per week’, ‘3–6 times per week’, ‘Daily, but just once a day’ and ‘Daily, but more than once a day’) were quantified in order to determine the frequency of consumption. The mean amount (grouped mean) consumed by the students was quantified using the responses under the section titled ‘How much consumed’. Each food and beverage group consisted of appropriate household food measures, which were quantified in order to calculate the mean amount of each item that was consumed per serving.
Table 2: Frequency and mean amount of added sugars consumed from the items listed in the FFQ
Carbonated soft drinks and juice concentrates were most frequently consumed by the students, and of those that consumed these beverages, almost one-third consumed juice concentrates (29.2%, n = 113) on a daily basis and carbonated soft drinks (29.5%, n = 114) on a weekly basis. Carbonated soft drinks, 100% fruit juices and juice concentrates were consumed by most of the students, the mean amount being 250–500 ml.
Table sugar was the most frequently consumed item in the table sugar and milk powder group, with 46.0% (n = 178) reporting that they consumed it on a daily basis. On average the students consumed 6–12 g of table sugar per serving. In the sauce group, mayonnaise and tomato sauce were consumed by most of the students, and on average the students consumed 7–14 g per serving. Cornflakes was the most frequently consumed breakfast cereal, and 28.2% (n = 109) reported that they consumed it on a daily basis. On average the students consumed 55–110 g per serving. A low frequency of consumption was observed for the items listed under the spreads, desserts, cakes and biscuits, chocolates, and sweets groups.
Association between added sugar intake and BMI
The mean added sugar intake, dietary energy intake and percentage contribution of added sugars to the total dietary intake across the BMI categories is presented in . Underweight students had a higher mean added sugar intake as well as percentage contribution of added sugars to the total dietary energy intake, and the overweight/obese students had a higher mean dietary energy intake. However, the mean added sugar intake (p = 0.511), dietary energy intake (p = 0.668) and percentage contribution of added sugars to the total dietary energy intake (p = 0.639) did not differ significantly across the BMI categories (underweight, normal, overweight/obese).
Table 3: Mean added sugar intake, energy intake and percentage contribution of added sugars to the total dietary energy intake across the BMI categories
A significant relationship was found between the BMI categories and the frequency of consuming the food and beverage items listed in . A significant proportion of those who consumed flavoured milk ‘at most once a month’ were underweight, while a significant proportion of those who consumed this beverage ‘daily’ had a normal BMI. With regard to hot chocolate drinks, a significant proportion of those that consumed it ‘weekly’ were underweight, while a significant proportion of those that consumed these drinks ‘at most once a month’ were overweight/obese. A significant proportion of the students who consumed jam ‘daily’ were either underweight or overweight/obese. A significant proportion of the students who consumed chocolate bars ‘at most once a month’ were underweight, while a significant proportion of those who consumed these chocolate bars ‘weekly’ were overweight/obese.
Table 4: Frequency of consumption of added sugars from the FFQ across the BMI categories
Added sugar intake across the demographic characteristics of the students
The mean added sugar intake (p = 0.129) and percentage contribution of added sugars to the total dietary energy intake (p = 0.653) did not differ significantly across gender. However, the mean dietary energy intake was significantly higher among the male (7374.31 ± 3508.23 kJ/day) than female students (6510.11 ± 3708.91 kJ/day) (p = 0.029). With regard to race, a comparison could not be made as only 2 White, 8 Coloured and 27 Indian students participated in the study; therefore, the statistical power was insufficient for group comparisons. The mean added sugar intake (p = 0.456), dietary energy intake (p = 0.880) and percentage contribution of added sugars to the total dietary energy intake (p = 0.125) did not differ significantly across the students’ place of residence.
The frequency of consuming the desserts (p = 0.003), cakes and biscuits (p = 0.013), chocolates (p = 0.001), and sweets (p = 0.017) groups was significantly higher among the female than the male students. Students living at home consumed spreads (p = 0.003) and desserts (p = 0.023) significantly more frequently than those living away from home. A comparison could not be made regarding race as the statistical power was insufficient for group comparisons.
Factors related to the consumption/purchases of SSBs
indicates the students’ ratings for the factors that could be related to the purchases/consumption of SSBs. Students were required to rate how important these factors were when purchasing/consuming SSBs. A rating scale from 1 to 5 was used, where Rating 1 was considered to be not important at all and Rating 5 was considered to be extremely important. Taste and price were considered as factors of significant importance when purchasing/consuming SSBs, and factors relating to the marketing and labelling of the product as well as social influences (friends and family) were shown to be of significantly lower importance.
Table 5: Level of importance of each factor in the purchases/consumption of SSBs
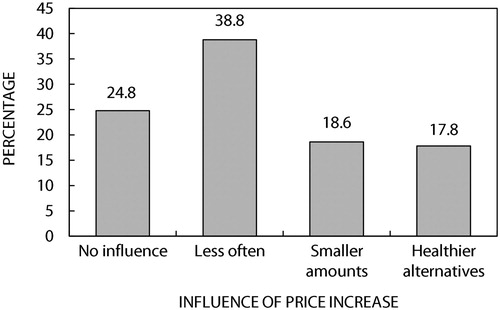
This study also investigated the association with price increases as a result of an impending sugar tax on the students’ intention to purchase/consume SSBs. A significant proportion of the students (n = 150; 38.8%), chi-square (3) = 43.605, p < 0.05) indicated that if the price of such beverages increased, they would purchase and/or consume them less often and only 17.8% (n = 69) reported that they would purchase and/or consume healthier alternatives ().
Figure 1: Influence of a price increase on the subjects’ intention to consume/purchase SSBs.
Discussion
BMI classification of university students
More than half of the students were within a normal BMI classification (64.9%), approximately one-third were overweight or obese (19.1% and 8.5%, respectively) and 7.5% were underweight. These findings correspond with other cross-sectional studies that were conducted among students attending nationalCitation3,Citation4,Citation6 and internationalCitation7–9 universities.
A significantly higher percentage of the male (77.3%) than female students were within the normal BMI classification, whereas female students were significantly more overweight and obese than their male counterparts (22.0%, n = 57; 11.6%, n = 30 and 13.3%, n = 17; 2.3%, n = 3, respectively). Studies conducted at other South African universities (with a similar gender distribution to that of the UKZN study) have also indicated a higher prevalence of overweight and obesity among female than male students (Eastern Cape 58.2% vs. 31.4%Citation3, Free State 22.1% vs. 12.8%Citation4, and LimpopoCitation6 30.5% vs. 8.7%, respectively), and that more male than female students were classified as having a normal BMI (Eastern Cape 58.8% vs. 40%Citation3, Free State 87.2% vs. 67.2%Citation4, and Limpopo 76.1% vs. 56.5%Citation6, respectively). Factors such as culture, socioeconomic status and nutrition transition could be responsible for the gender differences in being overweight and obese.Citation25,Citation26
Added sugar intake of university students
The mean percentage contribution of added sugars to the total dietary energy intake exceeded the WHO recommendations.Citation27 However, these results should be interpreted with caution because a single 24-hour dietary recall cannot be regarded as a valid method to estimate total energy intake.Citation28
Carbonated soft drinks, 100% fruit juices and juice concentrates were the most frequently consumed beverages. Students mostly consumed carbonated soft drinks and 100% fruit juices on a weekly basis and juice concentrates on a daily basis; however, this accounted for only approximately one-third of the students. Similarly, a study conducted at the University of the Free StateCitation4 found a higher weekly consumption of carbonated soft drinks and 100% fruit juices (77% and 75.2%, respectively), whereas a study conducted at a university in the Eastern CapeCitation3 indicated a higher monthly consumption of these beverages (72.1% and 68.9%, respectively).
Table sugar was consumed by a large percentage of the students (78.8%, n = 305), and most reported consuming it on a daily basis (46.0%). Similarly, the studies conducted in the Free StateCitation4 and Eastern CapeCitation3 also indicated a high daily consumption of table sugar (Eastern Cape 59.0%, Free State 57.1%).
With regard to the breakfast cereal category, more than two-thirds of the students did not consume powdered breakfast cereals (71.3%, n = 276); instead the majority consumed cornflakes. Contrary to these findings, the studies conducted in the Free StateCitation4 and Eastern CapeCitation3 reported that more than two-thirds of the students consumed powdered breakfast cereals on a weekly and monthly basis, respectively.
A low frequency of consumption was observed for the items listed under the spreads, desserts, cakes and biscuits, chocolates and sweets categories as more than 50% of the students reported that they did not consume these items. Contrary to these findings, the study conducted in the Eastern CapeCitation3 indicated a higher monthly consumption of sweets and chocolates (77.0%) and cakes and biscuits (85.7%), whereas the study conducted in the Free StateCitation4 indicated a higher weekly consumption of these items (sweets and chocolates 92.5% and cakes and biscuits 87.6%).
Association between added sugar intake and BMI
The added sugar intake did not differ significantly across the students’ BMI. A significant relationship was found between the BMI categories and the frequency of consuming some food items that contained added sugars. A significant proportion of the students who consumed flavoured milks on a daily basis had a normal BMI. In addition a significant proportion of students who consumed hot chocolate drinks weekly were underweight, while a significant proportion that consumed this item at most once a month were overweight/obese. Students who consumed jam on a daily basis were significantly more likely to be underweight or overweight/obese. A significant proportion of the students who consumed chocolate bars weekly were overweight/obese, while a significant proportion who consumed these at most once a month were underweight.
Other cross-sectional studies that were conducted among university students have also indicated differences in the frequency of consumption of added sugars across the BMI categories.Citation3,Citation29 The study that was conducted in the Eastern Cape revealed that a significantly smaller proportion of underweight than normal, overweight or obese students consumed sweets, chocolates and chips (crisps) on a daily basis.Citation3 Furthermore, a study that was conducted on 2 259 students attending a university in TurkeyCitation29 found that students with a higher BMI (overweight or obese) consumed these foods and beverages more frequently than students who were classified as being underweight or normal.
From the results it can be deduced that an increase or decrease in the consumption of any food and beverage item will alter the total energy intake; however, the extent to which it impacts on an individual's weight will depend on the quantity and quality of the food or beverage consumed. Thus, it is important to take into account the total energy intake when assessing the weight status of an individual as alteration in the total energy intake can also impact on body weight.Citation30
Differences in the consumption of added sugars across the categories of each demographic variable
Added sugar intake did not differ significantly across the categories of each demographic variable. The consumption frequency of certain food groups was significantly higher among the female than the male students, and the frequency of consumption of these food groups was significantly higher among students who lived at home in comparison with those who lived away from home. Several studies from EuropeanCitation31,Citation32 and MalaysianCitation33 universities found a higher consumption frequency of sweets and cakes among female than male students, while male students had a higher frequency of consumption of carbonated soft drinks than females. Although the literature has suggested that university students who live away from home might develop more unhealthy eating habits in comparison with those who lived at home,Citation10 the findings from previous studies have been inconsistent.Citation31,Citation32
Determinants of added sugar intake
According to the literature, different taste preferences influence the type of foods/beverages consumed by individuals of different ages, genders and races.Citation34 The findings from the current study indicated that taste had the greatest influence on the consumption/purchases of SSBs, possibly due to the fact that students have a strong preference for sweetness.
Price was the second most influential factor affecting the purchases/consumption of SSBs. A possible reason for this is that the majority of students who participated in this study lived away from home and studies have shown that students living away from home become more independent, are often on a budget and therefore take price into consideration when doing grocery shopping.Citation13 Since the cost of healthy foods and beverages is higher than the cost of energy-dense foods and beverages,Citation35 students generally resort to purchasing energy-dense foods. In South Africa, it has been found that a healthy diet costs about 69% more than an unhealthy diet, and if South Africans adopted healthy eating habits approximately 10–15% of their income would be spent on food.Citation36
A significant proportion of students reported that they would purchase/consume SSBs less often if the price of the beverages increased and 17.8% reported that they would purchase/consume healthier alternatives. Other studies that have investigated the influence of fiscal policies on the consumption of SSBs have also found a positive relationship between price increases and consumption patterns.Citation37 Subsidising healthy food products while imposing taxes on unhealthy food products could be one of the many strategies that could steer consumers’ dietary habits in a more positive direction.Citation37
Limitations and recommendations
This study was of cross-sectional design; hence a longitudinal study should be conducted in order to gain a better understanding of the association between added sugar intake and BMI. Only undergraduate students attending one university were included in this study, thus more studies should be conducted among students from different universities in order to have a countrywide perspective of the added sugar intake of university students, and its influence on their BMI. Only a single 24-hour dietary recall was used to measure the total dietary energy intake. Single 24-hour dietary recalls are more appropriate to compare group intakes, and further research should make use of additional 24-hour dietary recalls in order to establish trends in the daily consumption of added sugars. In conjunction with analysing the frequency of consumption of added sugars, studies should also examine the amounts consumed. This study did not assess the physical activity levels of the students, thus future studies should focus on assessing the other determinants of BMI.
Conclusion
This study supports current knowledge and extends the latter in that university students are at risk for developing poor dietary and lifestyle behaviours that could negatively impact on their bodyweight and predispose them to the development of various non-communicable diseases. Various factors tend to influence such behaviours, therefore providing students with health education prior to their admission, as well as during their tertiary education, could equip them with the necessary skills to enable them to make wise dietary choices throughout adulthood.
Acknowledgement
The authors would like to thank Halley Stott for the funding that was provided in order to conduct this study.
Disclosure statement
No potential conflict of interest was reported by the authors.
References
- World Health Organisation. Global Health Observatory (GHO) data: Obesity. 2016. Available from: http://www.who.int/gho/ncd/risk_factors/obesity_text/en/ (Accessed 22/08/2016).
- Marie NG, Fleming T, Robinson M, et al. Global, regional, and national prevalence of overweight and obesity in children and adults during 1980–2013: a systematic analysis for the Global Burden of Disease Study 2013. Lancet. 2014;384(9945):766–81.
- Van den Berg VL, Okeyo AP, Dannhauser A, et al. Body weight, eating practices and nutritional knowledge amongst university nursing students, Eastern Cape, South Africa. Afr J Prim Health Care Fam Med. 2012;4(1):1–9.
- Van den Berg VL, Abera BM, Nel M, et al. Nutritional status of undergraduate healthcare students at the University of the Free State. S Afr Fam Pract. 2013;55(5):445–52.
- Mogre V, Nyaba R, Aleyira S, et al. Demographic, dietary and physical activity predictors of general and abdominal obesity among university students: a cross-sectional study. Springer Plus. 2015;4(226):1–8.
- Peltzer K, Pengpid S. Body weight and body image among a sample of female and male South African University students. Gender Behav. 2012;10(1):4509–22.
- Salameh P, Jomaa L, Issa C, et al. Assessment of dietary intake patterns and their correlates among university students in Lebanon. Front Public Health. 2014;2(185):1–12.
- Sofía RB, María TT, Pilar PD, et al. Prevalence and factors associated with overweight and obesity among university students of the health field in San Luis Potosí México. Health. 2015;7:328–35.
- Mahfouz MS, Makeen AM, Akour AY, et al. Nutritional habits and weight status among Jazan University students: eating patterns and healthy lifestyle assessment. Epidemiol Biostat Public Health. 2016;13(2):1–7.
- Vadeboncoeur C, Townsend N, Foster C. A meta-analysis of weight gain in first year university students: is freshman 15 a myth? BMJ Obesity. 2015;2(22):1–9.
- Takomana G, Kalimbira AA. Weight gain, physical activity and dietary changes during the seven months of first-year university life in Malawi. South Afr J Clin Nutr. 2012;25(3):132–9.
- Shankar P, Ahuja S, Sriram K. Non-nutritive sweeteners: review and update. Nutrition. 2013;29(11):1293–9.
- Deliens T, Clarys P, De Bourdeaudhuij I, et al. Determinants of eating behaviour in university students: a qualitative study using focus group discussions. BMJ Public Health. 2014;14(53):1–12.
- Te Morenga L, Mallard S, Mann J. Dietary sugars and body weight: systematic review and meta-analyses of randomised control trial and cohort studies. BMJ. 2013;346:e7492. https://doi.org/10.1136/bmj.e7492.
- Temple NJ, Steyn NP. Sugar and health: a food based dietary guideline for South Africa. South Afr J Clin Nutr. 2013;26(3):100–4.
- Tugendhaft A, Hofman KJ. Empowering healthy food and beverage choices in the workplace. Occup Health Southern Africa. 2014;20(5):6–8.
- Institutional Intelligence reports. University of KwaZulu-Natal. 2016. Available from: https://ii.ukzn.ac.za/ (Accessed 28/02/2016).
- Bartlett JE, Kotrlik JW, Higgins CC. Organizational research: determining appropriate sample size in survey research. Information Technology, Learning, and Performance Journal. 2001;19(1):43–50.
- Mchiza ZJ, Steyn NP, Hill J, et al. A review of dietary surveys in the adult South African population from 2000 to 2015. Nutrients. 2015;7:8227–50.
- Vorster HH, Badham JB, Venter CS. An introduction to the revised food based dietary guidelines for South Africa. South Afr J Clin Nutr. 2013;26(3):5–12.
- Wheeler ML, Daly A, Evert A, et al. Choose your foods: exchange lists for diabetes, sixth edition, 2008: description and guidelines for use. J Am Dietetic Assoc. 2008;108(5):883–8.
- Langenhoven ML, Conradie PJ, Wolmarans P, et al. MRC food quantities manual. 2nd ed. Parow Valley, Cape Town: South African Medical Research Council, 2009.
- Centers for Disease Control and Prevention (CDC). National Health and Nutrition Examination Survey (NHANES). Anthropometry procedures manual. 2007. Available from: https://www.cdc.gov/nchs/data/nhanes/nhanes_07_08/manual_an.pdf.
- Worldwide words. Investigating the English language across the globe. Available from: http://www.worldwidewords.org (Accessed 18/02/2016).
- Case A, Menendez A. Sex differences in obesity rates in poor countries: evidence from South Africa. Econ Hum Biol. 2009;7:271–82.
- Kanter R, Caballero B. Global gender disparities in obesity: a review. Adv Nutr. 2012;3:491–8.
- World Health Organisation. WHO calls on countries to reduce sugar intake among adults and children. 2015. Available from: http://www.who.int/mediacentre/news/releases/2015/sugar-guideline/en/ (Accessed 17/02/2016).
- Freedman LS, Commins JM, Willett W, et al. Evaluation of the 24-hour recall as a reference instrument for calibrating other self-report instruments in nutritional cohort studies: evidence from the validation studies pooling project. Am J Epidemiol. 2017;186(1):73–82.
- Gunes FE, Bekiroglu N, Imeryuz N, et al. Relation between eating habits and a high body mass index among freshman students: a cross-sectional study. J Am Coll Nutr. 2012;31(3):167–74.
- Mozaffarian D, Willet WC, Hu FB. Changes in diet and lifestyle and long-term weight gain in women and men. N Engl J Med. 2011;364(25):2392–404.
- Ansari WE, Stock C, Mikolajczyk RT. Relationships between food consumption and living arrangements among university students in four European countries: a cross-sectional study. Nutr J. 2012;11(28):1–7.
- Lupi S, Bagordo F, Stefanati A, et al. Assessment of lifestyle and eating habits among undergraduate students in Northern Italy. Dietary Habits of Undergraduate Students. 2015;51(2):154–61.
- Gan WY, Mohd Nasir MT, Zalilah MS, et al. Differences in eating behaviours, dietary intake and body weight status between male and female Malaysian university students. Malays J Nutr. 2011;17(2):213–28.
- Drewnowski A, Mennella JA, Johnson AL, et al. Sweetness and food preference. J Nutr. 2012;142:1142S–8S.
- Waterlander WE, Scarpa M, Lentz D, et al. The virtual supermarket: an innovative research tool to study consumer food purchasing behaviour. BMC Public Health. 2011;11:1–10.
- Temple NJ, Steyn NP, Fourie J, et al. Price and availability of healthy food: a study in rural South Africa. Nutrition. 2011;27(1):55–8.
- Thow AM, Downs S, Jan S. A systematic review of the effectiveness of food taxes and subsidies to improve diets: understanding the recent evidence. Nutr Rev. 2014;72(9):551–65.