
Abstract
Objective:
The purpose of the study was to assess the association between dietary diversity, health and nutritional status of older persons aged 50 years and above in Milenge district of Luapula province, Zambia.
Design:
A cross-sectional, descriptive study was conducted.
Subjects and setting:
The study was conducted among 135 older persons (≥ 50 years) comprising 67 men and 68 women who were randomly selected from three communities in Milenge district, Luapula province.
Outcome measures:
Anthropometric measurements (weight and height) were used to determine the prevalence of malnutrition among the respondents by calculating the body mass index (BMI). Food consumption was assessed using a non-quantified food frequency questionnaire and dietary diversity scores were used to determine the adequacy of food intake, while a health questionnaire was used to determine self-perceived health status of the respondents.
Results:
Based on the WHO BMI classification, 30.4% of older persons were underweight, whilst 8.1% were overweight. There was a significant difference in mean BMI between male and female older persons (p < 0.01). More men had severe underweight, whilst more women were found to be overweight and obese. The mean dietary diversity score (DDS) was 3.6 ± 1.1. Dietary assessment showed that 64.4% of the respondents had dietary diversity scores that were below the mean value, while 35.6% had scores above the mean value. The Spearman rho correlation test revealed a positive correlation (r = 0.184, p = 0.028) between BMI categories and dietary diversity scores.
The majority (74%) of respondents reported having at least one health condition including high blood pressure (42.6%), coronary heart disease (8.9%), malaria (24.4%), tuberculosis (35.6%) and pneumonia (24.4%), while only 26% perceived themselves to be healthy.
Conclusion:
The study revealed a high prevalence of undernutrition and low dietary diversity among older persons. A positive association was found between nutritional status and dietary diversity. Although the majority of the respondents reported having health conditions, there was no relationship between nutrition-related health conditions and dietary diversity.
Introduction
By 2050, the world’s population aged 60 years and older is expected to total 2 billion, up from 900 million in 2015. In addition, 80% of older people will live in low- to middle-income countries including Zambia.Citation1 According to the Zambian Central Statistics Office (2012), the life expectancy at birth has increased for both males and females.Citation2 Projections indicate that the life expectancy at birth will increase by 8.6 years; from 52.6 years in 2011 to 61.2 years by 2035.Citation3
The Zambian Ministry of Health recognises the rapid increase in the number of older persons, which is becoming a significant proportion of the society in Zambia.Citation4 As a result, maintaining their health is becoming more important; the risk of developing chronic conditions such as malnutrition increases with age.Citation5,Citation6 Furthermore, research has shown that older people are vulnerable to various macro- and micronutrient deficiencies and disorders pertaining to poor dietary nutritional intake.Citation7
Nutrition interventions in African countries are primarily directed towards other vulnerable groups such as infants, young children, pregnant and lactating women.Citation5 Hence there is a lack of policies and programmes that concentrate on older persons, which is mirrored by the limited data available on older persons’ health situations, nutritional status and dietary intake patterns.
The HIV/AIDS epidemic in Africa is the highest in the world and is posing a huge strain on the continent’s older population. Older persons are expected to look after grandchildren who have lost their parents due to AIDS.Citation8 In order to prevent development of malnutrition, there is need for continuous monitoring of health and nutritional status of older persons.Citation7
Data on the undernutrition prevalence of older persons in Africa is limited, despite the bulk of health problems being related to nutritional inadequacies.Citation5 There is also limited data on the nutritional requirements of older persons which could be used as a basis for health and nutrition policies and for designing interventions that can help to tackle malnutrition among older persons in Zambia.
It has been observed that nutrition interventions in Zambia are directed primarily towards infants and young children as well as pregnant and lactating women, leaving out this important age group, which is also vulnerable to malnutrition. The focus of the study was to assess the association between dietary diversity and the health and nutritional status of older persons, with emphasis on the influence of food consumption patterns, prevalence of underweight, overweight and obesity and susceptibility to nutrition-related diseases.
Materials and methods
Research design and setting
A cross-sectional descriptive study design that enrolled 135 older persons ≥ 50 years old from Milenge district of Luapula province was conducted. Individuals were randomly selected from three communities, namely Nsaka, Chipulu and Kapalala in Milenge district, which is located in the southern part of Luapula province, Zambia. The calculated sample size was 127 and was adjusted to 135 using a 6% attrition to avoid non-response bias. Luapula province is the second poorest province in Zambia with 81.1% of the population classified as poor (living below the poverty line), and high undernutrition prevalence rates among children with 43% stunting, 13% wasting and 21% underweight.Citation9
Data collection tools
Data were collected using a semi-structured questionnaire comprising the following sections: demographic and socioeconomic information, health questionnaire, and food frequency questionnaire (FFQ). Anthropometric measurements included weight, height and waist circumference and were taken using a digital weighing Seca (S-876) scale, a stadiometer (Seca 217), and a measuring tape respectively, manufactured by Seca GmbH (Hamburg, Germany). To reduce measurement bias, all anthropometric measurements were taken in triplicate and the average recorded. The BMI cut-offs were based on data from the World Health Organization, which states that BMI < 18.5 kg/m2 indicates underweight, 18.5–24.9 kg/m2 indicates normal, while BMI ranging between 25 and 29.9 kg/m2 indicates overweight and greater than 30 kg/m2 indicates obesity.Citation10
The questionnaire was adapted from the Food and Agriculture Organisation (FAO) guidelines for measuring household and individual dietary diversityCitation11 and was pre-tested among non-participating older persons from other communities of Milenge districts. Guidelines for calculating dietary diversity scores (DDS) are based on results from the Women’s Dietary Diversity Project; however, this can also be used to calculate scores for individuals from other age or sex groups, as there is none specifically for older persons Citation11
Weight of respondents was measured to the nearest 0.1 kg, while height and waist circumference were measured to the nearest 0.1 cm. For older persons unable to stand straight, height was estimated using a demi-span, and calculated using a standard formula: for females: height in cm (1.35 × demispan in cm) + 60.1; and males: height in cm = (1.40 × demispan in cm) +57.8.Citation12 The study included only one older person who was unable to stand.
Data analysis
Anthropometric measurements were captured using an Excel spreadsheet (IBM Corp, Armonk NY, USA) and the BMI was calculated as weight (kg) divided by height squared (m2). Using the WHO categorisation, BMI were categorised as severe underweight (< 16 kg/m2), moderate underweight (16–16.99 kg/m2), mild underweight (17–18.49 kg/m2), normal (18.5–24.9 kg/m2), overweight (25–29.9 kg/m2) and obese (> 30 kg/m2).Citation10 The waist circumference categorisation was based on the WHO (2000) cut-offs, where measurement of < 102 cm indicates low risk while greater than 102 cm indicates higher risk in males for type 2 diabetes and cardiovascular disease. For women, less than 88 cm indicates low risk and 88 cm and above indicates higher risk.Citation10
Dietary diversity scores (DDS) were determined based on the nine food groups from the food frequency questionnaire, which determined what each participant consumed in seven days prior to the day of interview.Citation11 In addition to a 24-hour period, a seven-day reference period is also considered a valid timeframe for dietary recall, which was used to determine the food consumption patterns of the older persons.Citation11 Food items consumed were first aggregated into the following food groups: (1) cereals, (2) legumes/pulses and nuts, (3) vegetables, (4) fruits, (5) milk and milk products; (6) roots and tubers; (7) meat and poultry; (8) fish and (9) eggsCitation11 Data on other food items such as oils, fats and condiments were collected although these were not considered in the determination of the dietary diversity score. Consumption from less than four food groups was considered inadequate dietary diversity while consumption in four and above was considered adequate. To calculate the DDS, the number of food groups consumed by individual respondents were summed over the seven-day recall period.
Data were analysed using Statistical Package for the Social Sciences (SPSS) version 20.0 (IBM Corp, Armonk, NY, USA). Descriptive statistics were used to summarise and describe various sample characteristics and Spearman’s rank order correlation coefficient was used to establish the relationship between nutritional status and health status, as well as the relationship between nutritional status and food consumption patterns. A one-sample t-test was used to assess the statistical difference in the nutritional status of male and female older persons.
Ethical considerations
Ethical approval was obtained from the University of Zambia Research Ethics Committee (UNZABREC) (number: FWA00000338). Permission to collect data in the area was granted by the Milenge District Medical Officer. Participants were asked to provide written informed consent, which was signed in the presence of a witness.
Results
Demographic and socioeconomic characteristics
The demographic and socioeconomic characteristics of the participants are presented in . The mean age of the respondents was 62.4 years. A total of 48% of the respondents were married, 39.3% had no formal education while 90% had no formal employment (the study did not distinguish unemployed and retired participants) and 72.6% produced their own food.
Table 1: Demographic and socioeconomic characteristics of the participants
Dietary diversity
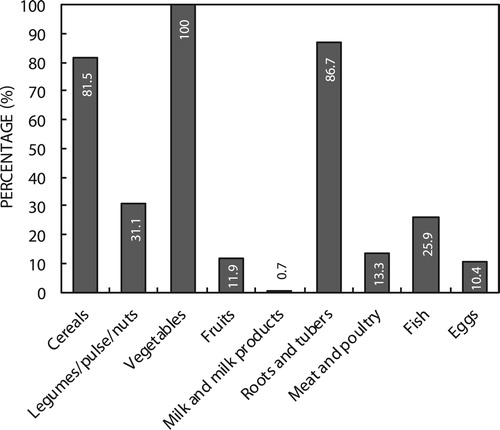
Considering the food groups and specific food items consumed, it was established that all participants consumed some form of vegetables (100%, n = 135) during the seven days prior to the study. These included pumpkin leaves (chibwabwa) (96.3%, n = 130), sweet potato leaves (kalembula) (91.1%, n = 123), amaranth (bondwe) and abiscus meeusei (lumanda) (77%, n = 105). Most participants (86.1%, n = 117) consumed food items from the roots and tubers group, which comprised cassava (80.7%, n = 109) and sweet potatoes (31.9%, n = 43), while 81.5% (n = 110) of the older persons in the study consumed cereals, which included roasted maize or meal porridge (84.4%, n = 114). About a quarter of the respondents (25.9%, n = 35) consumed fish and 10.4% (n = 15) consumed eggs, while 13.3% (n = 18) consumed meat and poultry. Only 0.7% (n = 1) of the respondents consumed food items from the milk and milk products group, while 11.9% (n = 16) and 31.1% (n = 42) consumed food items from the fruits and legumes/pulses/nuts groups respectively, as shown in .
Figure 1: Percentage of participants who consumed in the food groups seven days prior to interview.
Further analysis revealed that the mean dietary diversity score (DDS) was 3.6 ± 1.1. The minimum DDS was 2 while the maximum was 7. Most of the respondents (64.4%, n = 87) consumed foods from less than four food groups in the seven days prior to the interview, whilst 35.6% (n = 48) consumed four or more food groups. There are currently no established cut-off values for the number of food groups to indicate adequate or inadequate dietary diversityCitation11 As a result, the mean dietary diversity score was used as a cut-off for inadequate and adequate intake, and individuals consuming less than four food groups were considered to have low dietary diversity. Based on this, it was determined that most participants had low dietary diversity.
Nutritional status of the older persons
Gender-disaggregated data revealed that none of the men were found to be obese; however, 2.9% (n = 2) of women were obese, while severe underweight was more prevalent in men (11.7%, n = 8) compared with women (7.4%, n = 5) (). Using a one-sample t-test, it was established that there was a significant difference in the mean BMI for males (19.8 kg/m2) and females (20.5 kg/m2) (p < 0.05). The study assessed waist circumference of respondents and results indicated that 17.6% (n = 12) of women were at risk of developing central obesity while no men were at risk ().
Table 2: BMI categories and waist circumference of the participants
Perceived health status of the respondents
Findings from the perceived health status revealed that 74% (n = 100) of the participants reported having suffered from an illness during the seven days prior to the study while 26% (n = 35) perceived themselves to be healthy. Further inquiry on the type of illness revealed that malaria (24.4%, n = 33), ’flu (49.6%, n = 67), tuberculosis (35.6%, n = 48), pneumonia (24.4%, n = 33) and high blood pressure (42.6%, n = 58) were the top five health conditions reported, as shown in . Most of the respondents suffered from infectious diseases, which may be partly attributed to low BMI, as revealed above, as undernutrition is the primary cause of immunodeficiency.Citation13 The results from this study also revealed that conditions such as heart disease, obesity, diabetes, malaria, tuberculosis and ’flu were more prevalent in women than in men ().
Table 3: Self-reported health conditions
Lifestyle habits
Assessment of the lifestyle habits revealed that 21.5% (n = 29) of participants reported having consumed alcohol during the seven days prior to the study and 21.5% (n = 29) reported having smoked. Among the respondents who perceived themselves to have health conditions only 22.2% (n = 30) visited the clinic (). The small percentage of respondents who visited the clinic indicated poor health-seeking habits among the older persons.
Association between health conditions and BMI
Comparing the BMI and the health conditions of the participants, 48.5% (n = 16) who had malaria were found to be underweight, 34.3% (n = 23) and 33.3% (n = 16) of participants who had ’flu and tuberculosis respectively were underweight. Chi-square analysis revealed a significant positive relationship between malaria prevalence and nutritional status (p = 0.045). About 3.4% (n = 2) of participants with high blood pressure were obese and 24.1% (n = 15) were underweight as indicated in . There was no statistically significant association between non-communicable diseases and BMI.
Table 4: Comparison of health conditions and nutritional status
Association between dietary diversity and health conditions
Spearman’s rho (r) correlation coefficient was used to establish the association between BMI categories and dietary diversity scores of participants. There was a significant positive relationship between the two variables (r = 0.184, p = 0.028). A positive relationship found between nutritional status and dietary diversity scores suggests that dietary diversity can contribute to the attainment of optimum nutritional status in older persons. There was no statistically significant association between nutrition-related conditions (high blood pressure [r = 0.067, p = 0.440], coronary heart disease [r = 0.041, p = 0.635], obesity [r = 0.058, p = 0.50]) and dietary diversity.
Discussion
The study explored the association between dietary diversity scores, health and nutritional status among older persons. The findings on food consumption revealed that many participants consumed mostly vegetables and carbohydrate food sources (cereals and tubers). Protein food sources were seldom consumed. It was also observed that most vegetables consumed during the time the study was conducted were seasonal and rain-fed.
A study conducted in South Africa reported that older persons had a high intake of vegetables and cereals,Citation14 and their diets typically consisted of maize and green leafy vegetables. Our current study also found low consumption of milk, milk products and other protein-rich foods among the participants.
This study further revealed that most participants have low dietary diversity. This may be related to the poor nutritional status observed, as indicated by the noted undernutrition prevalence. In the United States, Bernstein et al.Citation15 reported among a group of frail nursing home residents that higher dietary diversity scores were associated with higher BMI in women.Citation15
The high percentage of participants consuming foods from the vegetable group may be attributed to the availability and affordability of these vegetables during the time of the study, as most of the vegetables were rain-fed and therefore easy to grow. Low consumption of protein-rich foods contributed to low dietary diversity and may be a result of low socioeconomic status of participants, as they could not afford to purchase foods that they did not produce. It can further be stated that the high maize and cassava consumption observed was as a result of these being staple foods for the local community.
The nutrition assessment component of the study revealed that 30.4% of the participants were undernourished as characterised by a BMI of less than 18.5 kg/m2. Studies conducted in Ethiopia and Uganda stated that 30.5% and 33.3% of older persons were undernourished respectively.Citation16,Citation17 The low BMI among the participants can possibly be attributed to a lack of consumption of diverse food groups, which was found to be positively associated with nutritional status in both this and other studies.Citation18
Regarding waist circumference, the study conducted in Verulam, South Africa indicated that 68.4% of women and 25% of men were at risk of central obesityCitation14 Our waist circumference results correlated with our BMI calculations, which indicated that more women were at risk of obesity compared with men.
The findings on health status were similar to the study carried out by the Help Age International Africa Regional Development Centre, which indicated that a large number (65%) of older persons had various health conditions.Citation19 Looking at specific conditions, a study in Nairobi and Machakos districts, Kenya revealed that malaria (11.6%), coughs and chest pains (30.5%) and osteoporosis (16%) were the most common ailments suffered by older persons.Citation20 In a separate study in Uganda, malaria (45.3%), poor sight (56%), arthritis (54.2%) and abdominal pain were the most self-reported health conditions in both men and women.Citation21 The high number of infectious conditions such as malaria, pneumonia, tuberculosis and ’flu observed may be attributed to immune-deficiency, which can occur due to poor nutritional status. High blood pressure observed among the participants may be due to age-related high blood pressure, which occurs due to vascular as well as neural-humoral conditions in older persons.Citation22
The South African study revealed that over-nutrition was a problem among the older persons, and further showed that poor health status was mainly reflected by obesity and hypertension.Citation14 In our study, however, no significant association was found between nutrition-related health conditions and anthropometric measurements taken. The differences may be attributed to differences in the dietary patterns among study populations and representative of the different stages of the nutrition transition in which each country may be.
This study had some limitations, one of which was the sample size. The sample size was small and therefore the findings may not be generalised. Large-scale prospective studies of this topic are indeed warranted. Another limitation was that as the study was cross-sectional in nature, it was conducted within a certain time period (rainy season) and hence may not reflect seasonal changes in food-consumption patterns among the participants.
Conclusion
The present study has shown a high prevalence of undernutrition among older persons. It also revealed that underweight was more prevalent in men than in women. These findings can be linked to low dietary diversity amongst older persons, particularly low intake of protein-rich foods. Disaggregated data revealed a significant difference in the nutritional status between men and women.
The findings in the study revealed that infectious diseases such as malaria, ’flu and tuberculosis were more prevalent among older persons, which may be linked to high prevalence of undernutrition. High blood pressure was also prevalent amongst older persons, which can be attributed to old age hypertension. It is important to periodically monitor the health and nutritional status of older persons in Zambia, to identify those at risk and to establish underlying causes so that action can be taken.
Nutrition messages should be formulated that stress the importance of dietary diversity among older persons in order to address nutritional and health-related problems. If no intervention is put in place, Zambia is likely to continue the existing trend of older persons with compromised health and poor nutritional status.
Competing interest
The authors declare that they have no competing interests.
Acknowledgements
The authors wish to thank Milenge District Health Office and the Food Science and Nutrition Department at the University of Zambia for the support received during the study.
Disclosure statement
No potential conflict of interest was reported by the authors.
Notes on contributions
GM, KA and PM designed the study, conceptualised the paper, and wrote the draft manuscript. GM collected the data. KA and PA gave substantial inputs to the plan for analysis. GM, KA and PA conducted the analysis. All authors read and approved the final manuscript.
References
- World Health Organisation. Global Health and Aging. World Health Organisation, Geneva, Switzerland. 2011.
- Central Statistical Office. Zambia 2010 Census of Population and Housing, Lusaka: Zambia. 2012.
- Central Statistical Office. Zambia. 2010. Census of Population and Housing: Analytical report, Lusaka: Zambia, 2013.
- Ministry of Health Zambia. National Food and Nutrition policy, Lusaka: Zambia, 2006.
- Audain K, Carr M, Dikmen D, et al. Exploring the health status of older persons in Sub-Saharan Africa. Proc Nutr Soc. 2017;76: 1–6. doi:10.1017/S0029665117000398.
- Kaiser M, Ramsch J, Uter W, et al. Frequency of malnutrition in older adults. American Geriatrics Society. 2010;58(9):1734–1738. doi:10.1111/j.1532-5415.2010.03016.x.
- Oldewage-Theron W, Samueland F, Djoulde R. Serum concentration and dietary intake of vitamins A and E in low income South African elderly. Clin Nutr. 2009;29(1):119–123. doi: 10.1016/j.clnu.2009.08.001
- Kalomo E, Lee KH, Besthorn F. Depressive symptoms among older caregivers raising children impacted by HIV/AIDS in the Omusati Region of Namibia. Health Care Women Int. 2017;38:1327–1343. doi:10.1080/07399332.2017.1368514.
- Central Statistical Office (CSO) [Zambia], Ministry of Health (MOH) [Zambia], and ICF International. Zambia demographic and health survey 2013-14. Rockville (MA): Central Statistical Office, Ministry of Health, and ICF International; 2014.
- World Health Organisation. Obesity: preventing and managing the global epidemic: Report of WHO consultation: World Health Organisation. 2000.
- Kennedy G, Ballard T, Dop M. Guidelines for measuring household and individual dietary diversity, D.C.: Food and Agriculture Organisation (FAO). 2011.
- Hickson M, Frost G. A. comparison of three methods for estimating height in the acutely ill elderly population. J Human Nutrition Diet 6. 2003;16(1):13–20. doi: 10.1046/j.1365-277X.2003.00416.x
- Katona P. Katona-Apte. Interaction between nutrition and infections. Clin Infect Dis. 2008;46(10):1582–1588. doi:10.1086/587658.
- Govender T. Analysis of the nutritional status and dietary intake data of a group of elderly at a day and frail care centre in Verulam. South Africa. 2011. http://openscholar.dut.ac.za/bitstream/10321/712/3/Govender_%202011.pdf (accessed 10 April 2016).
- Bernstein MA, Tucker KL, Ryan ND, et al. Higher dietary variety is associated with better nutritional status in frail elderly people. J. Am. Diet. Association. 2002;102(1):1096–1104. doi: 10.1016/S0002-8223(02)90246-4
- Tesfaye F, Tessema M, Zerihun M, et al. Assessment of the nutritional status of older people in Zeway, Central Ethiopia. HelpAge International. 2004. https://www.helpage.org/silo/files/summary-of-research-findings-on-the-nutritional-status-and-risk-factors-for-vulnerability-of-older-people-in-africa.pdf.
- Kikafunda JK, Lukwago FB. Nutritional status and functional ability of the elderly aged 60 to 90 years in the Mpigi district of central Uganda. HelpAge international. 2004. https://www.helpage.org/silo/files/summary-of-research-findings-on-the-nutritional-status-and-risk-factors-for-vulnerability-of-older-people-in-africa.pdf.
- Goncalves S, Minsterio K. Traditional foods eaten by older people in Chokwe. Districts (Mozambique). HelpAge international. 2004. https://www.helpage.org/silo/files/summary-of-research-findings-on-the-nutritional-status-and-risk-factors-for-vulnerability-of-older-people-in-africa.pdf
- Help Age International Africa Regional Development Centre. Summary of research findings on the nutritional status and risk factors for vulnerability of older people in Africa. 2004. https://www.helpage.org/silo/files/summary-of-research-findings-on-the-nutritional-status-and-risk-factors-for-vulnerability-of-older-people-in-africa.pdf.
- Wagah M, Ochola S, Omalla J. Nutritional risk factor analysis amongst older persons in Nairobi and Machakos Districts (Kenya). HelpAge international. 2004. https://www.helpage.org/silo/files/summary-of-research-findings-on-the-nutritional-status-and-risk-factors-for-vulnerability-of-older-people-in-africa.pdf
- Barbara T, Kikafunda. Nutritional status and risk factors for nutritional vulnerability among older people in urban Kampala and rural Soroti. HelpAge international. 2004. https://www.helpage.org/silo/files/summary-of-research-findings-on-the-nutritional-status-and-risk-factors-for-vulnerability-of-older-people-in-africa.pdf
- Johansson Y. Self-perceived health and nutritional status among home-living older people. Linköping University Medical Dissertations No. 1154. 2009. http://www.diva-portal.org/smash/get/diva2:273934/FULLTEXT01.pdf.