
Abstract
Background:
Children with autism spectrum disorder (ASD) have a number of associated feeding difficulties and problematic mealtime behaviours. These problems can have a negative impact on the child’s nutritional intake and little is known about the food preferences and characteristics of food choices. In addition, these difficulties can be exacerbated for children and caregivers living in low- and middle-income countries such as South Africa due to limited access to food, resources and health care.
Objectives:
The purpose of this study was to determine (1) types of feeding difficulties prevalent in children with ASD, (2) food items that children in South Africa prefer, (3) the relationship between age and ASD severity on food preferences.
Method:
A cross-sectional quantitative research design was employed using an online questionnaire. There was a total of 40 respondents from different provinces in South Africa. The data were analysed using descriptive statistics as well as multiple linear correlation analysis.
Results:
The study has identified common feeding difficulties in children with ASD and those being diagnosed as picky eaters in South Africa and compared them with difficulties that were found in the international literature. The study also highlighted the food groups that were preferred by children with ASD, showing a preference for starches and snack items compared with fruits and vegetables. In addition, there were significant correlations between ASD severity and ASD age on food preferences, suggesting that both age and severity may be predictors of food choices made by children with ASD, and highlighted a need for multidisciplinary intervention.
Conclusions:
This study adds to the existing literature on feeding difficulties in children with ASD but provides additional insights into children living in low- and middle-income countries and can be used to improve appropriate and responsive interventions. This study provides evidence that supports the influence of context and family environment regarding feeding in children with ASD.
Introduction
Caregivers continuously report on the difficulty in feeding their child with autism spectrum disorder (ASD) due to their restricted diets and the negative impact this has on their development as well as growth and nutrition. Previous research has highlighted that many children with ASD may present with associated feeding difficulties in comparison with typically developing children.Citation1–7 Children with ASD will eat a small variety of foods, preferring certain types and textures. This results in a limited food repertoire and can have detrimental effects on the child’s health outcomes.Citation8–11 Although research has highlighted the feeding difficulties prevalent in children with ASD, much of the literature has been unable to specify the distinct feeding problems, particular food items that are eaten and preferred, and potential factors that may be contributing to the feeding difficulties present as well as the family’s influence on feeding difficulties. In addition, there is a significant deficit in research that focuses on feeding in different social and environmental contexts, in particular in low- and middle-income countries such as South Africa.
Different contextual factors, such as food availability, family support and access to resources and healthcare, can influence the way a disorder manifests and presents. This highlights the need to understand the problem in context and allows for appropriate and responsive interventions. Many children and families in South Africa are living in poverty with a lack of resources, professional skill and information.Citation12,Citation13 These problems can exacerbate feeding and mealtime challenges experienced by both the child with ASD and the caregiver with regard to access, affordability and availability of certain foods. Previous research has indicated that children with ASD living in South Africa may present with problems of picky eating and eating a restricted variety of food items, but there has been limited research exploring preferred and non-preferred food items similar to research reported in other African countries such as Ghana.Citation14,Citation15 It is therefore imperative that the challenges around feeding a child with ASD, as well as those related to the context, are explored in more detail.
Current study
The purpose of this study was to expand on previous research by (1) describing the types of feeding difficulties prevalent in children with ASD, (2) determining the food items that children with ASD in South Africa prefer, and (3) the influence of age and ASD severity on food preference.
Methods
Design and participants
This study was a cross-sectional quantitative research design. A total of 40 primary caregivers responded to the online questionnaire. All caregivers had to have a child that met the following inclusion criteria: (1) formally diagnosed with ASD; (2) between the ages of 3 and 10 years; (3) and some reported feeding difficulty. This age range was chosen as by the time is child is 3.0 years of age, he/she should be accepting a wide variety of food types and textures.Citation5 In addition, children below the age of 10 still require some assistance with feeding and may not be completely independent, making parent reports more reliable.
Non-probability convenience sampling was used and different ASD schools in South Africa were contacted in order to send the link to caregivers of children with ASD. Children enrolled at these schools are required to have a primary diagnosis of ASD and therefore no additional diagnostic assessments were done. Responses to the web- and paper-based surveys were considered as consent to participate in the research. Confidentiality was maintained by providing a web-accessible survey as well as an email link to the survey. No personal, identifiable data were collected. The questionnaire included the following sections:
Demographic information sheet
The demographic information sheet was adapted from Schreck et al.Citation4 and was used to gather biographical information on both the child with ASD and his/her caregiver including age, location and ASD severity.
Behavioural Paediatric Feeding Assessment Scale (BPFAS)
The BPFASCitation16 is a standardised tool used to identify feeding difficulties, disorders and problematic mealtime behaviours in children. The tool comprises a list of 35 items, with 25 being related to the child’s feeding behaviours and 10 being related to caregiver feelings and strategies that are used to manage feeding behaviours and difficulties. There is a two-part answering system for each question: the caregiver first has to rate each item on a Likert scale from 1 (never) to 5 (always), indicating the occurrence of the feeding event. This is followed by the caregiver answering whether the feeding behaviour reported is a problem for them by answering ‘yes’ or ‘no’. Greater overall scores indicate higher levels of problematic mealtime and feeding behaviour. Previous research has suggested that the first 25 test items are reliable (Cronbach’s α > 0.80) and valid in being able to determine feeding problems across a range of paediatric populations.
Food Preference Questionnaire (FPQ)
The FPQ is a caregiver report checklist of food items that are eaten and preferred by their child with ASD. This included a list of 70 common foods that were categorised into different food groups (7 starches, 9 snacks, 9 dairy, 12 meat/fish, 14 fruit and 19 vegetables) as well as those that are unique to South Africa such as pap (starch). Caregivers were required to rate each food item that the child ate at each mealtime according to a five-point Likert scale from 0 (never tried) to 5 (likes a lot). These food items were included based on previous literature, input from health professionals working with children with ASD and associated feeding difficulties as well as the literature by Nel and Casey,Citation17 which looked at common foods eaten in South African households.
Statistical analysis
Data were analysed using IBM SPSS Statistics 22 (IBM Corp, Armonk, NY, USA). Analysis commenced with the calculation of descriptive statistics and reliability coefficients (Cronbach’s alphas: αc) for the key variables.
The demographic characteristics of students and caregivers and responses regarding the students’ eating habits were analysed by frequency and percentage. The relationship of the child’s food preference to ASD severity and age were assessed using multiple linear regression analysis, with the child’s food preferences being the outcome variable and the child’s ASD rating/age and the percentage of food items reported by the caregiver as the predictor variables. Significance was set at p ≤ 0.05.
Results
Demographic characteristics of participants
Demographic information was collected for both the caregiver and the child with ASD. The primary caregivers who responded to the questionnaire ranged between the ages of 18 and 65 years, with the average age being between 30 and 35 years of age (33.3%, n = 13). Those who answered were predominantly mothers (84.6%, n = 33). Children with ASD were between the ages of 3.0 and 9.6 years of age, with the majority of children being between 8 and 9 years of age. Children in the current sample were mostly male (82%, n = 32) and were living in the following provinces: Gauteng (82.5%, n = 33), KZN (7.5%, n = 3), Mpumalanga (5%, n = 2) and the Eastern Cape (5%, n = 2). Children presented with a range of ASD severity from 1 (21%, n = 7), to 2 (46%, n = 15) and 3 (33%, n = 11) with 64% (n = 25).
The severity of feeding difficulties and problems present in children with ASD in South Africa
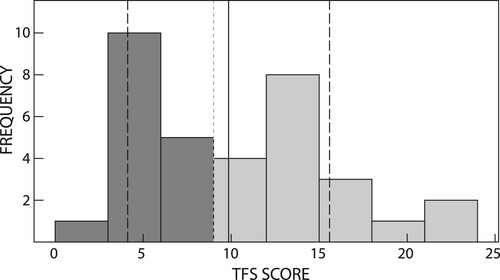
Parent responses on the BPFAS indicated that their children ate a very limited variety of foods, representing a self-restricted diet within the household. Total frequency score and total problem score were calculated for each participant. The results indicate that the mean total frequency score was 76.59 (13.36), with 9 children scoring greater than 84. The mean total problem score was 9.85 (5.74), indicating a significantly higher normative mean score from 18 of the caregivers ().
Table 1: Behavioural Paediatric Feeding Assessment Scale (BPFAS) scores
and provide a description of those who scored within the normative mean as well as those who scored significantly higher than the normative mean. shows the median = 76 and the 25th percentile = 68.3 and the 75th percentile = 87, and the median = 10 and the 25th percentile = 5 and the 75th percentile = 13.8. This shows that parents experienced more problems with their child’s feeding difficulties and possible problematic mealtime behaviours.
Figure 1: Histogram showing BPFAS total frequency scores.
Notes: solid line = norm; dark grey = normative mean, light grey = higher than normative mean.
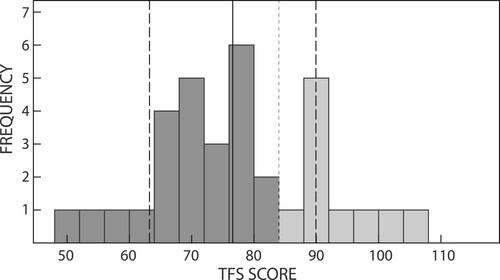
Figure 2: Histogram showing BPFAS total problem scores.
Notes: solid line = norm; dark grey = normative mean, light grey = higher than normative mean.
Preferred and non-preferred food groups
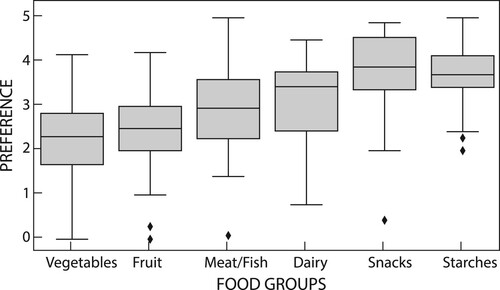
The food preference questionnaire was used to determine foods preferred and not preferred by children with ASD and analysed using descriptive statistics. Children with ASD ate a range of foods, with many of them preferring to eat starches. The common food groups that ASD children ate were starches (95.71%) and snacks (92.10%), as well as dairy (88.82%). The least common food groups were meat/fish (80.70%), fruits (73.02%) and vegetables (70.05%). Children’s food groups were also analysed using the Likert scale ().
Figure 3: Food groups eaten by children with autism.
Notes: (0) never tried, (1) dislikes a lot, (2) dislikes, (3) neither likes/dislikes, (4) likes, (5) likes a lot. *Calculated as percentage of children who ate different foods within each food group.
A comparison of the specific food items within each food group eaten by 50% or more of children can be seen in . Children within the South African context ate unique foods such as pap. Foods that were eaten by less than 50% of children and not included in the table were vegetables and fruits such as parsnips (26.3%), raspberries (34.2%), blueberries (38.5%), apples (pureed) (35.9%) and broccoli (48.7%).
Table 2: Foods eaten by more than 50% of children with ASD
Preferred and non-preferred food items
Food items were also ranked according to preference, with 1 being dislikes a lot and 5 being likes a lot. Parents were asked to score each food item, and these were then tabulated according to preference from most to least preferred (Appendix 1). The 10 most common foods eaten and preferred by children with ASD included: biscuits (M = 4.28, SD = 0.94), yoghurt (M = 4.27, SD = 0.93), chips (crisps) (M = 4.08, SD = 1.64), sweets (M = 4.05, SD = 1.21), cereals (M = 4.03, SD = 1.20), chicken (M = 4.03, SD = 1.31), pasta (M = 4.0, SD = 1.24), white bread (M = 3.82, SD = 1.0) and porridge, maize or oats (M = 3.80, SD = 1.20). There were no items in either the vegetables or fruits food group that were in the top 10 preferred food items.
The 10 least preferred food items included ice lollies (M = 3.18, SD = 2.01), cheese (processed) (M = 3.16, SD = 1.67), cheese hard (M = 3.16, SD = 1.69), cabbage (M = 2.87, SD = 1.69), carrots (cooked) (M = 2.87, SD = 1.58), peaches (M = 2.85, SD = 1.77), tomatoes (fresh) (M = 2.84, SD = 1.60), eggs (boiled/poached) (M = 2.82, SD = 1.71), sweet potatoes (M = 2.67, SD = 1.66), mango (M = 2.66, SD = 1.89) and pork (M = 2.66, SD = 1.79). This includes a mix of different food groups and could be attributed to the child’s preference as well as the family’s access and their own personal use of and preference for the aforementioned food items.
Relationship between foods eaten and age of the child with ASD
Multiple linear regression was run to determine the relationship between age and the various food groups eaten. The results indicated that the overall model is statistically significant (F = 46.20, p = 0.00, R2 = 0.899). The resulting regression identified age = 0.18 fruit, –0.09 veg, –0.41 meat/fish, + 0.40 dairy, + 0.83 snacks, + 0.91 starches. However, there was no statistical significance shown for any of the food groups eaten, indicating that regardless of age there was no preference for a specific food group. However, it should be noted that the sample size used was small and results should be interpreted with caution.
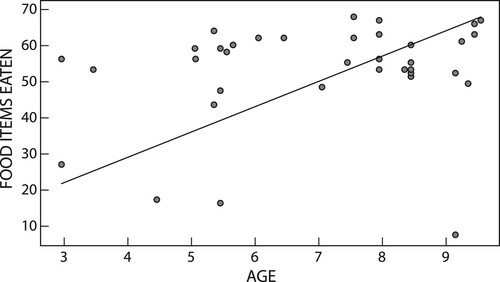
A linear regression was run to determine the relationship between age and food items eaten. There was a significant correlation between number of different foods eaten and age (coefficient of 7.18), with the older children eating more food varieties (F = 351.2, p = 0.00, R2 = 0.905) (). This shows that younger children may be more restricted in the foods that they eat but this may change as they get older, with a few exceptions and outliers.
Figure 4: Relationship between child’s age and foods eaten.
Relationship between foods eaten and ASD severity
To determine the relationship between ASD severity and food group preferences, as well as total number of food items eaten, a correlation analysis was done to compare each of the food groups with ASD severity (). While there is no significant relationship between the food groups and ASD severity (all p-values above 0.05), it is worth noting that the relationship between ASD severity and vegetables was the most significant (p = 0.07) followed by meat/fish and dairy as the next most significant food groups. In addition, there is a low-to-moderate inverse relationship between each of the food groups and ASD severity (except for dairy, which indicated a direct relationship), thus indicating that as ASD severity increases, children will eat and accept fewer food items. Further, ASD severity was inversely correlated to the number of food items eaten, albeit at a relatively low level (−0.353). However, this relationship is significant (p = 0.048). This indicates that food preferences can be used as an indication of ASD severity. It would be worth conducting this study on a larger sample size in order to determine whether some of these relationships would still demonstrate a significant relationship.
Table 3: Food group and food item correlation with ASD severity
Discussion
The study found that children with ASD did present with selective eating and restricted diets in terms of the foods they accepted and preferred. By determining the food preferences for children with ASD, this study has highlighted that these children may be at risk of nutritional deficiencies and global developmental delays. These difficulties experienced in children with ASD may be further compounded for children living in South Africa due to poverty and food insecurity.Citation2,Citation18 The study did not find any evidence to support the hypothesis that food selectivity in children with ASD is being attributed to their diagnosis but could in fact also be related to the family’s own food preferences and diet.Citation8,Citation16
Types of feeding difficulties prevalent in children with ASD in South Africa
The BPFAS was used to determine feeding difficulties and problematic mealtime behaviours in children with ASD. The results indicated that 26.47% of the sample had children with ASD who are classified as being picky eaters. Findings in the current study support previous literature, which highlights that children with ASD will present with more feeding problems than typically developing children.Citation5,Citation19–21 In addition, age is inversely correlated with feeding difficulties and food preferences: as children get older they will present with fewer feeding difficulties. The results of the BPFAS also indicated that 52.94% of caregivers found their child’s feeding difficulties to be a problem for them, with many caregivers highlighting that picky eating (12.5%) was the most common difficulty. Again, this is supported in previous literature where children with ASD present with greater selectivity than all other family members.Citation1,Citation16 This highlights important issues around caregiver education on foods that can offer added nutrition and those that are readily and easily available in South Africa. Furthermore, these findings also emphasise that parents with children with ASD experience great difficulty and may require additional support with regard to services already being offered. This may also require a more multidisciplinary approach, including input from the caregiver.
Preferred and non-preferred foods eaten by children with ASD
Children preferred starches and snack items, with the least preferred food group being fruits and vegetables. These findings are echoed in previous research, which showed that children with ASD are said to prefer starches and snack items.Citation3,Citation7–8,Citation10–11 Preference for starches and snack items put children with ASD at greater risk of dietary deficiencies. In South Africa, the cost of healthier food options is around 69% more expensive than what a family may spend on average.Citation22 Therefore, the reasons for the preference for unhealthier food options in children with ASD are not as clear cut and could be attributed to either the child’s picky eating or the food that is being offered by the family. It is unclear whether the feeding difficulty reported is a cause, consequence or a combination of both with regard to the preference for certain foods.
The food items eaten by less than 50% children with ASD were fruits and vegetables, which included raspberries, blueberries, broccoli, parsnips and apples. The reason for children eating less of these items could be due to their cost and many families not being able to afford such food items. According to STATSSA,Citation23 the average household income in an informal urban settlement is ZAR 30.00 per day for food. Households in informal urban settlements have an average of 3–4 members, which translates to ZAR 7.50–10.00 for food per person per day. At a local supermarket in urban South Africa, raspberries and blueberries cost on average ZAR 70.00 for a 350 g box. In addition, these fruits are not always available at smaller supermarkets or in more rural areas. This makes them unaffordable as well as inaccessible for a majority of South Africans. Many South Africans are also living with food insecurity,Citation24 and this can be exacerbated for those families living with a child with ASD and who are also picky eaters. Therefore, contextual factors may play a large role in the foods eaten by South African families as well as children with ASD.
Relationship between ASD age and severity of food preference
The relationship between food preference and ASD severity was also explored, and the results showed that there was an association with age. Older children presented with fewer feeding difficulties than younger children. This could be an indication that as children get older feeding difficulties may resolve and they accept a wider variety of foods, which has been supported in other literature.Citation8,Citation18 A study by Bandini et al.Citation8 reported that food refusal decreased as children became older. However, children with a high food refusal baseline continued with a limited food repertoire as they grew older and feeding issues did not resolve. Therefore, children who present with ASD and associated feeding difficulties, particularly those with high food refusal, should perhaps be provided with intervention to ensure that feeding difficulties do not persist into adolescence causing further deficiencies and global developmental delays.
Although the results did not indicate a significant relationship between ASD severity and any of the food groups, findings indicated that with increasing ASD severity children accept less food from all food groups except dairy, and this was most significant with vegetables. In addition, results showed that as ASD severity increases, children may eat fewer food items. According to the DSM V, the symptomology of ASD and the need for sameness of those with ASD is also carried over into their eating behaviours and preferences.Citation4 Children with ASD prefer eating the same foods, with the same utensils and in the same way, which results in more feeding difficulties than typically developing children. These findings were echoed in the study by Aponte and Romanczyk,Citation1 who found that children who presented with more ASD symptomology also had more severe feeding problems and had a limited repertoire of accepted food items. However, the reasons for this are still unclear and require further exploration.
In this study there were a few limitations. First, the sample size was limited and does not allow for generalisations. Nonetheless, these findings offer some unique insights into foods that are eaten and preferred by children living in South Africa, although there may still be some regional variation not reported in the current study. The small sample size also limited the interpretation of the findings, and using statistical testing and a larger sample size may yield more significant results. Second, this study alone did not sufficiently verify the validity and reliability of the BPFAS questionnaire. Third, the study looked only at food preferences of the child and did not include reports of what the family ate, which might have provided more insight into whether the families’ food choices had an influence on what the child was eating. In addition, the use of parent interviews may have provided additional insight and understanding into the food choices provided to children with ASD in South Africa. Therefore, in order to increase the validity and reliability of the scale, follow-up studies on ASD are needed not only in students but also in various age groups.
Conclusion
This study has identified common feeding difficulties in children with ASD and those being diagnosed as picky eaters across the different provinces in South Africa and compared them with difficulties that were found in the international literature. The study also highlighted that the food groups preferred by children with ASD were starches and snack items compared with fruits and vegetables, as well as those that are unique to the South African context. In addition, food availability and food choice may also be linked to food insecurity for families living in South Africa and further exploration is required. Furthermore, there was significant correlation between ASD age and food preferences, as well as an indication that children with a higher ASD level will eat fewer food items. These results suggest that both age and severity may be predictors in foods children with ASD eat, and highlighted a need for further assessment of feeding difficulties in children diagnosed with ASD. This study has implications for clinicians working in low- and middle-income countries, who need to be aware of the added difficulties faced by these families and the need to provide additional support to the family as well as the child. Furthermore, the study serves as a foundation upon which additional research can be done looking at interventions for feeding difficulties in children with ASD.
Statement of ethics
This study was approved by the department of speech pathology and audiology internal research ethics committee (HREC Non-Medical) (STA_2019_01). All participants provided written informed consent.
Acknowledgements
The authors would like to thank all the families who participated in this study and shared their experiences and made this study possible. The authors would also like to thank Andrew Nell for his assistance.
Disclosure statement
No potential conflict of interest was reported by the authors.
Additional information
Funding
References
- Aponte CA, Romanczyk RG. Assessment of feeding problems in children with autism spectrum disorder. Res Autism Spect Disord. 2016;21:61–72. doi:https://doi.org/10.20319/pijss.2017.s31.870880.
- Ledford JR, Gast DL. Feeding problems in children with autism spectrum disorders: a review. Focus Autism Other Dev Dis. 2006;21(3):153–166. doi:https://doi.org/10.1177/10883576060210030401.
- Provost B, Crowe TK, Osbourn PL, et al. Mealtime behaviors of preschool children: comparison of children with autism spectrum disorder and children with typical development. Phys Occup Ther Pediatr. 2010;30(3):220–233. doi:https://doi.org/10.3109/01942631003757669.
- Schreck KA, Williams K. Food preferences and factors influencing food selectivity for children with autism spectrum disorders. Res Dev Disabil. 2006;27(4):353–363. doi:https://doi.org/10.1016/j.ridd.2005.03.005.
- Seiverling L, Towle P, Hendy HM, et al. Prevalence of feeding problems in young children with and without autism spectrum disorder: A chart review study. J Early Interv. 2018;40(4):335–346. doi:https://doi.org/10.1177/1053815118789396.
- Sharp WG, Berry RC, McCracken C, et al. Feeding problems and nutrient intake in children with autism spectrum disorders: a meta-analysis and comprehensive review of the literature. J Autism Dev Disord. 2013;43(9):2159–2173. doi:https://doi.org/10.1007/s10803-013-1771-5.
- Vissoker RE, Latzer Y, Stolar O, et al. Eating problems and patterns among toddlers and young boys with and without autism spectrum disorders. Res Autism Spect Disord. 2019;59:1–9. doi:https://doi.org/10.1016/j.rasd.2018.12.001.
- Bandini LG, Curtin C, Phillips S, et al. Changes in food selectivity in children with autism spectrum disorder. J Autism Dev Disord. 2017;47(2):439–446. doi:https://doi.org/10.1007/s10803-016-2963-6.
- Barnhill K, Gutierrez A, Ghossainy M, et al. Dietary status and nutrient intake of children with autism spectrum disorder: a case-control study. Res Autism Spect Disord. 2018;50:51–59. doi:https://doi.org/10.1016/j.rasd.2018.03.002.
- Malhi P, Venkatesh L, Bharti B, et al. Feeding problems and nutrient intake in children with and without autism: a comparative study. Indian J Pediatr. 2017;84(4):283–288. doi:https://doi.org/10.1007/s12098-016-2285-x.
- Martins Y, Young RL, Robson DC. Feeding and eating behaviors in children with autism and typically developing children. J Autism Dev Disord. 2008;38(10):1878–1887. doi:https://doi.org/10.1007/s10803-008-0583-5.
- Black MM, Walker SP, Fernald LC, et al. Early childhood development coming of age: science through the life course. The Lancet. 2017;389(10064):77–90. doi:https://doi.org/10.1016/S0140-6736(16)31389-7.
- Woolard I. An overview of poverty and inequality in South Africa. Unpublished briefing paper, HSRC, Pretoria. July 2002.
- Adams SN, Dadabhay A, Neille J. An exploration into mothers’ experiences of feeding children with autism spectrum disorder in South Africa. Folia Phoniatr Logop. 2021;73:164–173. doi:https://doi.org/10.1159/000507928.
- Dixon P, Badoe EV, Owusu NA. Family perspectives of autism spectrum disorders in urban Ghana. J International Child Neurol Association. 2015;1(1):1–7. doi:https://doi.org/10.17724/jicna.2015.107.
- Crist W, Napier-Phillips A. Mealtime behaviors of young children: a comparison of normative and clinical data. J Dev Behav Pediatr. 2001;22(5):279–286. doi:https://doi.org/10.1097/00004703-200110000-00001.
- Nel JH, Casey A. Secondary data analyses of dietary surveys undertaken in South Africa to determine usual food consumption of the population. Public Health Nutr. 2003;7:631–644. doi:https://doi.org/10.1079/PHN2003482.
- Gray HL, Sinha S, Buro AW, et al. Early history, mealtime environment, and parental views on mealtime and eating behaviors among children with ASD in florida. Nutrients. 2018;12:1867–1881. doi:https://doi.org/10.3390/nu10121867.
- Cermak SA, Curtin C, Bandini LG. Food selectivity and sensory sensitivity in children with autism spectrum disorders. J Am Diet Assoc. 2010;110(2):238–246. doi:https://doi.org/10.1016/j.jada.2009.10.032.
- Nadon G, Feldman DE, Dunn W, et al. Mealtime problems in children with autism spectrum disorder and their typically developing siblings: A comparison study. Autism. 2011;15(1):98–113. doi:https://doi.org/10.1177/1362361309348943.
- Guler J, de Vries PJ, Seris N, et al. The importance of context in early autism intervention: a qualitative South African study. Autism. 2018;22(8):1005–1017. doi:https://doi.org/10.1177/1362361317716604.
- Temple NJ, Steyn NP. The cost of a healthy diet: a South African perspective. Nutrition. 2011;27(5):505–508. doi:https://doi.org/10.1016/j.nut.2010.09.005.
- Statistics South Africa. 2015. Census Annual Report 2014/15. Pretoria, South Africa.
- Rogan M. Gender and multidimensional poverty in South Africa: applying the global multidimensional poverty index (MPI). Soc Indic Res. 2016;126(3):987–1006. doi:https://doi.org/10.1007/s11205-015-0937-2.