
Abstract
Background:
Studies show a high prevalence of osteoporosis and fracture risk in kidney transplant candidates and recipients. However, little is known about the prevalence of osteoporosis among transplant recipients and candidates living with HIV.
Objective:
To determine the prevalence of osteopenia and osteoporosis and investigate the socio-demographic and nutritional factors associated with BMD in HIV-positive transplant candidates and recipients from an HIV-positive donor.
Methods:
In this cross-sectional study, 20 HIV- positive transplant recipients and 36 transplant candidates on haemodialysis (HD) and awaiting transplantation had BMD and body composition measured by dual-energy X-ray absorptiometry (DEXA). Vitamin D status was measured using serum 25-hydroxyvitamin D [25(OH)D]. Dietary Vitamin D and calcium intake was obtained from a single 24-hour recall.
Results:
Participants were mainly black African (92.9%), male (55.4%) with a mean age of 43.8 ± 8.3 years. Serum 25(OH)D levels were low for the group as a whole, with a mean of 22.04 ± 12.74 ng/ml. Osteoporosis was more prevalent amongst transplant recipients (20.0%) than transplant candidates (13.9%). Conversely, osteopenia was present amongst transplant candidates (27.8%). T-scores strongly correlated positively, with lean mass and BMD of the spine (r = 0.707, p = 0.007), and moderately, with each side of the total hip BMD (r = 0.455, p = 0.007 and r = 0.420, p = 0.007). There was a significant positive association between dietary calcium and all BMD sites in transplant recipients only.
Conclusion:
The prevalence of osteoporosis was similar, and in some cases, lower than in transplant recipients elsewhere. Lean mass was positively associated with BMD, and in transplant recipients, dietary calcium intake was positively associated with BMD emphasising the role of diet and exercise in preserving BMD.
Introduction
Following a kidney transplant, bone mineral density (BMD) decreases by 2.9% to 9.0%, with most changes occurring within the first 18 months.Citation1 BMD loss is largely, though not exclusively, thought to be due to the high doses of glucocorticosteroids in the early transplant periodCitation1 as prior to transplantation, deterioration in bone micro-structure and density from chronic kidney disease-mineral and bone disease (CKD-MBD) is already present,Citation2 and worsened during dialysis.Citation3 Consequently, both transplant candidates and recipients have a greater prevalence of osteoporosis and a higher frequency of fractures than the general population.Citation4
People living with HIV also have a lower bone density and a three-fold higher prevalence of osteoporosis compared to HIV-negative controls.Citation5 Virus related inflammation and HIV proteins affect bone modelling, and are exacerbated by infections, nutritional deficiencies and a low CD4 count.Citation6 Furthermore, the initiation of antiretrovirals, further decreases BMD by 2.0% to 6.0% in the first two years of treatment BMD, before steadying or showing a slight increase thereafter.Citation7
Considering the effects that both chronic kidney disease (CKD) and HIV have, independently on the skeletal system, it is highly likely that living with this double burden, increases the likelihood of significant changes in bone density. However, this has not been previously investigated. The aim of this study was to determine the prevalence of osteoporosis in this unique group, as well as their association with selected socio-demographic, clinical and nutritional parameters.
Methods
Participants
The HIV “positive-to-positive” kidney transplant programme is a national programme with candidates and recipients residing across South Africa. However, it runs from a single centre—Groote Schuur Hospital (GSH) in Cape Town. Potential candidates are referred by their attending nephrologist to determine eligibility for the transplant waiting list. Whilst awaiting a donor, candidates continue with dialysis at a private or government dialysis facility in their home town. Patients travel to GSH for transplantation returning home for follow up by their nephrologist. At the time of the study, the programme was still in its infancy and in the process of establishing a formal patient database. For the purposes of this study, the most recent list of transplant recipients and potential candidates was obtained from GSH. This amounted to 92 prospective participants that were contactable either telephonically or via outpatient clinics. Despite the number of candidates and recipients in this programme being small, it represented 100% of the global population of this unique group, at the time.
indicates an overview of participant enrolment. The 76 patients from six provinces that agreed to participate and provided written consent were assigned to two categories namely (i) HIV-positive transplant recipients who received a kidney from a HIV-positive donor; and (ii) HIV-positive transplant candidates who were on the waiting list to receive a kidney from a HIV-positive donor. Ethics approval was obtained from the University of KwaZulu-Natal’s Biomedical Research Ethics Committee (Approval number BE 327/13).
Figure 1: Patient participation flow chart
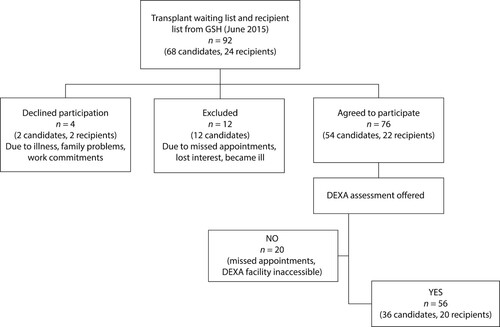
All 76 participants were invited to undergo a dual-energy X-ray absorptiometry (DEXA) evaluation. However only 56 participants (36 transplant candidates, 20 transplant recipients) underwent BMD assessment. Those that did not have a DEXA evaluation, were either unwilling to travel the distance to the DEXA facility or missed two or more appointments for various reasons.
Socio-demographic and clinical information
Socio-demographic information was collected using a single interviewer-administered structured questionnaire developed for the purpose of the study. Clinical information was obtained from medical records or during participant interviews.
Bone densitometry measurements
DEXA assessments were conducted at a radiology centre in close proximity to where participants resided. The Hologic (Models: Discovery or Horizon) were used at eight of the centres, and the GE Lunar Prodigy (Advance) at two of them.
Assessments were conducted according to standard radiological procedures, with height and weight taken prior to DEXA assessment. Body mass index (BMI) was calculated as weight divided by height squared (kg/m2) and classified as: Underweight (<18.50), normal (18.50–24.99), overweight (≥25.00–29.99), obese class I (30.00–34.99), obese class II (35–39.99) and obese class III (≥40).Citation8
BMD was recorded at L1–L4 of the lumbar spine (LS), and each side of the total hip (TH) and femoral neck (FN). These values were presented as absolute values (g/m2). Z-scores presented as standard deviations (SD) are preferred in younger patients as the score compares the individual’s BMD with the mean value in a population of similar age and sex.Citation9 T-scores reflect comparisons as the SD above or below the mean values of a healthy population of young adults.Citation10 T-scores were used to classify BMD according to the World Health Organization (WHO) criteria: Normal (T-score ≥ −1.0); osteopenia (T-score between −1.0 and −2.5); osteoporosis (T-score ≤ −2.5); or severe osteoporosis (T-score ≤ −2.5 with one or more fractures).Citation11 All DEXA results and classifications were reviewed by a clinician. Osteoporosis classification by region was made based on the BMD measurement site with the lowest T-score.
Vitamin D measurement
Serum levels of 25-hydroxyvitamin D [25(OH)D] was measured using chemiluminescence (Immunlite 2000, Siemens, USA). Normal and deficiency states were defined using laboratory defined parameters: Deficiency: < 20 ng/ml; partial deficiency: 20–29 ng/ml; and optimal level: > 30 ng/ml.Citation12
Dietary intake
Information on dietary vitamin D and calcium intake was obtained from a single quantified 24-hour recall by experienced dietitians using standardised techniques to minimise misclassification and misrepresentation of information.Citation13 All dietary data was analysed using Foodfinder 3 for WindowsR (The South African Medical Research Council).
Pilot study
A pilot study was conducted on eight and four HIV-negative transplant candidates and recipients respectively. As these participants were not HIV-positive, and therefore were not included in the main study. The socio-demographic questionnaire and the 24-hour recall were assessed for understanding and ease of administration during the pilot study. Following which they were both deemed acceptable for use in the main study. However due to logistical challenges repeat 24-hour recalls were not feasible.
Statistics
Data was analysed using the Statistical Package for Social Sciences (SPSS®) version 25.0. Means and standard deviations were calculated for all continuous variables and frequencies with percentages for the categorical variables. Independent samples t-test was used to determine differences between transplant candidates and recipients and between males and females for clinical and nutritional variables. Chi-square tests and ANOVA were used to determine associations between osteopenia/osteoporosis and categorical and numerical variables respectively. Pearson’s correlation was used to determine the relationship between BMD and other scale scores. Results with a P value of <0.05 was taken as statistically significant.
Results
Participant characteristics
The final study sample consisted of 56 HIV-positive participants with end stage renal disease (ESRD). Of these, 20 had received a transplant from a HIV-positive donor and 36 were receiving haemodialysis (HD) while awaiting a transplant. The majority of participants () were black African 52 (92.9%), and male 31(55.4%), with a mean age of 43.8 ± 8.3 years. The mean duration of time on dialysis for candidates on dialysis was 4.5 ± 3.0 years versus the mean time since transplantation (2.9 ± 2.3 years) for recipients. Most participants were hypertensive 51 (91.1%), three were receiving treatment for hypercholesterolaemia and 10 transplant candidates were diabetic. HIV parameters showed 47 (92.2%) of all participants had viral loads lower than detectable limits, and a mean CD4 + count of 412.57 ± 230.00 cells/µL. Vitamin D levels measured as serum 25(OH) D, was low across the entire study sample, with a mean value of 22.04 ± 12.74 ng/ml. Transplant recipients had a lower mean 25(OH) D compared to candidates. Optimal levels were observed among 9 (29.0%) of transplant candidates, while 71.0% were either partially deficient or deficient. Even fewer transplant recipients had optimal levels 2(11.1%), while more 18 (88.9%) were either partially deficient or deficient. There were no significant differences in these values between the two treatment groups.
Table 1: Demographic and clinical characteristics of the study sample
Bone mineral density measurements
There were no significant differences in BMD and corresponding T- and Z-scores of the LS, TH and FN values between the two treatment groups (). According to the WHO classification, BMD was normal among 36 (64.3%) of participants. However, osteoporosis was more prevalent among transplant recipients (20.0%), especially in the spine, than transplant candidates (13.9%), while only 1 (5.0%) transplant recipient had osteopenia. Conversely, more candidates 10 had osteopenia (27.8%), while 5 (13.9%) had osteoporosis, mainly in the LS and FN. When categorised by sex, more women were osteoporotic than osteopenic, while the reverse held true for men ().
Figure 2: Classification of osteoporosis and osteopenia by sex and treatment group
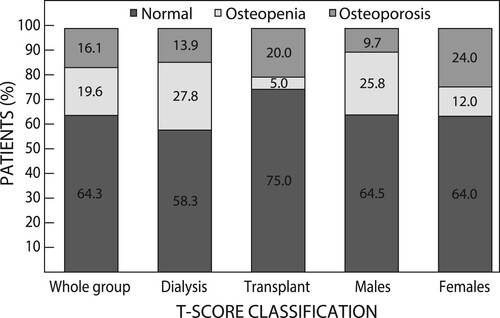
Table 2: BMD and osteoporosis classification in transplant candidates and transplant recipients
Nutritional status parameters
The mean BMI of transplant recipients was 24.1 ± 4.5 kg/m2 compared to the higher mean BMI (27.7 ± 4.5 kg/m2) of transplant candidates (p ≤ 0.031) (). Significantly more transplant recipients had a normal BMI 13 (86.7%), compared to transplant candidates 3 (16.7%) (p = 0.031), and significantly more transplant candidates were overweight compared to the transplant recipients (50.0% versus 6.7%, p = 0.031).
Table 3: Body composition and dietary intake parameters of the study sample
Table 4: Correlations between selected variables and BMD, T-scores and Z- scores of the spine, total hip and femoral neck for the whole group
Mean daily calcium and vitamin D intake was 485.4 ± 227.0 mg and 4.61 ± 4.5 mg respectively, with no significant differences between the two treatment groups.
Chi-square analysis showed no significant relationships between osteopenia/osteoporosis with categorical measures of BMI, co-morbidities, sex and vitamin D status. ANOVA applied to osteopenia/osteoporosis group categories with continuous variables showed that length of time on current treatment modality was significantly longer for participants with osteoporosis than those with a normal BMD (p = 0.025). In addition, lean mass was significantly lower for those with osteoporosis compared to normal and osteopenic participants (p = 0.016), while those with a normal BMI had significantly lower LS T-scores than overweight participants.
Correlation analysis showed that absolute BMD and T-scores correlated with BMI at all three skeletal measurement sites (). T-scores strongly correlated with lean mass and BMD of the spine (r = 0.707, p = 0.007), and moderately with BMD at the left and right TH (r = 0.455, p = 0.007 and r = 0.420, p = 0.007) respectively. Fat mass did not correlate with osteoporosis or BMD. For the study sample as a whole, serum 25(OH) D did not correlate with BMD or T-scores or Z-scores. Calcium intake was associated with the T-score of the TH. However, when split by treatment group (), there was a significant positive association with dietary calcium intake at all BMD measurement sites for transplant recipients. No association was found between calcium intake and BMD amongst transplant candidates. However, Z-scores of the FN were negatively associated with vitamin D intake (r = −399, p = 0.036).
Table 5: Correlations between dietary calcium and BMD, T-scores and Z-scores of the spine, total hip and femoral neck in transplant recipients
Discussion
In the present study, 13.9% of transplant candidates had osteoporosis (more were osteopenic). This is much lower than the prevalence of osteoporosis (33.0% and 34.0%) reported in HD populations elsewhere. Citation14, Citation15
A slightly higher prevalence (20.0%) was found in this study’s recipients. This is likely, given the added effect of immunosuppressants on bone already compromised by CKD.Citation16 Transplant recipients elsewhere, without HIV reported incidences of 26.0% Citation17 or regional values of 12.4%–21.3% in the LS and between 9.8%–45.1% in the FN Citation18, Citation19 compared to 15.0% (LS), and 5.0% (TH) in the present study. Although the present population was younger than patients in dialysis and transplant programmes elsewhere, it was still an unexpected finding, that 75.0% of recipients had a normal BMD, especially in the presence of comorbid HIV, which is typically associated with lowered BMD in 67.0% of people living with HIV.Citation5
In both groups in this study, either as the number of years on dialysis, or post transplant years, a positive correlation with osteoporosis and BMD T-scores at the right FN was shown. Early research investigating fracture risk in transplant recipients versus those who stay on dialysis (n = 101 039) Citation20 found significant differences in fracture risks between the two groups, in that kidney transplant recipients had a 34% higher fracture risk compared to those on dialysis in the critical period immediately following a transplant. Severe bone loss is associated with high doses of immunosuppressants used in induction therapy in the immediate post-transplant period.Citation21 This risk decreases over time, together with the improvement of pre-transplant bone risk factors, such that between one to three years post-transplant, the risk is lowered to below those on dialysis,Citation21 and normalised ten years post-transplant.Citation22 Additionally, those who spent more than one year on dialysis had a greater fracture risk after a transplant than those who were on dialysis for less than three months, due to contributory factors such as poor nutritional status, acidosis and hyperparathyroidism amongst others.Citation21
Apart from disease and treatment related risk factors, traditional risk factors for the development of osteoporosis including age, female sex (particularly after menopause) and ethnicity also apply.Citation23 The current study found a weak association between BMD Z-score and age. Although more women were diagnosed with osteoporosis, there was no significant association with BMD or osteoporosis and sex, or significant differences in these variables between males and females. This is possibly due to the young mean age of females (42.9 ± 8.6 years) in the current sample. Similarly, no association was found between BMD and age or sex among young Iranian dialysis (mean age 38.0 ± 10.6 years) and transplant participants (39.0 ± 11.8 years),Citation4 however an inverse relationship between BMD and age was evident in dialysis patients with a higher mean age (55.7 ± 13.5 years).Citation24 Likewise in healthy pre-menopausal women even those older than 50 years of age, there was no significant deterioration in BMD with age in but a significant decline followed menopause.Citation25
In this study, 92.9% of the sample was black for whom higher BMDs have been observed when compared to other populations.Citation9 A study of BMD among black and white South African women attributed these disparities to differences in body weight.Citation26 BMI, weight and BMD investigated in males (n = 230) showed that higher body weights are associated with higher hip and vertebral BMDs such that overweight and obese individuals are at a lower risk of osteoporosis.Citation27 Similarly, in the current study, BMI correlated strongly to BMD at all measurement sites, with significantly lower T-scores at the LS in normal BMI participants than in overweight participants. Body weight is a combination of lean mass and fat mass, and in the current study, BMD was positively correlated with lean mass, and not with fat mass, in agreement with results obtained from a meta-analysis of 44 studies (n = 20 226) showing a stronger association between lean mass and BMD than fat mass.Citation28 This supports the importance of the muscle-bone unit identifying lean mass as a potentially modifiable risk factor in skeletal health.
Appropriate exercise can improve muscle mass.Citation29 Exercise stimulates protein synthesis, which in turn requires adequate quantity and quality of dietary protein that is appropriately timed to support muscle synthesis Apart from protein, two other nutrients that have been linked to skeletal health are vitamin D and calcium.Citation29 Consistent with findings in dialysis Citation30 and kidney transplant elsewhere,Citation18 the majority of this study’s population did not have sufficient 25 (OH)D levels. Vitamin D’s role in optimising dietary protein for muscle, calcium metabolism and bone mineralisation is thought to be vital for skeletal health. Studies investigating the association between 25(OH)D and BMD however, yield conflicting results. One likely factor for the discrepancy is based on race and ethnicity. A significant association exists between serum 25(OH)D and BMD in white males but not in black males.Citation31 Similarly, the present study found no association between serum 25(OH) D and BMD or osteoporosis in this predominantly black study sample. Cosman and colleagues suggested that the preservation of skeletal integrity despite suboptimal 25(OH)D in the black population, is possibly due to resistance to the bone-resorption process afforded by black ethnicity.Citation32
With participants distributed across six provinces securing three 24-hour recalls proved challenging. Therefore, a single 24-hour recall and a food frequency questionnaire (to be reported elsewhere) were used for dietary assessment. Typically, usual intake is more accurately reflected by multiple 24-hour recalls in the general population, however adult patients on dialysis show little daily variation in diet due to the restrictive nature of the diet.Citation33 The vitamin D intake of transplant candidates was close to recommended levels. With the exception of a weak association at the FN amongst transplant candidates, there was no association between dietary vitamin D intake and BMD at any other site for either treatment group. However, optimising 25(OH)D still deserves due consideration for muscle-bone health.Citation29 Additionally, vitamin D deficiency is independently associated with disease progression in HIVCitation34 and reduced glomerular filtration rate (GFR), one year post transplantCitation35 Despite similar intakes of calcium between both groups, only in transplant recipients was calcium intake positively associated with BMD at all sites. The Kidney Disease Outcomes Quality Initiative (KDOQI) 2020 guidelines note the complexity of calcium balance in kidney disease, and the challenge in providing safe adequate recommendations for calcium intake.Citation36 Dietary adequacy can be improved through nutrition education, and monitored supplementation when necessary.Citation37
This study provides the first insight into the prevalence of osteoporosis in HIV-positive transplant candidates and recipients from a HIV-positive donor. Although this study’s population size was small, at the time of the study, it represented 100% of the global population of this unique group. Resource constraints limited the information available, however the authors note that additional parameters including PTH, bone markers and serum calcium, would have added value to data interpretation. However the data can be used for comparison in subsequent studies. Future research should include information on physical activity and menopausal status.
In summary, the prevalence of osteoporosis is similar to, if not slightly lower than that of transplant recipients and patients undergoing dialysis elsewhere. The higher prevalence of osteopenia among transplant candidates, highlights the importance of introducing preventative strategies prior to transplantation, given the rapid deterioration of BMD post-transplant and the difficulty associated with treating osteoporosis after onset. The link between calcium intake and lean mass with BMD are important and optimistic findings, in that diet and exercise are potentially safe, cost effective interventions that can minimise premature bone loss and fracture risk contributing to a better quality of life the extra years gained by transplantation.
Disclosure statement
No potential conflict of interest was reported by the author(s).
References
- Weisinger JR, Carlini RG, Rojas E, et al. Bone disease after renal transplantation. Clin J Am Soc Nephrol. 2006;1(6):1300–1313. https://doi.org/10.2215/CJN.01510506
- Lima GA, Paranhos-Neto Fde P, Pereira GR, et al. Osteoporosis management in patient with renal function impairment. Arq Bras Endocrinol Metabol. 2014;58(5):530–539. https://doi.org/10.1590/0004-2730000003360
- Avramovski P, Sikole A. The progression of bone mineral density loss in dialysis patients compared with the general population. Korean J Intern Med. 2012;27(4):436–442. https://doi.org/10.3904/kjim.2012.27.4.436
- Nouri-Majalan N, Sanadgol H, Rahimian M, et al. Bone mineral density in kidney transplant recipients and patients on hemodialysis. A comparison with healthy individuals. IJKD. 2008;2(3):154–159.
- Brown TT, Qaqish RB. Antiretroviral therapy and the prevalence of osteopenia and osteoporosis: a meta-analytic review. AIDS. 2006;20(17):2165–2174. https://doi.org/10.1097/QAD.0b013e32801022eb
- McComsey GA, Tebas P, Shane E, et al. Bone disease in HIV infection: A practical review and recommendations for HIV care providers. Clin Infect Dis. 2010;51(8):937–946. https://doi.org/10.1086/656412
- Premaor MO, Compston JE. The hidden burden of fractures in people living with HIV. JBMR Plus. 2018;2(5):247–256. https://doi.org/10.1002/jbm4.10055
- World Health Organization. Obesity: preventing and managing the global epidemic. report of a WHO consultation (WHO technical report series 894). 2000 [cited 2018 Mar 12]. Available from: https//Obesity: preventing and managing the global epidemic. Report of a WHO Consultation (WHO Technical Report Series 894). Geneva; 2000.
- Wilkin LD, Jackson MC, Sims TD, et al. Racial/ethnic differences in bone mineral density of young adults. Int J Exerc Sci. 2010;3(4):197–205.
- Bradford R. DXA scanning to diagnose osteoporosis: Do you know what the results mean? Cleve Clin J Med. 2003;70(4):353–360. https://doi.org/10.3949/ccjm.70.4.353
- Kanis JA on behalf of the World Health Organization Scientific Group. Assessment of osteoporosis at the primary health-care level. Technical Report. World Health Organization Collaborating Centre for Metabolic Bone Diseases, University of Sheffield, UK. 2007: Printed by the University of Sheffield. 2007 [Cited 2023 May 18]. Available from: https://frax.shef.ac.uk/FRAX/pdfs/WHO_Technical_Report.pdf.
- Holick MF. The vitamin D epidemic and its health consequences. J Nutr. 2005;135(11):2739S–2748S. https://doi.org/10.1093/jn/135.11.2739S
- Nelson M, Bingham SA. Assessment of food consumption and nutrient intake. In: Margetts BM, Nelson M, editor. Design concepts in nutritional epidemiology. Oxford: Oxford University Press; 1997. p. 123–169.
- Brunerová L, Ronová P, Verešová J, et al. Osteoporosis and impaired trabecular bone score in hemodialysis patients. Kidney Blood Press Res. 2016;41:345–354. https://doi.org/10.1159/000443439
- Malluche HH, Davenport DL, Cantor T, et al. Bone mineral density and serum biochemical predictors of bone loss in patients with CKD on dialysis. Clin J Am Soc Nephrol. 2014;9(7):1254–1262. https://doi.org/10.2215/CJN.09470913
- Song L, Xie X, Peng L, et al. Mechanism and treatment strategy of osteoporosis after transplantation. Int J Endocrinol; 2015;1. https://doi.org/10.1155/2015/280164
- Ahmadpoor P, Reisi S, Makhdoomi K, et al. Osteoporosis and related risk factors in renal transplant recipients. Transplant Proc. 2009;41(7):2820–2822. https://doi.org/10.1016/j.transproceed.2009.07.018
- Savaj S, Ghods FJ. Vitamin D, parathyroid hormone, and bone mineral density. IJKD. 2012;6(4):295–299.
- Najar MS, Mir MM, Muzamil M. Prevalence of osteoporosis in patients with chronic kidney disease (stages 3–5) in comparison with age- and sex-matched controls: A study from Kashmir valley tertiary care center. Saudi J Kidney Dis Transpl. 2017;28:538–544. https://doi.org/10.4103/1319-2442.206439
- Ball AM, Gillen DL, Sherrard D, et al. Risk of hip fracture among dialysis and renal transplant recipients. JAMA. 2002;288(23):3014–3018. https://doi.org/10.1001/jama.288.23.3014
- Julian BA, Laskow DA, Dubovsky J, et al. Rapid loss of vertebral mineral density after renal transplantation. N Engl J Med. 1991;325(8):544–550. https://doi.org/10.1056/NEJM199108223250804
- Carlini RG, Rojas E, Weisinger JR, et al. Bone disease in patients with long-term renal transplantation and normal renal function. Am J Kidney Dis. 2000;36(1):160–166. https://doi.org/10.1053/ajkd.2000.8289
- Lin X, Xiong D, Peng Y, et al. Epidemiology and management of osteoporosis in the people's republic of China: current perspectives. Clin Interv Aging. 2015;10:1017–1033.
- Huang GS, Chu TS, Lou MF, et al. Factors associated with low bone mass in the hemodialysis patients. BMC Musculoskelet Disord. 2009;10(60). https://doi.org/10.1186/1471-2474-10-60
- Kadam NS, Chiplonka SA, Khadilka AV, et al. Prevalence of osteoporosis in apparently healthy adults above 40 years of age in Pune city, India. Indian J Endocrinol Metab. 2018;22(1):67–73. https://doi.org/10.4103/ijem.IJEM_438_17
- Conradie M, Conradie MM, Kidd M, et al. Bone density in black and white South African women: contribution of ethnicity, body weight and lifestyle. Arch Osteoporos. 2014;9:193, https://doi.org/10.1007/s11657-014-0193-0
- Salamat MR, Salamat AH, Abedi I, et al. Relationship between weight, body mass index, and bone mineral density in men referred for dual-energy X-ray absorptiometry scan in Isfahan, Iran. J Osteoporos. 2013. https://doi.org/10.1155/2013/205963
- Ho-Pham LT, Nguyen UDT, Nguyen TV. Association between lean mass, fat mass, and bone mineral density: A meta-analysis. J Clin Endocrinol Metab. 2014;99(1):30–38. https://doi.org/10.1210/jc.2013-3190
- Agostini D, Zeppa SD, Lucertini F, et al. Muscle and bone health in postmenopausal women: role of protein and vitamin D supplementation combined with exercise training nutrients. 2018;10(1103). https://doi.org/10.3390/nu10081103
- Polymeris A, Doumouchtsis K, Grapsa E. Bone mineral density and bone metabolism in hemodialysis patients. Correlation with PTH, 25OHD3 and leptin. Nefrologia. 2012;32(1):73–78.
- Hannan MT, Litman HJ, Araujo AB, et al. Serum 25-hydroxyvitamin D and bone mineral density in a racially and ethnically diverse group of men. J Clin Endocrinol Metab. 2008;93(1):40–46. https://doi.org/10.1210/jc.2007-1217
- Cosman F, Morgan DC, Nieves JW, et al. Resistance to bone resorbing effects of PTH in black women. J Bone Miner Res. 1997;12(6):958–966. https://doi.org/10.1359/jbmr.1997.12.6.958
- Stark S, Snetselaar L, Hall B, et al. Nutritional intake in adult hemodialysis patients. Top Clin Nutr. 2011;26(1):45–56. https://doi.org/10.1097/TIN.0b013e3181faba4c
- Viard J, Souberbielle J, Kirk O, et al. Vitamin D and clinical disease progression in HIV infection: results from the EuroSIDA study. AIDS. 2011;25(10):1305–1315. https://doi.org/10.1097/QAD.0b013e328347f6f7
- Bienaimé F, Girard D, Anglicheau D, et al. Vitamin D status and outcomes after renal transplantation. J Am Soc Nephrol. 2013;24(5):831–841. https://doi.org/10.1681/ASN.2012060614
- Ikizler TA, Burrowes JD, Byham-Gray LD, et al. KDOQI clinical practice guideline for nutrition in CKD: 2020 update. Am J Kidney Dis 2020;76(3):S1–S107. https://doi.org/10.1053/j.ajkd.2020.05.006
- Yu RW, Faull RJ, Coates PTH, Coates PS. Calcium supplements lower bone resorption after renal transplant. Clin Transplant. 2012; 26: 292–299.