
ABSTRACT
Purpose
To investigate the role of soluble programmed cell death ligand 1 (sPD-L1) protein in plasma of patients with Peripheral T-cell lymphoma (PTCL).
Methods
In total, 80 patients with newly diagnosed PTCL and 75 healthy controls were enrolled. Levels of sPD-L1 were measured by ELISA at diagnosis and after 3–8 courses of chemotherapy. The expression of PD-L1 in tumor tissues from nine PTCL patients was also detected.
Results
sPD-L1 was higher in PTCL patients at diagnosis compared to healthy subjects (P < 0.0001). Patients in the intermediate/high-risk disease group had a higher level of sPD-L1 than patients in the low-risk group (P = 0.0003). Elevated sPD-L1 (≥176.30 pg/ml) was the only biomarker for PTCL that retain statistical significance in multivariate analysis. Patients in the low-risk group with sPD-L1 ≥ 176.30 pg/ml had an adverse prognosis. Histological analysis showed that the expression of PD-L1 in tissues was positively correlated with sPD-L1 levels in plasma (Spearman = 0.9177, P = 0.0013).
Conclusions
sPD-L1 is a sensitive biomarker predicting clinical outcomes in PTCL.
1. Introduction
Peripheral T-cell lymphoma (PTCL) is a rare disease, comprising only 5–10% of all lymphoid neoplasms [Citation1], but it shows a higher prevalence in China (23–27%) [Citation2]. As a biologically and clinically heterogeneous group of diseases, PTCL remains a therapeutic challenge. The outcomes of conventional chemotherapy have been shown to be unsatisfactory, with 16–41% of patients experiencing disease relapse or progression [Citation3,Citation4]. Furthermore, there is an unmet need for identification of PTCL patients at a high risk of treatment failure. Although a number of prognostic indexes have been developed for PTCL, including the International Prognostic Index (IPI), Prognostic Index for PTCL-U (PIT) and Prognostic Index of Natural Killer/ T (NK/T) Cell Lymphoma with Epstein–Barr virous DNA (PINK-E), these indexes rely predominantly on clinical parameters, and some patients with poor prognosis remain unidentified.
Programmed death 1 (PD-1) protein is a key immune-checkpoint receptor. In tumor tissues, PD-1 expressed on T cells interacts with its ligands PD-L1 on malignant tumor cells resulting in T-cell exhaustion and immune escape. It has been recently shown that blockade of PD-1 or PD-L1 by monoclonal antibodies may lead to significant antitumor effects. Increasing evidence has also suggested that the level of soluble PD-L1 (sPD-L1) in peripheral blood was associated with patient clinicopathological characteristics, treatment response, and prognosis in various types of tumors [Citation5–9]. However, there is a scarcity of data regarding the clinical implications of sPD-L1 for PTCL patients. To the best of our knowledge, Nagato et al. [Citation10] and Bi et al. [Citation11] have only reported that the level of sPD-L1 is significantly upregulated in NK/T cell lymphoma compared with healthy controls and associated with prognosis. Therefore, it is of great significance to explore the clinical significance of sPD-L1 in the plasma of patients with PTCL. We measured sPD-L1 from plasma collected from PTCL patients at the time of diagnosis and after treatment, in order to examine the immune-checkpoint effect on survival, and determine the source of sPD-L1. We further compared plasma levels of sPD-L1 with the expression of PD-L1 in tumor tissue.
2. Patients and methods
2.1. Patients
Eighty patients with PTCL were analyzed in this study, all of whom were newly diagnosed according to the World Health Organization classification [Citation12] of hematological malignancies at PUMCH (Peking union medical college hospital) between March 2016 and April 2018. Patients who had a previous medical history of indolent lymphoma, other primary malignant tumors or complications from other autoimmune diseases were excluded. Serum lactate dehydrogenase (LDH) was considered elevated at ≥ 250 IU/ml. The International Prognostic Index (IPI) and Ann Arbor staging were determined for each patient based on published criteria [Citation13,Citation14]. Patients with NK/T cell lymphoma received GDP/ML (gemcitabine, dexamethasone, cisplatin, methotrexate, L-asparaginase) or SMILE (steroid, methotrexate, ifosfamide, L-asparaginase, and etoposide) regimen as first-line therapy, and other patients received cyclophosphamide, doxorubicin, vincristine and, prednisone (CHOP) or CHOP-like therapies. We randomly selected 75 healthy people from our physical examination center as a healthy control group. The inclusion criteria for normal control group were: 18–78 years old, had no history of cancer or autoimmune diseases, as well as no infectious, cardiovascular or cerebrovascular diseases in the past 1 month.
Plasma was obtained from PTCL patients at diagnosis and after 3–8 cycles of treatment or at the time of relapse/progression. Tumor tissues were collected at diagnosis from nine patients and preserved in formalin-fixed paraffin-embedded (FFPE) blocks at PUMCH. The ethics committee of PUMCH approved this trial; all patients and volunteers provided informed consent.
2.2. Measurement of sPD-L1 by ELISA
Soluble PD-L1 was measured using an enzyme-linked immunosorbent assay (Abcam ab 214565), according to the manufacturer's instructions. The assay had a minimum concentration of the detectable dose of sPD-L1of 21.87 pg/ml and the minimum quantitative range was 1400 pg/ml. Each sample was analyzed in duplicates.
2.3. Immunohistochemical staining
FFPE samples were prepared from the pretreatment biopsy tissues of nine PTCL patients. Immunohistochemical staining was using routine staining protocols and the following antibodies: anti-PD-L1 (Servicebio GB13339, 1:400), anti-CD3 (Servicebio GB13014, 1:100) mAbs. Serial sections were used for PD-L1 and CD3 staining. Stained specimens were then viewed independently at 200×by two investigators who were blinded to the corresponding clinical outcome.
2.4. Follow-up
Patients diagnosed with PTCL were followed up by telephone and hematology clinic visits every 3 months after the end of treatment. A total of 43 patients who had finished 6–8 cycles of chemotherapy or had disease progression were monitored until December 2017, with 10 (2–20) months as the median follow-up time. The other 37 patients did not complete chemotherapy or did not relapse or die during treatment. Progression-free survival (PFS) refers to the time from diagnosis to the date of disease progression, death, or the most recent follow-up. Overall survival (OS) time refers to the time from diagnosis to the date of last follow-up or mortality from any cause.
2.5. Statistical analysis
SPSS 19.0 software and GraphPad Prism 7.0 were used for statistical analysis. The Kaplan-Meier method and the log-rank test were used for univariate analysis and the generation of survival curves. Variables with statistical significance in univariate analysis were included in multivariate analysis using the Cox proportional hazards model. Optimal cut-off values for sPD-L1 levels predicting survival were determined using the receiver operating characteristics (ROC) curve analysis. The ROC curve analysis was based on OS analysis of all 43 PTCL patients, the symbols + or – is for survival at last follow up. Continuous variables were compared using a two-tailed Student's t-test, and categorical variables were compared using chi-square test. Image-Pro Plus 6.0 software (Media Cybernetics, Inc., Rockville, MD, USA) was used to analyze the immunohistochemical results. The expression of CD3 and PD-L1 on specimen were measured by integrated optical density (IOD). The relationship between the sPD-L1 values and the expression of PD-L1 in tissues was evaluated by the Spearman's rank correlation. Differences were considered statistically significant with a two-sided P value of <0.05.
3. Results
3.1. Clinical data
summarizes the demographic characteristics of all 80 PTCL patients. The median age was 46.5 (18–78) years, and the male: female ratio was 46:34. A total of 43 patients finished 6–8 cycles of chemotherapy or had disease progression; none were lost to follow-up. The median number of treatment cycles was 6 (1–8). The median follow-up duration of these 43 patients was 10 (2–20) months, and the median OS and PFS were 10 (range 2–20) months and 9 (0–20) months respectively. The 1-year OS and PFS rate were 72.07% and 60.10%, respectively. Overall response rate (ORR) was 44.19% (10/43 complete remission (CR), 9/43 partial remission (PR)). Additionally, 24 patients had progressive disease (PD) after treatment and 11 died of primary disease progression. In addition, the median age of the 75 healthy controls was 42 (17–75) years, with a male: female ratio of 41:34.
Table 1. Clinical data of 80 newly diagnosed PTCL patients.
3.2. Elevated sPD-L1 levels detected PTCL plasma and correlated with poor prognosis
Remarkably, sPD-L1 levels were found to be significantly higher in the plasma collected at diagnosis from PTCL patients (176.6 ± 17.11 pg/ml) compared with healthy subjects (23.43 ± 0.4956, pg/ml, P < 0.0001) ((a)). Patients in the intermediate /high-risk group (IPI ≥ 2) had higher levels of sPD-L1 than that the low-risk group (IPI < 2, P = 0.0023). Ann Arbor stage III-IV, EBV-DNA copies ≥ 500, elevated LDH and more than one extra-nodal localization were significantly associated with high-level sPD-L1 ().
Figure 1. (a) Plasma sPD-L1 protein measurement in 75 healthy subjects and for the 80 patients with PTCL collected at diagnosis. (b) Plasma sPD-L1 protein measurements at diagnosis, for patients that achieved (CR) or did not achieve (non-CR) complete remission. Plasm Kaplan–Meier estimates of OS (c) and PFS (d) considering the cutoff point for sPD-L1 at 176.30 pg/ml.
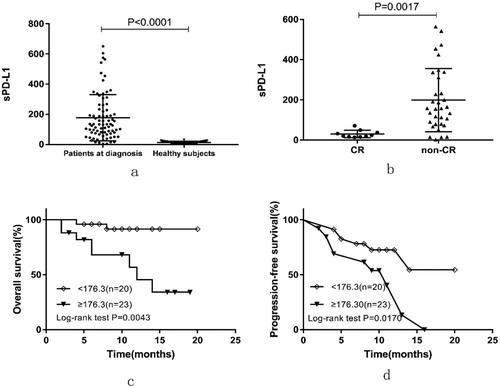
In total, 10 out of 43 patients achieved CR by the end of treatment. The level of sPD-L1 at the time of diagnosis of patients with CR (30.18 ± 5.799 pg/ml) was significantly lower than that of patients who did not achieve CR (199 ± 27.39 pg/ml, P = 0.0017) ((b)). We further investigated whether sPD-L1 levels correlated with prognosis of PTCL. Based on the ROC curve analysis for survival, the optimal sPD-L1 cut-off value was 176.30 pg/ml, the area under the ROC curve was 0.739, sensitivity was 80.0% and specificity was 75.8%. Therefore, we separated the patients into two groups, low-sPD-L1 and high-sPD-L1, using a cut-off value of 176.30 pg/ml. Patients with high-sPD-L1 had a poorer prognosis than low-sPD-L1 patients with 1-year OS rate estimated at 45.52% versus 95.58% (P = 0.0043, (c)) and with a 1-year PFS rate of 40.39% versus 72.67% (P = 0.0170, (d)). After initial therapy, patients with sPD-L1 ≥ 176.30 pg/ml achieved a significantly lower CR rate (8/26, 30.77%) than those with sPD-L1 < 176.30 pg/ml (2/17, 11.76%).
Considering patient clinical characteristics, univariate analysis identified IPI ≥ 2, elevated LDH, high levels of sPD-L1 as factors associated with poor OS and PFS. High level of sPD-L1 was the only factor remaining significant after multivariate analysis for OS, and high level of sPD-L1 and elevated LDH were risk factors for PFS ().
Table 2. Univariate and multivariate analyses of prognostic factors in patients with PTCL.
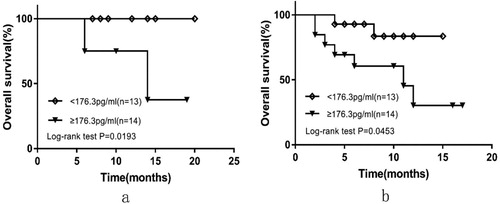
Further, 16 of 43 patients were in low-risk group (IPI <2) and 27 were in the intermediate/high-risk group (IPI ≥2). High-sPD-L1 patients had a significantly poorer outcome than those with low-sPD-L1 in the low-risk group with a 1-year OS rate 100% versus 75% (P = 0.0193, (a)). Similarly, results were observed in the intermediate/high-risk group with a 1-year OS rate estimated to be 30.288% versus 83.571% (P = 0.0453, (b)). In subgroup analyses, none of the other parameters (e.g. age, gender, ECOG, Ann Arbor stage, bone marrow involvement, EBV-DNA copies, LDH, B symptoms or multiple extra-nodal involvement) were significantly associated with survival in both the low-risk and the intermediate/high-risk patient groups.
Figure 2. OS curves according to sPD-L1 levels at diagnosis for patients in low-risk group (a) and median/high-risk group (b).
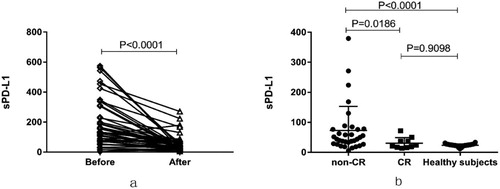
We also evaluated the level of sPD-L1 among 43 patients at diagnosis and after the last cycle of treatment or at the time of disease progression. Regardless of prognosis, sPD-L1 levels measured for patients after treatment (58.36 ± 8.643 pg/ml) decreased significantly compared with their corresponding levels in plasma collected at diagnosis (186.8 ± 24.410 pg/ml, P < 0.0001, (a)). Levels of sPD-L1 returned to normal level after CR (30.65 ± 5.838 pg/ml vs. 23.43 ± 0.496 pg/ml, P = 0.9098), but patients who not achieved CR had significantly higher sPD-L1 levels (72.81 ± 13.96 pg/ml) at end of treatment than that of patients who achieved CR (P = 0.0186, (b)).
Figure 3. (a) sPD-L1 measurement for 43 patients collected at diagnosis and the end of their treatment. (b) sPD-L1 protein measurements at the end of treatment, for patients that achieved (CR) or did not achieve (non-CR) complete remission. Measurements on healthy subjects are also plotted for comparison.
3.3. Plasma levels of sPD-L1 positively correlated with levels in tumor tissue
In order to determine the correlation between plasma concentration of sPD-L1 and PD-L1 expression in tumor tissues, we first assessed the expression of PD-L1 in the tissues from 9 of the 80 PTCL patients using immunohistochemical staining (). Atypical lymphoid cells were observed to have infiltrated the tissues in all samples ((a)) and CD3-positive cells were recognized as lymphoma cells, and the immunohistochemistry also showed that PD-L1-positive cells were preferentially localized at CD3-expressing areas ((b, c)). Finally, we conducted a correlation analysis. As shown in (d), the expression level of PD-L1 in tumor tissues positively correlated with the pretreatment concentration of sPD-L1 (r = 0.9177, P = 0.0013).
Figure 4. Expression of PD-L1 on lymphoma cells in biopsy tissues from PTCL patients. (a–d) Representative immuohistochemical staining (Case 1). (a) H&E staining. (b) Staining for CD3. (c) Staining for PD-L1 (200×). (d) Staining for PD-L1 (400×). (e) Correlation between concentration of plasma soluble PD-L1 (ng/ml) and PD-L1 expression in tumor tissues (IOD) in patients with PTCL. IOD integrate optical density.
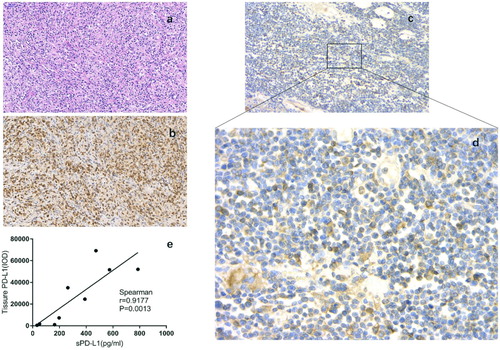
Table 3. PD-L1 expression on tumor cells of 9 PTCL patients.
4. Discussion
We explored the clinical value of sPD-L1 in the plasma of patients with PTCL. Our results showed that the level of sPD-L1 was significantly higher in PTCL patients than healthy subjects. Additionally, patients with sPD-L1 level greater than 176.30 pg/ml at diagnosis had a poorer OS and PFS. High-sPD-L1 levels were the only significant risk factor for OS and PFS in multivariate analysis, which was consistent with several studies that also showed high levels of sPD-L1 to be associated with poor prognosis in some malignancies [Citation7–9]. This finding indicated that sPD-L1 level could be a potential biomarker for prognosis of PTCL patients.
Interestingly, we found that patients with elevated sPD-L1 had a significantly poorer OS than low levelsPD-L1 patients in the low-risk group. Univariate analysis revealed that only sPD-L1 as an independent prognostic factor for OS, suggesting that patients with high-sPD-L1 should be given high dose intensity treatment or combination of alternative therapeutic strategies such as PD-1 axis inhibitors, even if t classified as low-risk. Confirmation of this result and hypothesis requires larger cohort analyses.
The levels of sPD-L1 decreased after treatment regardless of prognosis, but sPD-L1 decreased more significantly in patients with CR, nearly dropping back to normal levels. Our findings corresponded with the results reported by Rossille, D. [Citation7], who found that sPD-L1 was elevated in DLBCL patients at diagnosis and dropped back to normal value after CR. This may be due to an immunological effect of chemotherapy on cells producing sPD-L1 by inhibiting the production of this molecule, and it also reflected that sPD-L1 may be released from tumor cells. These results indicated that sPD-L1 could outline T-cell inhibitory signals and therefore mirror the anti-immune response in PTCL.
Due to our observation that high-sPD-L1 was associated with severity of disease and adverse prognosis, we hypothesized that sPD-L1 might be secreted by tumor cells. As expected, the correlation between sPD-L1 level and PD-L1 expression in tissue lymphoma cells was statistically significant in our study. However, it is still controversial whether PD-L1 expression of lymphoma cells is associated with plasma sPD-L1. Rossille et al found there was no association between tumor PD-L1 expression and sPD-L1 levels in patients with DLBCL [Citation7], Ruf et al. also came to a similar conclusion in renal cell carcinomas [Citation15], indicating that the tumor microenvironment, including nonmalignant cells, may also generate sPD-L1. Additionally, Nagato et al. [Citation10] found that sPD-L1 levels are associated with PD-L1 expression on lymphoma cells and also with tumor-infiltrating macrophages. These results indicate tumor cells may not be the only source of sPD-L1as nonmalignant cells in tumor microenvironment may also release PD-L1 into circulation. We did not explore the expression of PD-L1 on immune cells in the tumor microenvironment in our research. Tumor cells were identified by staining with CD3, which was also expressed on TILs(tumor infiltrating lymphocytes), but our results suggested that tumor cells might be a source of sPD-L1 in plasma from PTCL patients. Elevated levels of sPD-L1 also suggested immune system dysfunction in these patients to some extent.
Although PD-1/PD-L1 axis inhibitors have shown encouraging clinical results, not all patients respond to this treatment. It has been reported that tumor PD-L1 expression was a predictive biomarker for response to anti-PD-1 and anti-PD-L1 therapy [Citation16,Citation17]. Similarly, we found PD-L1 to be highly expressed on tumor cells among a portion of PTCL patients also correlated with plasma sPD-L1 levels. This result suggested PTCL patients with high-level sPD-L1 may benefit from PD-1-blockade therapy.
In conclusion, our data suggested that increased sPD-L1 levels were detectable in plasma of patients with PTCL, and such levels are connected to the clinical aggressiveness of the disease – high-sPD-L1 level is a possible valuable predictor of poor prognosis for PTCL patients. Additionally, we showed that PD-L1 expressed on tumor cells may be one source of sPD-L1 in plasma. It also indicates that the PD-1/PD-L1 pathway may play a crucial role in the escape from the antitumor immune response of PTCL, and PD-1/PD-L1 axis inhibitors could bring benefits to PTCL patients. Further research is required to verify our results.
Disclosure statement
No potential conflict of interest was reported by the authors.
Additional information
Funding
Related Research Data
References
- Vose J, Armitage J, Weisenburger D, et al. International Peripheral T-cell and Natural Killer/T-cell lymphoma study: pathology findings and clinical outcomes. J Clin Oncol. 2008;26:4124–4130. doi: 10.1200/JCO.2008.16.4558
- Shi Y. Current status and progress of lymphoma management in China. Int J Hematol. 2018;107:405–412. doi: 10.1007/s12185-018-2404-8
- Wilhelm M, Smetak M, Reimer P, et al. First-line therapy of peripheral T-cell lymphoma: extension and long-term follow-up of a study investigating the role of autologous stem cell transplantation. Blood Cancer J. 2016;6:e452. doi: 10.1038/bcj.2016.63
- D’Amore F, Relander T, Lauritzsen GF, et al. Up-front autologous stem-cell transplantation in peripheral T-cell lymphoma: NLG-T-01. J Clin Oncol. 2012;30:3093–3099. doi: 10.1200/JCO.2011.40.2719
- Zhang J, Gao J, Li Y, et al. Circulating PD-L1 in NSCLC patients and the correlation between the level of PD-L1 expression and the clinical characteristics. Thorac Cancer. 2015;6:534–538. doi: 10.1111/1759-7714.12247
- Zhang P, Ouyang S, Wang J, et al. Levels of programmed death-1 and programmed death ligand-1 in the peripheral blood of patients with oral squamous cell carcinoma and its clinical implications. Hua Xi Kou Qiang Yi Xue Za Zhi. 2015;33:529–533.
- Rossille D, Gressier M, Damotte D, et al. High level of soluble programmed cell death ligand 1 in blood impacts overall survival in aggressive diffuse large B-cell lymphoma: results from a French multicenter clinical trial. Leukemia. 2014;28:2367–2375. doi: 10.1038/leu.2014.137
- Finkelmeier F, Canli Ö, Tal A, et al. High levels of the soluble programmed death-ligand (sPD-L1) identify hepatocellular carcinoma patients with a poor prognosis. Eur J Cancer. 2016;59:152–159. doi: 10.1016/j.ejca.2016.03.002
- Okuma Y, Hosomi Y, Nakahara Y, et al. High plasma levels of soluble programmed cell death ligand 1 are prognostic for reduced survival in advanced lung cancer. Lung Cancer. 2017;104:1–6. doi: 10.1016/j.lungcan.2016.11.023
- Nagato T, Ohkuri T, Ohara K, et al. Programmed death-ligand 1 and its soluble form are highly expressed in nasal natural killer/T-cell lymphoma: a potential rationale for immunotherapy. Cancer Immunol Immunother. 2017;66(7):877–890. doi: 10.1007/s00262-017-1987-x
- Bi XW, Wang H, Zhang WW, et al. PD-L1 is upregulated by EBV-driven LMP1 through NF-kappaB pathway and correlates with poor prognosis in natural killer/T-cell lymphoma. J Hematol Oncol. 2016;9(1):109. doi: 10.1186/s13045-016-0341-7
- Jaffe ES. The 2008 WHO classification of lymphomas: implications for clinical practice and translational research. Hematology Am Soc Hematol Educ Program. 2009: 523–531. DOI:10.1182/asheducation-2009.1.523
- A predictive model for aggressive non-Hodgkin’s lymphoma. N Engl J Med. 1993;329:987–994. doi: 10.1056/NEJM199309303291402
- Carbone PP, Kaplan HS, Musshoff K, et al. Report of the committee on Hodgkin’s disease staging classification. Cancer Res. 1971;31:1860–1861.
- Ruf M, Moch H, Schraml P. PD-l1 expression is regulated by hypoxia inducible factor in clear cell renal cell carcinoma. Int J Cancer. 2016;139:396–403. doi: 10.1002/ijc.30077
- Grosso J, Horak CE, Inzunza D, et al. Association of tumor PD-L1 expression and immune biomarkers with clinical activity in patients (pts) with advanced solid tumors treated with nivolumab (anti-PD-1; BMS-936558; ONO-4538). J Clin Oncol. 2013;31(15):3016–3016.
- Taube JM, Klein A, Brahmer JR, et al. Association of PD-1, PD-1 ligands, and other Features of the tumor immune microenvironment with response to anti–PD-1 therapy. Clin Cancer Res. 2014;20(19):5064–5074. doi: 10.1158/1078-0432.CCR-13-3271