
ABSTRACT
Objectives
The study aims to understand geneome diversification and complexity that developed in Acute myeloid leukemia (AML).
Methods
Next-generation sequencing (NGS) was used to identify the genetic profiles of 22 genes relevant to hematological malignancy in 204 patients with de novo non-M3 AML.
Results
At time of initial diagnosis, at least one mutation was identified in 80.9% of patients (165/204). The most commonly mutated gene was NPM1 (22.1%), followed by ASXL1 (18.1%), TET2 (18.1%), IDH2 (15.7%), CEBPA (14.7%), FLT3-ITD (13.2%) and DNMT3A (11.8%). Mutations landscape analysis indicated several patterns of co-occurring and mutual exclusive gene mutations. Some correlation was observed between gene mutations and clinicohematological features. Multivariate analysis showed that age >60 years, karyotypes, IDH2 and KIT mutations were the independent unfavorable prognostic factors for OS; NPM1-mut/ FLT3-ITD-wt was independently correlated with prolonged OS; whereas the independent poor risk factors for RFS were karyotypes, high WBC and RUNX1 mutation. According to different genotype demonstrated by multivariate analysis, 163 patients with intermediate-risk cytogenetics were classified into three subgroups: patients with NPM1-mut/ FLT3-ITD-wt or biallelic CEBPA mutation as favorable risk, patients with KIT, IDH2, TP53 or NRAS mutations as unfavorable risk, and the remaining was the intermediate risk. We also obtain information of clonal evolution during leukemia progression by observing five patients who underwent repeat NGS at relapse in our cohort.
Conclusion
NGS techniques is a useful tool for discovering related gene mutations and clonal evolution in AML genomes, leading to novel targeted therapeutic approaches that could improve patients outcomes.
Acute myeloid leukemia (AML) is a hematopoietic malignancy characterized by increased proliferation and poor differentiation of hematopoietic precursors. Development of AML represents a variety of cytogenetic and molecular abnormalities, which are closely associated with clinical and biologic heterogeneity of AML [Citation1–3]. Classic cytogenetic abnormalities, such as translocations t(8;21), t(15;17) and t(16;16), have been widely accepted as the most important diagnostic and prognostic markers in AML and invaluable in risk-stratification and guide the therapy approaches. According to recurrent cytogenetic abnormalities, patients with AML can be divided into favorable, intermediate and unfavorable groups. However, almost half of AML patients lack cytogenetic abnormality (CN-AML) that are categorized as the intermediate prognosis group although this group persists significant clinical heterogeneity [Citation4,Citation5]. To seek a clear differentiated therapy and prognosis for about 60% of AML patients that fall into the intermediate-risk cytogenetic subclass, it is very important to establish refined stratification through a combination of molecular analysis of gene alterations. The role of genetic changes in AML has been emphasized by the European LeukemiaNet (ELN) risk classification system, for example, FLT3-ITD, NPM1 and CEBPA mutations have been shown to have a significant impact on prognostic evaluation and therapeutical strategies for patients with normal karyotypes [Citation4]. Recent studies have demonstrated that patients with NPM1 mutation lacking FLT3- internal tandem duplication (ITD) [Citation6–8] or biallelic CEBPA mutation [Citation9,Citation10] are associated with a favorable prognosis. In addition, a variety of additional molecular markers have drawn our attention and may be available for greater comprehensive molecular risk stratification. The mutation profiling of these novel genes including TET2, RUNX1, DNMT3A, TP53, KIT, NRAS, IDH1, IDH2 and ASXL1 may also be correlated with treatment and prognosis outcomes [Citation11–14]. It has been described that RUNX1, ASXL1 and TP53 mutations have an adverse effect in patients with AML, which have also been added to the recommendations of 2017 ELN genetic risk stratification [Citation15].
The development of next-generation sequencing (NGS) technologies help us identify a greater number of novel and clinically impactful gene mutations and understand the pathophysiological process of AML; which highlights the possibility of translating these insights into improved individual risk assessment and novel therapeutic approaches [Citation16–18]. According to whole-genome and exome sequencing in 260 genes in 200 AML patients, Ley et al. suggested that genetic abnormalities in AML could be organized into nine functional categories. Moreover, a complex interplay of genes was identified among the nine functional categories, indicating the important role of genetic events in AML pathogenesis [Citation19]. Researchers have long recognized the importance of genetic changes for AML, but only recently, with NGS technologies has there been a new recognition that discovering AML-related gene mutations profiles are the key for understanding AML oncogenesis and progression. Previous studies have focused on a class of genes modifying DNA methylation, such as DNMT3A, IDH1, IDH2 and TET2 [Citation20–23]. It is believed that these gene alterations may have prognostic implications and also involved in leukemia pathogenesis. However, the systematic blueprint of recurrent genetic mutations has not been comprehensively established.
In addition, AML are tumors with a fundamental property of genetic and epigenetic heterogeneity. Reflecting the clonal evolution within the disease as a dynamic process driven by constant loss and acquisition of somatic mutations during the course of tumor. More recently research of clonal evolution is emerging as an important new area, contributing to understand geneome diversification and complexity develop in leukemia [Citation24,Citation25].
In this study, we identified the frequently and clinical signicance in 22 genes relevant to hematological malignancy by using NGS in a group of de novo AML. We also report information on clonal evolution by repeating NGS at relapse, therefore, may benefit from personalized therapy.
Materials and methods
Patients
We retrospectively analyzed 204 patients newly diagnosed as de novo non-M3 AML who were performed with targeted NGS of marrow samples from First Affiliated Hospital of Nanjing Medical University. All patients were diagnosed and classified according to the FAB Cooperative Group Criteria [Citation26]. Information on treatment regimen was available in 190 AML cases. A total of 135 patients received standard induction chemotherapy with cytarabine for 7 days and mitoxantrone or anthracyclines (idarubicin or doxorubicin), and 49 patients received induction chemotherapy, which consisted of homoharringtonine 3 mg, D1-7; and cytarabine 100 mg/m2, D1-7. The remaining patients received low dose therapy (cytarabine 10 mg/m2, D1-14; aclarithromycin 10 mg, D1-14 and G-CSF 200 μg/m2, D1-14) and/or supportive care because of underlying comorbidities or decided by the physicians. After achieving complete remission (CR), 166 patients received consolidation chemotherapy with high-dose cytarabine based chemotherapy for two to four courses. This study was approved by the hospital ethics committee.
Cytogenetics
Chromosome analysis was performed according to standard protocols. Bone marrow cells were collected after 24–48 h of unstimulated culture. Mitotic metaphase cells were banded by trypsin-Giemsa technique and the karyotypes were described according to the International System for Human Cytogenetic Nomenclature (ISCN).
Targeted sequencing and analysis
We studied 22 genes recurrently mutated in hematologic malignancies, including NPM1, FLT3, KIT, CEBPA, ASXL1, TET2, IDH1, IDH2, DNMT3A, RUNX1, TP53, EZH2, PHF6, SF3B1, SRSF2, U2AF1, NRAS, CBL, SETBP1, ETV6, ZRSR2 and JAK2 genes. Total DNA of mononuclear cells from marrow samples were extracted using the Qiagen Blood Mini Kit (Valencia, CA, U.S.A.). The library preparation was performed by KAPA Library Amplification Kit, according to the manufacturer’s protocol. Amplicons of the corresponding regions were carried out using PCR reaction with AmpliTaq FastStart kit (Applied Biosystem). The PCR products were purified using AM Pure XP beads. The massively parallel sequencing was performed on an Illumina MiSeq instrument (Illumina, San Diego, CA, U.S.A.). Paired-end sequencing was performed using MiSeq (llumina) with minimal depth of 250x.
Sequence reads were aligned to the human reference genome (HG19, NCBI built 37) using a BWA- MEM algorithm with default parameters. Genome Analysis Toolkit (GATK) was used to identify SNPs and INDELs. Variant calling was done with the Unified Genotyper and Haplotype-Caller tools, variant filtration with the Variant Filtration tool, and variant annotation with Ensembl Variant Effect Predictor (VEP).
Flow cytometry
Immunophenotypic analysis was performed on a FACSCanto flow cytometer (BD Biosciences, San Jose, CA), and data were analyzed with Kaluza version 2.1 (Beckman Coulter) software. Antigen expression were determined with the following markers: CD34, HLA-DR, CD19, CD11b, CD13, CD14, CD4, CD8, CD3, CD2, CD5, CD15, CD7, CD33, CD56, CD64 and CD117. Marker expression was identified on blast cells by FS/SS and CD45/SSC scattergrams. Case was defined as positive for a marker if more than 20% of blast cells expressed this marker.
Statistical analyses
Analysis of associations between different mutations, and between clinical features and gene mutations was performed using χ2 test and Fisher exact test for categorical variables and One-way Anova test for continuous variables. OS was measured from the date of diagnosis to death or alive at last follow-up, and relapse free survival (RFS) was measured from complete response (CR) to death, relapse or alive in CR at last follow-up. Univariable and multivariable Cox proportional hazard regression model was used to identify the prognostic value of gene mutations. The Kaplan-Meier method and log-rank test were applied to analyze OS in intermediate-risk group. All P- values are two- sided, and P < 0.05 was considered as statistically significant. Statistical analyses were performed using SPSS version 17.0 software.
Results
Patient characteristics
A total of 204 patients were analyzed in the study, including 101 females and 103 males with median age 54.4 years (range, 20–86 years). According to 2016 World Health Organization classification criteria, 101 patients were classified as AML with recurrent genetic abnormalities, 18 patients as AML with myelodysplasia-related changes, and 85 patients as AML, not otherwise specified. CBF leukemias, whose cytogenetic subtypes are t(8;21) and inv(16)/t(16;16), accounted for 7.8% (16/204) of all patients. According to Karyotype, 16 patients (7.8%) were classified into favorable, 162 patients (79.4%) were into intermediate, and 26 patients (12.7%) were into adverse risk groups. The clinical information of 204 patients is summarized in .
Table 1. Patient characteristics.
Gene mutations landscape and associations
In our study, we performed sequencing 22 genes originated from the COSMIC cancer database. This panel of 22 genes was demonstrated in association with hematologic malignancies. The diagram of the gene mutation status in patients with de novo AML is depicted in . Of the 204 patients with de novo AML at the time of initial diagnosis, at least one mutation was identified in 80.9% of patients (165/204), indicating a clinical utility of this panel in initial AMLs detection. Among the analyzed genes, seven of 22 genes (NPM1, ASXL1, TET2, IDH2, CEBPA, FLT3-ITD and DNMT3A) had a mutation prevalence of >10%. The most commonly mutated gene was NPM1 (22.1%), followed by ASXL1 (18.1%), TET2 (18.1%), IDH2 (15.7%), CEBPA (14.7%), FLT3-ITD (13.2%) and DNMT3A (11.8%). The frequency of NRAS, IDH1, TP53, C-KIT, RUNX1 was 9.8%, 9.3%, 7.4%, 6.4%, 5.4%, respectively. Other genes had an extremely low frequency among screened patients.
Figure 1 . Diagram of gene mutations in 204 patients with de novo AML. These somatic mutations were classified into several classes according to their different biological function: NPM1; G1: DNA methylation; G2: Activated signling; G3: Transcription factors; G4: Chromatin modifiers; G5: Tumor suppressors; G6: Splicesome. The gene mutation status, cooperating mutations, and cytogenetic risk groups in AML patients at the initial diagnosis are illustrated.
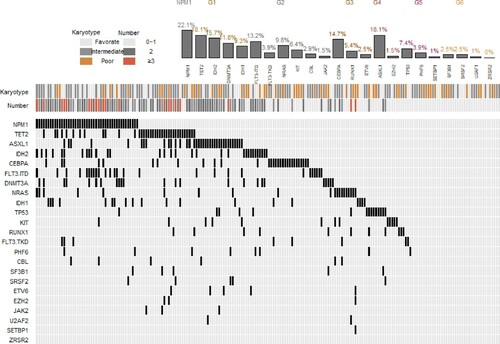
Pervious study suggested greater mutation heterogeneity in intermediate-risk cytogenetic group than favorable risk group or adverse risk cytogenetic group [Citation12,Citation27]. In patients with favorable risk cytogenetic AML, KIT (43.8%) was found to be the most frequent mutation. The most commonly mutated genes in adverse risk cytogenetic group were TP53 (30.8%) and ASXL1 (23.1%), while other genes present with low frequency. With respect to 162 patients in intermediate-risk cytogenetic group, eight mutated genes (NPM1, TET2, IDH2, CEBPA, ASXL1, FLT3-ITD, DNMT3A and IDH1) present with greater than 10%, suggesting great molecular heterogeneity among this group. Among them, the most commonly mutated gene was NPM1 (27.2%), TET2 (19.8%), IDH2 (17.9%), CEBPA (16.7%) and ASXL1 (16.7%).
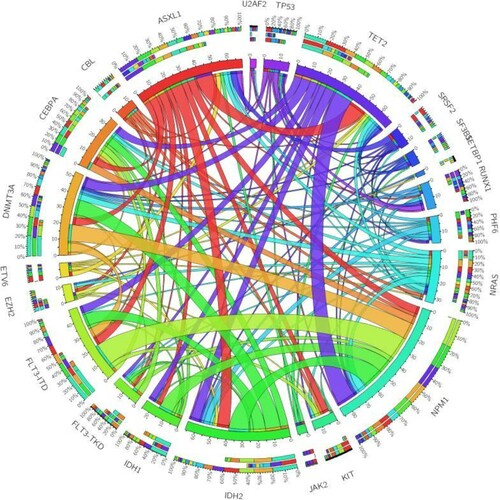
When we analyzed mutations landscape and several patterns of co-occurring mutations, significantly co-occurrence was found between NPM1mutation and IDH2, FLT3-ITD, DNMT3A and TET2 mutation; and between ASXL1 mutation and TET2 mutation. We also noted significant pairwise associations of FLT3-ITD and DNMT3A with IDH2 mutations. In contrast, mutual exclusivity of gene mutations was observed between TP53 and FLT3-ITD, RUNX1and NPM1, RUNX1and CEBPA, and KIT and IDH2. We also found a high exclusivity between IDH1 and NRAS. The pairwise cooperativeness between gene mutations is illustrated in .
Figure 2 . Pairwise cooperativeness between gene mutations in de novo AML patients. The length of the arc depicts the relative frequency of the first gene mutation, and the width of the ribbon depicts the relative frequencies of pairwise co-occurrences.
Association of gene mutations with clinical characteristics
The potential correlation was observed between gene mutations (NPM1, ASXL1, TET2, IDH2, CEBPA, FLT3-ITD and DNMT3A) and clinicohematological features, including age, sex, white blood cell counts, percentage of marrow blasts, and phenotypic markers (). TET2 mutation was seen more often in older patients (31.0 vs 9.2%, P < 0.001). FLT3-ITD mutation was associated with male patients (18.4 vs 7.9%, P = 0.027), higher white blood cell counts (47.18 × 10⁹/L vs 9.79 × 10⁹/L, P = 0.042) and percentage of marrow blasts(82.40 vs 62.80%, P = 0.001). Higher BM blast infiltration was found in patients with mutations of NPM1 (75.50 vs 62.40%, P = 0.003) and IDH2(69.90 vs 64.80%, P = 0.035). AMLs with NPM1 and(or) FLT3-ITD mutations lack expression of both CD34 (P < 0.001; P = 0.009) and HLA-DR (P < 0.001; P < 0.001); AMLs with CEBPA mutation were associated with greater expression of CD34 (P = 0.033). No correlation of ASXL1 and DNMT3A mutations with any clinical characteristics was found among the screened patients.
Table 2. Association of gene mutations with clinical characteristics.
Survival analysis
We assessed the impact of age (<60 vs ≥ 60 years), karyotype risk group, WBC, NPM1+/FLT3-ITD−, CEBPAdouble-mutation, TET2, ASXL1, KIT, IDH1, IDH2, DNMT3A, RUNX1, TP53, PHF6 and NRAS on OS and relapse free survival (RFS) (). Gene mutations with less prevalence were excluded from outcome Analysis. In univariate analysis, NPM1+/FLT3-ITD− and biallelic CEBPA mutations were associated with favorable OS (HR = 0.283, P = 0.033, HR = 0.143, P = 0.043, respectively). In contrast, older patients had significantly inferior OS and RFS than those aged below 60 years (HR = 2.836, P < 0.001, HR = 2.170, P = 0.008, respectively). The result showed that karyotype risk groups have significant influence on OS or RFS (OS, HR = 1.898, P = 0.015, RFS, HR = 1.928, P = 0.033). In addition, RUNX1, TP53 and ASXL1 mutations were associated with a significantly worse OS (HR = 2.571, P = 0.019, HR = 2.143, P = 0.035, HR = 1.721, P = 0.041, respectively). RUNX1 mutation was associated with a poorer RFS (HR = 3.943, P = 0.004). In the multivariate analysis, the independent unfavorable prognostic factors for OS were age >60 years (P = 0.024), karyotypes (P = 0.032), mutations in IDH2 (P = 0.015) and KIT (P = 0.039). NPM1-mut/ FLT3-ITD-wt was independently correlated with prolonged OS (P = 0.035), whereas the independent poor risk factors for RFS were karyotypes (P = 0.014), high WBC (P = 0.008) and RUNX1 mutation (P = 0.026).
Table 3. Cox regression hazard analysis on the OS and RFS in the entire cohort.
The impact of mutation status on OS in intermediate-risk group
Among 163 patients in intermediate-risk cytogenetic group, multivariate analysis revealed that NPM1-mut/FLT3-ITD-wt and biallelic CEBPA mutations had a trend of favorable OS (HR < 0.5 and P < 0.15). KIT mutation was associated with short OS (HR = 3.442, P = 0.033), and IDH2, TP53 and NRAS mutations had a trend of unfavorable OS (all HR > 1.5).
According to different genotype, 163 patients with intermediate-risk cytogenetics were classified into three subgroups: patients with NPM1-mut/ FLT3-ITD-wt or biallelic CEBPA mutation as favorable genotype, patients with KIT, IDH2, TP53 or NRAS mutations as unfavorable genotype, and the remaining was the intermediate genotype. Survival analysis showed that AMLs in intermediate-risk group could be divided into three subgroups based on genotype ((A), P < 0.001). In addition, 33 patients with favorable genotype expressed favorable OS than patients without favorable genotype in intermediate-risk cytogenetic group ((B), P = 0.012). For the 42 patients in unfavorable subgroup, the OS was poor than patients without unfavorable genotype in intermediate-risk cytogenetic group ((C), P < 0.001). ().
Figure 3 . OS estimated by Kaplan–Meier analysis according to favorable, intermediate or unfavorable genotype. A: Three subgroups based on genotype in intermediate risk cytogenetic group. B: Favorable genotype in patients with intermediate risk cytogenetics. C: Unfavorable genotype in patients with intermediate risk cytogenetics. D: Integrative stratification of cytogenetics and genotype in the entire cohort.
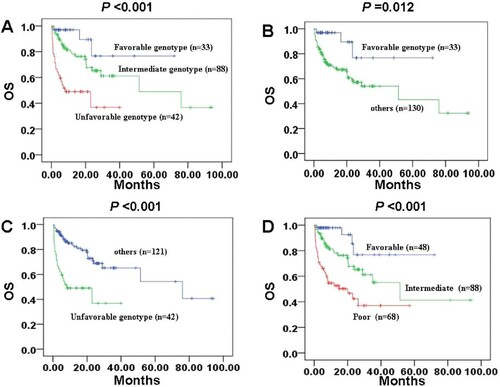
Table 4. Multivariable analysis of the intermediate risk cytogenetic group.
Integrative stratification of cytogenetics and gene mutations
Among 15 patients with favorable risk cytogenetics, 6 patients had KIT mutation, but it presented an insignificantly poor prognostic value (P = 0.317). According to favorable, intermediate or unfavorable genotype((D), P < 0.001), 48 patients were considered as favorable risk, including patients with favorable risk cytogenetics and patients with favorable genotype (NPM1-mut/FLT3-ITD-wt or biallelic CEBPA mutation) in intermediate-risk cytogenetic group. A total of 68 patients were considered as poor risk, including patients with unfavorable risk cytogenetics and patients with unfavorable genotype (KIT, IDH2, TP53 or NRAS mutations) in intermediate-risk cytogenetic group. In addition, the remaining 88 cases were considered as intermediate risk. Of note, a prognostic classification was developed by integrative stratification of cytogenetics and gene mutations ().
Table 5. Integrative stratification of cytogenetics and gene mutations.
Variant allelic frequencies between different genetic groups
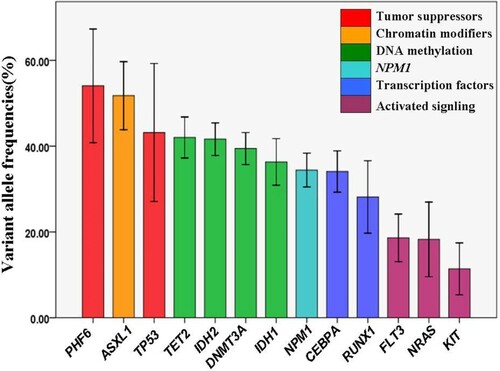
We examined variant allelic frequencies (VAFs) of 13 genes that mutated in ≥8 patients. The median and mean VAFs of mutated gene were 35.4% and 38.3%, respectively. These somatic mutations can be classified into several classes according to their different biological function, including tumor suppressors, chromatin modifiers, DNA methylation, NPM1, transcription factors and activated signaling. As shown in , only PHF6 and ASXL1 had a mean VAF slightly greater than 50%. TP53 mutation and DNA methylation related mutations involving TET2, IDH2, DNMT3A and IDH1 mutation had a similar VAF about 40%, which was consistent with the overall mutations VAF in our study. Moreover, NPM1 and transcription factors (CEBPA and RUNX1) had a VAF about 30%. It is of note that, mutations in FLT3, NRAS and KIT that involved in signaling pathways were present with the lowest mean VAF, indicating that they are later events and exist only in subpopulation of leukemia stem cells during the course of AML.
Figure 4 . Analysis of variant allele frequencies (VAFs) of mutated gene. The histogram shows the mean VAF observed in the entire cohort. Only mutations found in ≥8 patients were included. The histogram is colored according to different biological function of mutations.
Clonal evolution of AML at relapse
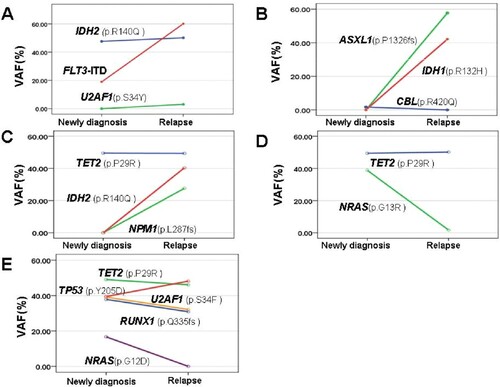
To study clonal evolution patterns during leukemia progression, we observe five patients who underwent repeat NGS at relapse in our cohort. Information of clonal evolution from all five patients was shown in . These data indicate several interesting evolution patterns during AML progression. First, in two patients, although the same gene mutations were detected both at diagnosis and relapse, some genes were present at changing VAFs from diagnosis to relapse. In patient D and E, we observed significant reduction of NRAS mutations (G13R and G12D), whereas other mutations remain dominant with similar VAFs at the time of relapse. These results suggest clones with specific gene abnormalities are likely selected by therapy. Second, in 3 of the 5 patients, new clones detected at the time of relapse were not present at diagnosis. For example, for patient A, there was emergence of a subclone with U2AF1 S34Y (VAF 3.08%) at relapse, which may exist in all blasts. Patient B acquired actionable ASXL1 P1326fs (VAF 57.73%) and IDH1 R132H (VAF 42.11%) mutations, and patient C acquired actionable IDH2 R140Q (VAF40.36%) and NPM1 L287fs (VAF 27.61%) mutations, indicating ongoing clonal selection. Finally, in three patients, new dominant clones have occurred from diagnosis to relapse. At diagnosis, in patient A, FLT3-ITD was present at VAF18.99%, whereas it had become a dominant clone (VAF60.11%) at relapse. In patient E, there was a reduction of four clonal heterozygous mutations, however, TP53 Y205D clone increased and became the most dominant clone. Taken together, this information summarized from five patients provides evidence for genomic complexity and clonal evolution from diagnosis to relapse.
Figure 5 . Clonal evolution patterns of AML at the time of relapse. Five patients who underwent repeat NGS at relapse in our cohort were observed, and VAF of mutated genes for each patient at diagnosis and relapse are shown.
Discussion
It is widely accepted that genetic diversity contributes to AML with great heterogeneity, so exploring mutational profiling is an important step to approach the truth of AML biological and clinical features. Fortunately, NGS techniques offering a powerful tool for discovering related gene mutations in AML genomes, leading to novel targeted therapeutic approaches that could improve patients outcomes. Recent advances in gene mutation studies broaden our eyes to view AML from a more comprehensive and deeply perspective, not only the simple morphology, but also the cytogenetic and genetic aberrations [Citation5,Citation7,Citation12]. Nowadays, more and more genes are found and classified in AML field [Citation28], simultaneously examination of gene mutations in AML has been a custom program around the world.
In our study, we examined 22 frequently mutated genes in 204 de novo non-M3 AML samples at diagnosis using an NGS panel currently in routinely clinical examination at our department. At least one mutation was identified in 81% of patients, indicating a clinical practicality of our panel in initial AMLs detection. Consistent with previous studies [Citation29,Citation30], seven genes (NPM1, ASXL1, TET2, IDH2, CEBPA, FLT3-ITD and DNMT3A) had a mutation prevalence of >10%, but NPM1 mutations were more frequent, followed by ASXL1, TET2, IDH2, CEBPA, FLT3-ITD and DNMT3A. Kihara et al. [Citation11] reported that mutations of FLT3, NPM1, CEBPA, DNMT3A and KIT gene had high mutation frequency in AML patients in Japan. Molecular mutation of NPM1 gene is present with high mutation rates in AMLs, ranging from24 to 29% in adults, 3–11% in children, especially in patients with a normal karyotype [Citation16,Citation19,Citation31]. However, the frequency of NPM1 mutation seemed to be slightly lower in our cohort. This finding may be due to its partly younger patients selection. Clinically, patients with NPM1 mutation had higher BM blast infiltration and were common in intermediate karyotype risk group. Previous studies identified that patients in favorable or adverse risk groups were present with lower kinds of gene mutations compared to those in intermediate-risk group [Citation11]. Some studies reported KIT mutation were the most frequently mutated genes in CBF-AML, in both adults (16–46%) and children (19–44%) [Citation32,Citation33]. We detected KIT mutation at 42% frequency. For patients in adverse risk cytogenetic group, the most commonly mutated genes were TP53 (30.8%) and ASXL1 (23.1%), while other genes present with low frequency. In terms of intermediate-risk cytogenetic group, eight mutated genes (NPM1, TET2, IDH2, CEBPA, ASXL1, FLT3-ITD, DNMT3A and IDH1) were present with greater than 10%, suggesting great molecular heterogeneity among this group.
Our study identified statistically significant association of mutations occurring in more than 5% of cases. In agreement with previous reports, DNMT3A and FLT3-ITD mutations were recognized as being frequently overlapped with NPM1 mutation [Citation34]. A series of associations of co-occurring mutations were also identified, including frequent co-mutation of NPM1 with IDH2, NPM1 with TET2, TET2 with ASXL1, and IDH2 with FLT3-ITD and DNMT3A. Association of co-occurring mutations suggests functional synergism among different oncogenic pathways in AML pathogenesis. In contrast, mutual exclusivity was found for mutations in NPM1 and the transcription factor genes. Our study indicated that mutations that were common in NPM1 and CEBPA were mutually exclusive of RUNX1, thereby supporting the biological evidence that the mutations are early events during leukemogenesis [Citation19]. Some correlation was also observed between gene mutations and clinicohematological features. Consistent with other studies, TET2 mutation was seen more often in older patients, AMLs with NPM1 mutation lack expression of both CD34 and HLA-DR, and AMLs with CEBPA mutation were associated with greater expression of CD34 [Citation35,Citation36]. However, we also found AMLs with FLT3-ITD mutation were associated with fewer CD34 and HLA-DR positive events, which was conflicts with another study [Citation37]. Further studies with more patients are needed to verify such correlaton.
It is important to estimate the risk of death and relapse both from the viewpoint of physicians as well as patients. Recently, mutations in FLT3-ITD, NPM1, CEBPA, TP53, ASXL1 and RUNX1 have been revealed to have prognostic value, and they have been incorporated into the 2017 ELN risk stratification [Citation15]. The well-established classification and prognostic stratification for AML were cytogenetics combined with FLT3-ITD, NPM1 and CEBPA. It has been described that patients with biallelic CEBPA mutations or a NPM1 mutation but no FLT3-ITD (or FLT3-ITD with a low allelic ratio) convey a favorable prognosis [Citation9,Citation38,Citation39], whereas RUNX1, ASXL1 and TP53 mutations predict for a poor outcome [Citation28,Citation40]. Till now, for other genes, including IDH1, IDH2, TET2 or DNMT3A, etc., there was no enough evidence to warrant their implementation in the ELN stratification system. In our study, univariate analysis revealed that NPM1-mut/ FLT3-ITD-wt and biallelic CEBPA mutations were associated with favorable OS, nevertheless, mutations in RUNX1, TP53 and ASXL1 were associated with a significantly worse OS. In addition, RUNX1 mutation was significantly correlated with a poorer RFS both in univariate analysis and multivariate analysis. Traditionally, karyotype is thought to be the most important prognostic factor in AML patients. A study from Tsai et al showed that older patients had a higher incidence of adverse cytogenetics, but lower incidence of the favorable karyotype as the core binding factor alternations [Citation41]. In agreement with their finding, age and karyotype risk have significant influence both on OS and RFS in univariate analysis. Multivariate analysis indicated that age >60 years and karyotype risk were independent predictor of poor OS, while karyotype risk and high WBC were the independent poor risk factors for RFS in AML. Of note, a significantly unfavorable impact of IDH2 and KIT mutations on OS was only found in multivariable analysis, whereas IDH1 mutation did not affect disease outcome in the entire study cohort. Usually, IDH1/2 mutations are correlated with an unfavorable clinical outcome, although the prognostic impact is assessed by complex interplay of genetic aberrations [Citation42]. According to a series of studies, the prognostic significance of IDH1/2 mutations is controversial. Patel et al. [Citation12] reported that IDH mutations were associated with favorable prognosis in patients that were FLT3-ITD-negative and NPM1-mutation-positive. Some studies reported that IDH1 mutation was an unfavorable prognostic factor or had no effect on OS [Citation43,Citation44]. Several studies and reviews have reported favorable prognosis of patients with IDH2 mutation [Citation23]. However, a study performed by Green et al indicated that IDH2R172 mutation was significantly associated with a shorter OS than IDH2R140 mutation [Citation45]. There have been reports of high mutation rates of KIT mutation in patients with CBF-AML, which conveys an adverse prognosis [Citation46]. For intermediate-risk group, we also found KIT mutation was associated with short OS. Mutation of other genes, including IDH2, NRAS, TP53, TET2 and DNMT3A had a nonsignificant trend of unfavorable OS, although some research reported an unfavorable impact of TET2 and DNMT3A on clinical outcome [Citation21,Citation22]. According to the above results, we have developed a risk classification system for AMLs using seven mutations and cytogenetics. AMLs in intermediate-risk cytogenetic group could be divided into three subgroups based on genotype, in which 33 patients with favorable genotype expressed favorable prognosis, whereas 42 patients with unfavorable genotype showed poor prognosis. Further work is required to determine their definite influence on prognosis.
It is well known that genetic and epigenetic evolution and clonal selection were complex events involved in the course of AML progression [Citation24,Citation25]. According to allelic ratio at diagnosis, DNA methylation-related mutations including TET2, IDH2, DNMT3A and IDH1 mutations had a similar VAF of about 40%, suggesting their dominant epigenetic alleles during clonal evolution. In agreement with previous reports, somatic mutations in epigenetic modifiers are commonly occur early, leading to founding clone in AML. However, mutations in FLT3, NRAS and KIT that involved in signaling pathways were present with the lowest VAF, consistent with the notion that these mutations are acquired relatively later in AML transformation [Citation47,Citation48]. To explore clonal patterns underlying relapse, we also analyzed five patients who underwent repeat NGS at relapse in our cohort. Interesting, although mutations in NRAS and CBL genes play established roles as drivers in leukemogenesis, they have a significant reduction of VAF or even are absent at relapse if initially present with subclone. This observation suggests that these late events may not be sufficient to drive leukemogenesis, but these mutations could potentially be the therapeutic targets considering clonal selection. The acquisition of additional clones which appeared at relapse provides the possibility of these mutations in minimal residual disease monitoring by NGS techniques. Nowadays, more and more studies support clonal selection although it is difficult to demonstrate that the emergence of new mutations results from subclonal selection or minor mutations present below the reporting threshold at initial diagnosis [Citation49]. Some genetic mutations with role as initiators in early blood cell transformation, such as TET2, IDH1/2 and DNMT3A, may not be suitable as biomarkers to detect minimal residual disease.
In summary, we showed complex mutation profiling of several genes relevant to hematological malignancy and found that some genetic alternations may be prognostic markers in AML and invaluable in risk-stratification and guide the therapy approaches. Our results also further provided evidence of clonal architecture and highlight the genomic complexity and diversification in leukemogenesis and transformation. Whereas our study have some limitations such as heterogeneity and a relatively small number of samples. A more comprehensive research on the mutation profiling of somatic mutations involved in AML pathogenesis is critical for improved risk stratification and better therapy outcome.
Author contributions
(I) Conception and design: Yujie Wu, Sixuan Qian; (II) Administrative support: Yujie Wu,Sixuan Qian; (III) Provision of study materials: Xiao Chen, Han Zhu; (IV) Collection and assembly of data: Chun Qiao, Sishu Zhao, Lu Liu, (V) Data analysis and interpretation: Xiao Chen, Han Zhu, Yan Wang, Huimin Jin; (VI) Manuscript writing: All authors; (VII) Final approval of manuscript: All authors.
Ethical statement
This study was approved by the local ethics committee of Jiangsu Province Hospital (approval number 2018-SRFA-087); written and informed consent was obtained from all patients.
Acknowledgements
This study was supported by the National Natural Science Foundation of China (81370656; 81870119; 81570134), ‘Liu Da Ren Cai Gao Feng’ of Jiangsu Province (number 2014-WSN-009).
Disclosure statement
No potential conflict of interest was reported by the author(s).
Additional information
Funding
References
- Byrd JC, Mrozek K, Dodge RK, et al. Pretreatment cytogenetic abnormalities are predictive of induction success, cumulative incidence of relapse, and overall survival in adult patients with de novo acute myeloid leukemia: results from Cancer and Leukemia Group B (CALGB 8461). Blood. 2002;100(13):4325–4336.
- Dohner H, Weisdorf DJ, Bloomfield CD. Acute myeloid leukemia. N Engl J Med. 2015;373(12):1136–1152.
- Dohner H, Gaidzik VI. Impact of genetic features on treatment decisions in AML. Hematology Am Soc Hematol Educ Program. 2011;2011:36–42.
- Dohner H, Estey EH, Amadori S, et al. Diagnosis and management of acute myeloid leukemia in adults: recommendations from an international expert panel, on behalf of the European LeukemiaNet. Blood. 2010;115(3):453–474.
- Grimwade D, Hills RK, Moorman AV, et al. Refinement of cytogenetic classification in acute myeloid leukemia: determination of prognostic significance of rare recurring chromosomal abnormalities among 5876 younger adult patients treated in the United Kingdom Medical Research Council trials. Blood. 2010;116(3):354–365.
- Dohner K, Schlenk RF, Habdank M, et al. Mutant nucleophosmin (NPM1) predicts favorable prognosis in younger adults with acute myeloid leukemia and normal cytogenetics: interaction with other gene mutations. Blood. 2005;106(12):3740–3746.
- Schlenk RF, Dohner K, Krauter J, et al. Mutations and treatment outcome in cytogenetically normal acute myeloid leukemia. N Engl J Med. 2008;358(18):1909–1918.
- Stirewalt DL, Radich JP. The role of FLT3 in haematopoietic malignancies. Nat Rev Cancer. 2003;3(9):650–665.
- Szankasi P, Ho AK, Bahler DW, et al. Combined testing for CCAAT/enhancer-binding protein alpha (CEBPA) mutations and promoter methylation in acute myeloid leukemia demonstrates shared phenotypic features. Leuk Res. 2011;35(2):200–207.
- Pabst T, Mueller BU, Zhang P, et al. Dominant-negative mutations of CEBPA, encoding CCAAT/enhancer binding protein-alpha (C/EBPalpha), in acute myeloid leukemia. Nat Genet. 2001;27(3):263–270.
- Kihara R, Nagata Y, Kiyoi H, et al. Comprehensive analysis of genetic alterations and their prognostic impacts in adult acute myeloid leukemia patients. Leukemia. 2014;28(8):1586–1595.
- Patel JP, Gonen M, Figueroa ME, et al. Prognostic relevance of integrated genetic profiling in acute myeloid leukemia. N Engl J Med. 2012;366(12):1079–1089.
- Hou HA, Lin CC, Chou WC, et al. Integration of cytogenetic and molecular alterations in risk stratification of 318 patients with de novo non-M3 acute myeloid leukemia. Leukemia. 2014;28(1):50–58.
- Ofran Y, Rowe JM. Genetic profiling in acute myeloid leukaemia – where are we and what is its role in patient management. Br J Haematol. 2013;160(3):303–320.
- Dohner H, Estey E, Grimwade D, et al. Diagnosis and management of AML in adults: 2017 ELN recommendations from an international expert panel. Blood. 2017;129(4):424–447.
- Mardis ER, Ding L, Dooling DJ, et al. Recurring mutations found by sequencing an acute myeloid leukemia genome. N Engl J Med. 2009;361(11):1058–1066.
- Gagan J, Van Allen EM. Next-generation sequencing to guide cancer therapy. Genome Med. 2015;7(1):80.
- Ilyas AM, Ahmad S, Faheem M, et al. Next generation sequencing of acute myeloid leukemia: influencing prognosis. BMC Genomics. 2015;16(Suppl 1):S5.
- Ley TJ, Miller C, Ding L, et al. Genomic and epigenomic landscapes of adult de novo acute myeloid leukemia. N Engl J Med. 2013;368(22):2059–2074.
- Ryotokuji T, Yamaguchi H, Ueki T, et al. Clinical characteristics and prognosis of acute myeloid leukemia associated with DNA-methylation regulatory gene mutations. Haematologica. 2016;101(9):1074–1081.
- Weissmann S, Alpermann T, Grossmann V, et al. Landscape of TET2 mutations in acute myeloid leukemia. Leukemia. 2012;26(5):934–942.
- Ley TJ, Ding L, Walter MJ, et al. DNMT3A mutations in acute myeloid leukemia. N Engl J Med. 2010;363(25):2424–2433.
- Xu Q, Li Y, Lv N, et al. Correlation between isocitrate dehydrogenase gene aberrations and prognosis of patients with acute myeloid leukemia: a systematic review and meta-analysis. Clin Cancer Res. 2017;23(15):4511–4522.
- Li S, Garrett-Bakelman FE, Chung SS, et al. Distinct Evolution and Dynamics of Epigenetic and Genetic Heterogeneity in Acute Myeloid Leukemia. Nat Med. 2016;22(7):792–799.
- Li S, Mason CE, Melnick A. Genetic and epigenetic heterogeneity in acute myeloid leukemia. Curr Opin Genet Dev. 2016;36:100–106.
- Bennett JM, Catovsky D, Daniel MT, et al. Proposed revised criteria for the classification of acute myeloid leukemia. A report of the French-American-British Cooperative Group. Ann Intern Med. 1985;103(4):620–625.
- Mrozek K, Marcucci G, Paschka P, et al. Clinical relevance of mutations and gene-expression changes in adult acute myeloid leukemia with normal cytogenetics: are we ready for a prognostically prioritized molecular classification? Blood. 2007;109(2):431–448.
- Papaemmanuil E, Gerstung M, Bullinger L, et al. Genomic classification and prognosis in acute myeloid leukemia. N Engl J Med. 2016;374(23):2209–2221.
- Rose D, Haferlach T, Schnittger S, et al. Subtype-specific patterns of molecular mutations in acute myeloid leukemia. Leukemia. 2017;31(1):11–17.
- Lin PH, Li HY, Fan SC, et al. A targeted next-generation sequencing in the molecular risk stratification of adult acute myeloid leukemia: implications for clinical practice. Cancer Med. 2017;6(2):349–360.
- Grossmann V, Schnittger S, Kohlmann A, et al. A novel hierarchical prognostic model of AML solely based on molecular mutations. Blood. 2012;120(15):2963–2972.
- Jones D, Yao H, Romans A, et al. Modeling interactions between leukemia-specific chromosomal changes, somatic mutations, and gene expression patterns during progression of core-binding factor leukemias. Genes Chromosomes Cancer. 2010;49(2):182–191.
- Pollard JA, Alonzo TA, Gerbing RB, et al. Prevalence and prognostic significance of KIT mutations in pediatric patients with core binding factor AML enrolled on serial pediatric cooperative trials for de novo AML. Blood. 2010;115(12):2372–2379.
- Shen Y, Zhu YM, Fan X, et al. Gene mutation patterns and their prognostic impact in a cohort of 1185 patients with acute myeloid leukemia. Blood. 2011;118(20):5593–5603.
- Chou WC, Chou SC, Liu CY, et al. TET2 mutation is an unfavorable prognostic factor in acute myeloid leukemia patients with intermediate-risk cytogenetics. Blood. 2011;118:3803–3810.
- Wang B, Liu Y, Hou G, et al. Mutational spectrum and risk stratification of intermediate-risk acute myeloid leukemia patients based on next-generation sequencing. Oncotarget. 2016;7:32065–32078.
- Dalal BI, Mansoor S, Manna M, et al. Detection of CD34, TdT, CD56, CD2, CD4, and CD14 by flow cytometry is associated with NPM1 and FLT3 mutation status in cytogenetically normal acute myeloid leukemia. Clin Lymphoma Myeloma Leuk. 2012;12:274–279.
- Pratcorona M, Brunet S, Nomdedeu J, et al. Favorable outcome of patients with acute myeloid leukemia harboring a low-allelic burden FLT3-ITD mutation and concomitant NPM1 mutation: relevance to post-remission therapy. Blood. 2013;121(14):2734–2738.
- Schlenk RF, Kayser S, Bullinger L, et al. Differential impact of allelic ratio and insertion site in FLT3-ITD-positive AML with respect to allogeneic transplantation. Blood. 2014;124(23):3441–3449.
- Metzeler KH, Herold T. Spectrum and Prognostic Relevance of Driver Gene Mutations in Acute Myeloid Leukemia. Blood. 2016;128(5):686–698.
- Tsai CH, Hou HA, Tang JL, et al. Genetic alterations and their clinical implications in older patients with acute myeloid leukemia. Leukemia. 2016;30(7):1485–1492.
- Im AP, Sehgal AR, Carroll MP, et al. DNMT3A and IDH mutations in acute myeloid leukemia and other myeloid malignancies: associations with prognosis and potential treatment strategies. Leukemia. 2014;28(9):1774–1783.
- Paschka P, Schlenk RF, Gaidzik VI, et al. IDH1 and IDH2 mutations are frequent genetic alterations in acute myeloid leukemia and confer adverse prognosis in cytogenetically normal acute myeloid leukemia with NPM1 mutation without FLT3 internal tandem duplication. J Clin Oncol. 2010;28(22):3636–3643.
- Chotirat S, Thongnoppakhun W, Promsuwicha O, et al. Molecular alterations of isocitrate dehydrogenase 1 and 2 (IDH1 and IDH2) metabolic genes and additional genetic mutations in newly diagnosed acute myeloid leukemia patients. J Hematol Oncol. 2012;5:5.
- Green CL, Evans CM, Zhao L, et al. The prognostic significance of IDH2 mutations in AML depends on the location of the mutation. Blood. 2011;118(2):409–412.
- Duployez N, Marceau-Renaut A, Boissel N, et al. Comprehensive mutational profiling of core binding factor acute myeloid leukemia. Blood. 2016;127(20):2451–2459.
- Corces-Zimmerman MR, Hong WJ, Weissman IL, et al. Preleukemic mutations in human acute myeloid leukemia affect epigenetic regulators and persist in remission. Proc Natl Acad Sci U S A. 2014;111(7):2548–2553.
- Brower V. Deep sequencing of acute myeloid leukemia reveals driver mutations and new targets. J Natl Cancer Inst. 2016;108(2):djw018.
- Quek L, Ferguson P, Metzner M, et al. Mutational analysis of disease relapse in patients allografted for acute myeloid leukemia. Blood Adv. 2016;1(3):193–204.