
ABSTRACT
Objectives: Multipotent mesenchymal stromal cells (MSC) play a pivotal role in the bone marrow (BM) niche. Stanniocalcin 1 (STC1) secreted by MSC has been demonstrated to promote the survival of neoplastic cells and was suggested a marker for minimal residual disease of acute myeloid leukemia (AML). Therefore, we evaluated the expression of STC1 in MSC from AML patients (MSCAML) compared to MSC from healthy donors (MSCHD).
Methods: Liquid culture assays of MSCAML and MSCHD were performed to compare expansion capacity. Gene expression profiles of MSCAML vs. MSCHD were established. Secretion of STC1 was tested by ELISA in MSCAML vs. MSCHD and expression of STC1 in AML- vs. HD-BM by immunohistochemistry. In addition, co-cultures of AML cells on MSC were initiated and ultrastructural intercellular communication patterns were investigated. Finally, the effect of blocking STC1 on AML cells was evaluated.
Results: MSCAML showed significant decreased expansion capacity compared to MSCHD. Gene analysis revealed marked overexpression of STC1 in MSCAML. ELISA and immunohistochemical findings confirmed this observation. Electron microscopy analysis showed reciprocal stimulation between AML cells and MSC. Blockade of STC1 did not significantly affect AML cell proliferation and apoptosis.
Discussion: Characteristics of MSC differ depending on whether they originate from AML patients or from HD. STC1 was mostly overexpressed in MSCAML compared to MSCHD. In vitro blockade of STC1, however, was not associated with AML cell proliferation and apoptosis.
Conclusion: Differences in expression levels of glycoproteins from MSCAML compared to MSCHD not necessarily assume that these molecules are niche-relevant in leukemic disease.
Introduction
Mesenchymal stromal cells (MSC) were recognized as crucial regulatory constituents of hematopoietic stem cells (HSC) inside the bone marrow (BM) microenvironment as they are situated perivascular next to HSC and express HSC maintenance genes at an elevated level [Citation1]. Analogical mechanisms were reported regarding the interplay between MSC and AML cells, thus impairing the cytotoxic actions of chemotherapy regimens [Citation2–6].
The tumor-stroma interaction is assumed to be mainly regulated by molecules secreted either by stromal cells or neoplastic cells. Stanniocalcin 1 (STC1) secreted by MSC has been demonstrated to augment the Warburg effect and promote the survival of lung cancer cells by making them resistant to reactive oxygen species (ROS) through upregulation of uncoupling protein 2 (UCP2) [Citation7]. UCP2 expression was also upregulated in a MSC-AML co-culture model, with likewise increased Warburg effect and enhanced proliferation of AML cells [Citation8]. Moreover, STC1 was suggested a marker for minimal residual disease (MRD) of AML and for an early diagnosis of relapse [Citation9]. Therefore, blockade of STC1 could supposedly diminish AML cell proliferation and enhance apoptosis.
In the present study we investigated the differences between MSC from AML patients (MSCAML) and MSC from healthy donors (MSCHD) by measuring expansion capacity and performing gene expression profiles. Secretion of STC1, the most overexpressed gene in MSCAML vs. MSCHD, was further analyzed by ELISA and expression of STC1 within the BM of AML patients vs. healthy donors (HD) was confirmed by immunohistochemistry. Moreover, we designed co-culture experiments using human MSC as a feeder layer to evaluate the effect of STC1 blockade on proliferation and apoptosis of AML cells. For this, a neutralizing mouse anti-human STC1 antibody was used as inhibiting agent.
Material and methods
Patient characteristics
BM aspirates were received from the iliac crest of 20 AML patients (age 59 ± 17) and 33 HD (age 56 ± 18) after written informed consent. The biopsies in the HD group were obtained from patients who presented to the University Hospital of Regensburg with suspicion of any kind of BM disorder but whose histopathological results did not reveal any pathologic findings. The procedures are in consensus with the latest version of the Helsinki Declaration and were authorized by the local Ethics Committee of Human Experimentation, University Regensburg. AML patient and disease characteristics are summarized in .
Table 1. Patients’ characteristics.
Mesenchymal stromal cells
Expansion of human MSC was performed as described earlier [Citation10]. In brief, human BM aspirate from HD and AML patients (ethical approval 111010303 and 051097, Ethical Committee of the University Hospital of Regensburg) was diluted with either DMEM supplemented with FBS (PAA Laboratories GmbH, Pasching, Austria) and gentamycin (Life Technologies, Darmstadt, Germany) or with ‘StemMACS MSC Expansion Media, human’ supplemented with ‘CytoMix – MSC, human’ (both: Miltenyi Biotec, Bergisch Gladbach, Germany) and plated in 100 mm cell culture dishes (BD Falcon, Heidelberg, Germany) for primary expansion. Medium was changed twice weekly. When confluence was (almost) achieved, MSC were trypsinized (Trypsin-EDTA from Sigma-Aldrich, Schnelldorf, Germany) and further expanded (secondary expansion) in 75 cm2 cell culture flasks (Corning Costar, Bodenheim, Germany). After two–four weeks (80% confluence), MSC were harvested and phenotypically and functionally evaluated as described in [Citation10].
AML cells
Samples from patients were obtained from BM aspirates at first admission to our department (ethical approval 051097, ethical committee of the University Hospital of Regensburg). Cells were then enriched for mononuclear cells (MNC) by Ficoll Hypaque (GE Healthcare Bio-Sciences, Pasching, Austria) density centrifugation and cryopreserved in liquid nitrogen until use.
Genechip microarray assay
Before employing MSC for gene array analysis, we proved the absence of any contamination with hematopoietic cells by flow cytometry. Sample preparation for microarray hybridization was carried out as described in the NuGEN Ovation PicoSL WTA System V2 and NUGEN Encore Biotin Module manuals (NuGEN Technologies, Inc, San Carlos, CA, USA). In brief, 40 ng of total RNA from 3 MSCAML, 3 MSCHD and 3 AML blasts after completed expansion were reverse transcribed into double-stranded cDNA in a two-step process, introducing a SPIA tag sequence. Bead purified cDNA was amplified by a SPIA amplification reaction followed by an additional bead purification. 4.5 µg of SPIA cDNA was fragmented, terminally biotin-labeled and hybridized to Affymetrix Human Gene 2.0 ST arrays for 16 h at 45°C in a GeneChip hybridization oven 640. Hybridized arrays were washed and stained in an Affymetrix Fluidics Station FS450, and the fluorescent signals were measured with an Affymetrix GeneChip Scanner 3000 7G. Fluidics and scan functions were controlled by the Affymetrix GeneChip Command Console v4.1.3 software.
Quantitative real-time RT–PCR
RNA was isolated with RNeasy Mini Kit (Qiagen, Hilden, Germany). RT–PCR was conducted using iScript cDNA Synthesis Kit (Bio-Rad Laboratories, Munich, Germany) to receive complementary DNA. Primers from TIB MOLBIOL Syntheselabor (Berlin, Germany) and a MyCyclerTM (Bio-Rad Laboratories) were used for real-time PCR using SSO Advanced Universal SYBR Green Supermix (Bio-Rad Laboratories). Results are presented relative to GAPDH expression.
List of primers used:
GAPDH F: TCAACGGATTTGGTCGTATTGGG
GAPDH R: TGATTTTGGAGGGATCTCGC
STC1 F: CAGCTGCCCAATCACTTC
STC1 R: TCTCCATCAGGCTGTCTCTGA
Immunohistochemistry
Immunohistochemistry (IHC) on BM sections was performed with the Histofine Simple Stain MAX PO (Nichirei Biosciences INC, Tokyo, Japan) according to the manufacturer’s instructions. In short, 3 μm sections from formalin-fixed paraffin-embedded BM specimens were placed on slides (Superfrost, Thermo Scientific, Walthamn, MA, USA). Sections were dewaxed and antigen retrieval was done by heating in 10 mM citrate puffer (pH 6.0). Endogenous peroxidase was quenched by a 3% solution of hydrogen peroxide. Sections were then stained with anti-STC1 (rabbit IgG, clone 1A3, #sc-293435, Santa Cruz Biotechnology, Heidelberg, Germany) as well as an anti-rabbit isotype antibody (rabbit IgG, Abcam, Cambridge, UK). Incubation was conducted over night at 4°C, all antibodies were used at a concentration of 0.5 μg/ml. Visualization was performed using the universal immuno-peroxidase polymer MAX-PO and Bright-DAB (ImmunoLogic, Duiven, The Netherlands). Sections were counterstained with Mayer’s hemalum solution (Merck KGaA, Darmstadt, Germany). Images were obtained with a Zeiss Axioskop 2 Plus microscope with an AxioCam HRc camera and Axiovision 4.7.2 software (Carl Zeiss, Oberkochen, Germany). No further image manipulation was done except modulation of brightness and contrast. Staining for STC1 was conducted with BM samples of 2 AML patients and 2 HD. The specificity of immunoreactive signals for STC1 was checked by negative controls using isotype control antibodies.
ELISA for soluble STC1
Soluble (s)STC1 was analysed in the culture supernatant of MSCAML compared to MSCHD. Frozen samples of MSCAML (n = 8) as well as MSCHD (n = 7) were thawed, resuspended in serum-free CytoMix – MSC human medium and after 10 days (medium change at day 2 and 5) analyzed using the commercially available Human Stanniocalcin 1 DuoSet enzyme-linked immunosorbent assay (ELISA; R&D Systems, Minneapolis, MN, USA). Supernatants were analyzed in duplicate in a 96-well plate according to the manufacturer’s instruction. sSTC1 measurement was conducted by reading the wavelength at 540 nm with a correction wavelength set to 570 nm using the Tecan Sunrise microplate absorbance reader and the Magellan 5 data analysis software (Tecan Group Ltd., Switzerland). The sensitivity of that assay is 1.26 ng/ml as provided by the manufacturer.
Analysis of blocking STC1 on AML cells
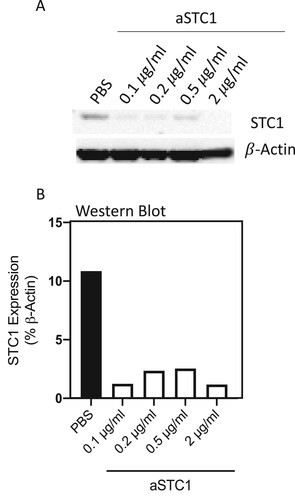
For investigating the impact of STC1 blockade on AML blast survival, co-culture experiments using human MSC as feeder layer were initiated. Experiments were performed as described earlier [Citation10]. In brief, MSC from AML patients or HD were plated in 24-well plates at a density of 3.8 × 10⁴ cells one week before the initiation of the co-culture. AML cells were resuspended in Iscove’s-modified Dulbecco’s Medium (IMDM, Life Technologies) supplemented with FBS, horse serum (PAA Laboratories), penicillin–streptomycin (Sigma-Aldrich), L-glutamine (Sigma-Aldrich), hydrocortisone (Rotexmedica, Trittau, Germany), 2-mercaptoethanol (Life Technologies, Darmstadt, Germany), IL3, TPO, FLT3L, SCF and G-CSF (all from PeproTech, Rocky Hill, NY, USA) and 2 × 10⁵ cells/well were cultured on MSC for 1–2 weeks with weekly half-medium changes. To evaluate the impact of STC1 blockade on proliferation and apoptosis of AML cells a neutralizing mouse anti-human STC1 (0.1 µg/ml) [Citation11] (IgG1, R&D Systems, Minneapolis, MN, USA) was used, and added daily to MSC-AML co-culture. The dose was chosen after performing a dose–response experiment, which shows that, using 0.1 μg/ml of anti-STC1 antibody, the STC1 expression is sufficiently inhibited and adding higher concentrations do not necessarily lead to better STC1 blockade (). After 7 and 14 days, proliferation and apoptosis of CD45+ AML cells was measured by flow cytometry as reported below.
Figure 1. Anti-STC1 dose–response experiment. (A) Immunoblot showing STC1 in MSC/AML co-culture after adding PBS and 0.1, 0.2, 0.5, 2 μg/ml of anti-STC1 antibody. β-Actin served as control. (B) Quantification of the same Immunoblot as in (A) by showing the percentage of STC1 expression related to β-Actin.
Analysis of MSC surface markers
To verify the MSC phenotype [Citation12] cells were harvested and stained for 30 min at 4°C with anti-CD29-Alexa Flour 488 (clone TS2/16), anti-CD44-PE (clone BJ18), anti-CD73-APC (clone AD2), anti-CD90-PE (clone 5E10), anti-CD105-Alexa Flour 488 (clone 43A3) mAbs and the appropriate isotype control antibodies. Hematopoietic cells were excluded by CD45 and CD34 staining (CD45-PerCP, clone HI30 and CD34-APC, clone 581; all Abs were obtained from BioLegend, San Diego, CA, USA). Analysis was conducted using a Becton Dickinson FACSCalibur flow cytometer (BD, East Rutherford, NJ, USA).
Analysis of AML cell proliferation
The effect of anti-STC1 on AML cell proliferation was determined with the fluorescent dye carboxyfluorescein diacetate succinimydil ester (CFSE, Molecular Probes, Eugene OR, US). CFSE binds covalently to intracellular molecules and fluorescence dilution after each cell division can be explored. For this, 5 × 10⁶ AML cells were stained with CFSE (0.5 µM in PBS) for 10 min at 37°C in the dark. Afterwards, ice-cold PBS/20% FBS was added and after washing, cells (2 × 10⁵) were co-cultured with MSC in a 24-well plate. After one week, cells were harvested and stained with anti-CD45-APC (BioLegend). CFSE fluorescence of CD45+ AML cells was then assessed by flow cytometry (BD FACSCalibur) and the division history was calculated.
Flow cytometry
Analysis of cell cycle
Cell cycle of AML cells was determined by PI staining of DNA. After one week of co-culture with MSC ± anti-STC1, cells were harvested, washed and resuspended in PBS (1 × 10⁶ in 200 μl). Then, ice-cold ethanol (70% in dH2O) was slowly added and cell suspension was incubated for 4 h on ice. After centrifugation, cells were incubated with PBS containing 25 μg/ml PI and 100 μg/ml RNAse (Applichem, Darmstadt, Germany) at 37°C. Measurement of DNA content was then performed on a FACSCalibur (BD). The percentages of cells within the S and G2 phase were added up for the AML cells.
Analysis of apoptosis
Apoptosis of AML cells was evaluated after two weeks of MSC co-culture with or without anti-STC1. Cells were harvested and stained with mouse anti-human CD45-APC (BioLegend) for 30 min at 4°C. After washing twice with cold PBS, cells were further stained using the FITC Annexin V Apoptosis Detection Kit (BD, Frankin Lakes, NJ, USA) according to manufacturer’s instruction. Annexin V+PI- apoptotic cell populations were analyzed using a BD FACSCalibur flow cytometer.
Transmission electron microscopy
Ultrastructural analysis was performed to compare cell interactions of MSC-AML under co-culture conditions with MSC cells in mono-culture. The cells were grown on autoclaved Thermanox (2 mm2) cover slips (EMS, Science Services, Germany) which were initially placed in the wells of a 24-well plate. Cells and the culture medium were added as described above (section ‘Analysis of blocking STC1 on AML cells’). The plates were incubated for 1, respectively 2 weeks and cell confluency was verified by light microscopy. Subsequently, the cover slips are moved from the well plate and fixed in buffered Karnovsky solution (2% paraformaldehyde and 2.5% glutaraldehyde). Afterwards, the samples were enclosed with 4% low-melting agarose, post-fixed in 1% cacodylate-buffered osmium tetroxide for 2 h, dehydrated in graded ethanol, embedded in EMbed812 epoxy resin (=EPON, EMS, Science Services, Germany) and polymerized for 2 days at 60°C. The formed Resin blocks were cut in semithin sections (0.8 µm thickness) with an ultramicrotome (Ultracut S, Reichert-Jung, Leica Microsystems, Germany) and stained with toluidine blue and basic fuchsine. Areas of interest were identified by light microscopy. After the selection, the EPON block was trimmed, cut in ultrathin sections (80 nm thickness) with a diamond knife (DIATOME, Switzerland) and mounted on grids (100 and 200mesh) which were double contrasted with aqueous uranyl acetate (2%) and lead citrate (Ultrostain II / LEICA). The generated sections were examined in an LEO912AB electron microscopy operating at 100 kV and images were taken with a side-mounted 2k x 2k CCD camera (Tröndle TRS, Moorenweis, Germany) with the iTEM software (Olympus Soft Imaging Solutions, Münster, Germany).
Western blot analysis
Proteins were separated by 4–12% SDS-PAGE, followed by standard western blot analysis with anti-STC1 (R&DSystems #MAB2958), anti-UCP2 (Cell Signaling #89326), anti-ßActin (GeneScript #A00730) and horseradish peroxidase-conjugated goat anti-mouse IgG (R&DSystems #HAF007) and mouse anti-rabbit IgG (Santa Cruz #2357).
DCFDA assay to evaluate ROS levels
To evaluate the functional implication of STC1 in AML cell survival cellular ROS was detected in MSC-AML cell co-culture after addition of 0.1 µg/ml anti-STC1 compared to control (PBS) using a special assay kit (Abcam, Cambridge, MA, USA). In short, 2′,7′-dichlorofluorescein diacetate (DCFDA), a fluorogenic dye which detects intracellular hydroxyl, peroxyl and other ROS activity, was supplemented to the flow cytometry tubes containing co-culture medium without plastic-adherent MSC. After intracellular diffusion, DCFDA was deacetylated by cellular esterases to a non-fluorescent molecule, that was afterwards oxidized by ROS into 2′,7′-dichlorofluorescin (DCF), an extremely fluorescent compound. Fluorescence from the DCF was measured using a Becton Dickinson FACSCalibur flow cytometer (BD, East Rutherford, NJ, USA). ROS formation was further induced by tert-butyl hydrogen peroxide (TBHP). Detection was performed 1 and 4 h after incubaton with DCFDA ± TBHP.
Statistical analysis
Data are presented as average +/− standard error of the mean (SEM). Student’s t-test or one-way analysis of variance (ANOVA) was used for assessing statistical significance, a p-value < 0.05 was regarded statistically significant. Analyses were conducted using PRISM 7 (Graphpad, San Diego, CA, US) statistical software. FlowJo (Ashland, OR, US) was used to analyze flow cytometric data.
Results
MSCAML showed decreased expansion capacity compared to MSCHD
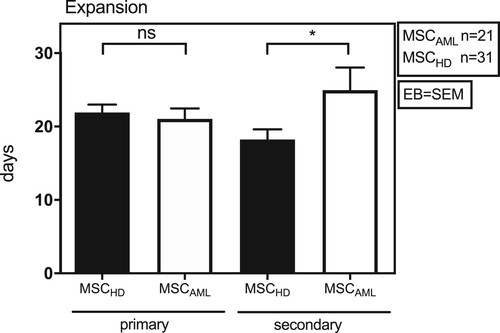
In a first step, expansion ability of MSC from patients with MSCHD (n = 31) and MSCAML (n = 21; AML samples 1-21) was investigated in DMEM MSC culture medium. As shown in , no differences could be detected between MSCHD and MSCAML concerning the initial expansion in 100 mm cell culture dishes (primary expansion; 21.9 ± 6.0 days vs. 21.0 ± 6.5 days, t-Test: p = 0.6, EB = SEM). In cell culture flasks (secondary expansion), however, human MSCAML showed significantly slower expansion capacity than MSCHD (18.2 ± 7.7 days vs. 25.0 ± 4.1 days, t-Test: p = 0.03, EB = SEM).
Figure 2. MSCAML need more time to expand in culture flasks than MSCHD. Absolute number of days BM-MSCAML (n = 21; AML samples 1–21) or -MSCHD (n = 31) needed to expand in 100 mm cell culture dishes (primary expansion) till 100% confluence was achieved and afterwards in 75 cm2 cell culture flasks (secondary expansion) till 80% confluence was achieved. Error bar = SEM; p (primary) = 0.6; p (secondary) = 0.03.
MSCAML displayed a different gene expression profile compared to MSCHD, with distinctly higher expression of STC1
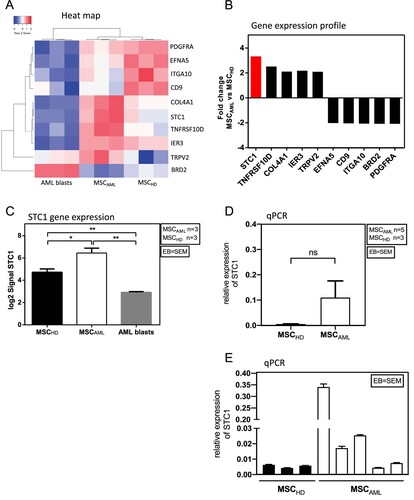
To further investigate the differences between MSCAML (n = 3) and MSCHD (n = 3), we assessed 48 144 genes, whereof 141 showed significant over- or under-expression in MSCAML. However, in the literature only 10 of these genes were associated with MSC or AML cells within the BM niche ((A, B)): STC1, TNFRSF10D, COL4A1, IER3, TRPV2 were overexpressed while EFNA5, CD9, ITGA10, BRD2, PDGFRA were under-expressed [Citation7–9,Citation13–26]. The most relevant gene was STC1, which was 3.3-fold overexpressed in MSCAML compared to MSCHD and 11.6-fold compared to AML blasts. Accordingly, as shown in (C), the direct comparison of STC1 log2 signal revealed significantly higher expression in MSCAML compared to MSCHD and the lowest signal in AML blasts (n = 3; AML samples 3–5) from the same patients (6.4 ± 0.4 vs. 4.7 ± 0.3 vs. 2.9 ± 0.1, t-Test: p (MSCAML vs. MSCHD) = 0.03; p (MSCAML vs. AML blasts) = 0.001; p (MSCHD vs. AML blasts) = 0.004, EB = SEM). To further confirm the STC1 expression differences, we quantified the transcripts of this gene in MSCHD vs. MSCAML. Although these qPCR results failed to reach significance ((D)), they show clear STC1 overexpression in more than half of the AML patients investigated ((E)).
Figure 3. MSCAML present a different gene expression profile compared to MSCHD with STC1 being mostly overexpressed in MSCAML. (A) Heat map of differentially expressed genes (p < 0.05) among MSC and AML blasts. Red and blue colors designate increased and decreased expression, respectively. (B) Fold change gene expression signal of genes which were known to be implicated in the BM niche and which were significantly over- or underexpressed in MSCAML compared to MSCHD. (C) STC1 log2 signal in MSCAML (n = 3; AML samples 3–5) compared to MSCHD (n = 3) and AML blasts (n = 3; AML samples 3–5). Error bar = SEM, p (MSCAML vs. MSCHD) = 0.03; p (MSCAML vs. AML blasts) = 0.001; p (MSCHD vs. AML blasts) = 0.004. (D, E) Quantitative RT-PCR of STC1 mRNA in 3 MSCHD and 5 MSCAML. Results are relative to GAPDH. PDGF = Platelet Derived Growth Factor, EFNA5 = Ephrin A5, ITGA10 = Integrin Alpha 10, CD9 = Cluster of Differentiation 9, COL4A1 = Collagen Alpha 1 (IV) chain, STC1 = Stanniocalcin 1, TNFRSF10D = Tumor Necrosis Factor Receptor Superfamily Member 10D, IER3 = Immediate Early Response 3, TRPV2 = Transient Receptor Potential Cation Channel Subfamily V member 2, BRD2 = Bromodomain-containing protein 2.
MSCAML secreted higher amounts of STC1 than MSCHD
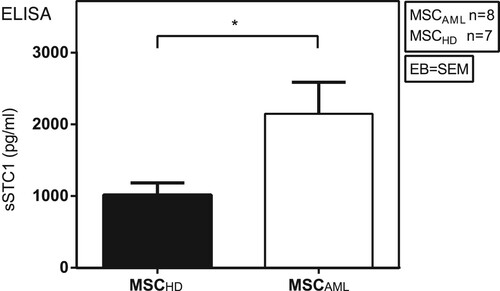
One previous study demonstrated that MSC are able to promote survival of lung cancer cells by secretion of STC1 [Citation7]. Since our group highlighted in a recent study the importance of cytokines in MSC-AML cell interaction [Citation10], we now investigated the STC1 secretion capability of MSCAML compared to MSCHD by ELISA, to dissect if the differences seen at mRNA level could be also detected at the protein level. As demonstrated in , our results showed significantly higher concentration of soluble STC1 (sSTC1) in the mono-culture supernatant of MSCAML (n = 8; AML samples 8–14 and 27) compared to MSCHD (n = 7) (2147.6 ± 441.6 pg/ml vs. 1016.9 ± 166.1 pg/ml, p = 0.0412, EB = SEM).
Figure 4. MSCAML secrete higher amounts of STC1 than MSCHD. Soluble STC1 (sSTC1) concentration (pg/ml) was determined by ELISA in mono-culture supernatant of MSCAML (n = 8; AML samples 8–14 and 27) compared to MSCHD (n = 7) with duplicate measurements, data are presented as mean +/− SEM; p = 0.0412.
The expression of STC1 was increased in the BM from AML patients compared to HD
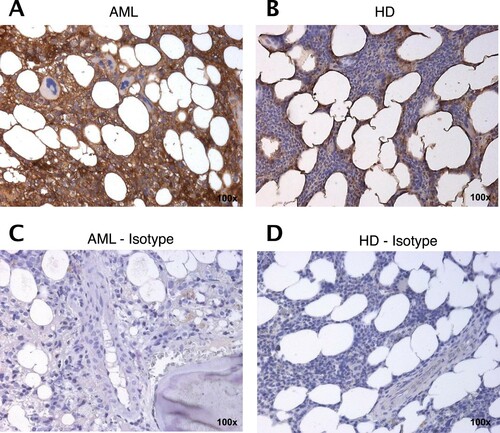
To further confirm that MSCAML secrete more STC1 proteins than MSCHD, we investigated the expression of STC1 within the BM of AML patients compared to HD by immunohistochemical analyses. As shown exemplary in , expression of STC1 (brown color) was obviously increased in AML-BM ((A); Isotype 5C; AML sample 22) compared to HD ((B); Isotype 5D).
Figure 5. STC1 expression is increased in the BM from AML patients compared to HD. Representative immunohistology staining of STC1 (brown) on AML patient (A; AML sample 22) and HD (B) derived BM sections as compared to isotype control (C, D). 100× magnification.
In co-culture, MSC and AML cell reciprocal stimulation became apparent
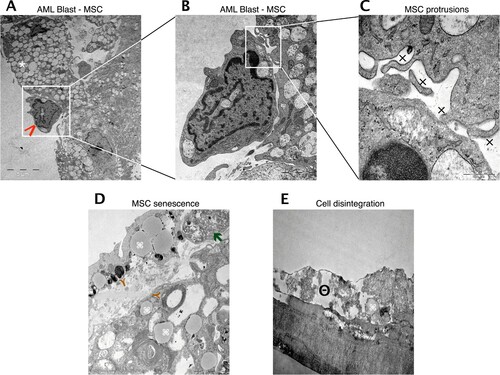
In a recent work, we demonstrated that leukemic cells are difficult to maintain in the absence of a non-hematopoietic feeder layer and that human primary MSC are superior in maintaining AML cells compared to murine MS-5 stromal cells [Citation10]. We now investigated by transmission electron microscopy if this interaction can be called symbiotical, i.e. if not only AML cells but also MSC are able to benefit from the co-culture condition (AML sample 23). The ultrastructure of this in vitro cell interaction revealed a tight cell-to-cell collocation ((A–C)) with emergence of multiple MSC secretory vesicles and cytodendrites. However, tight junctions could not be observed, fitting to the presumed paracrine mode of communication between MSC and AML cells. When cultured alone, MSC exhibit lipid inclusions, myelin-like inclusions and phagocytes after one week, indicating senescence ((D)). After two weeks, cell disintegration with cytoplasmic dissolution could be observed ((E)).
Figure 6. Reciprocal stimulation of human BM MSC in co-culture with AML cells. Representative electron microscopy images of co-cultured MSC and AML cells. (A) Tight cell to cell collocation of MSC (white asterisk) and AML blast (red arrow; AML sample 23) recognized in co-culture conditions after two weeks. A remarkable amount of secretory vesicles can be identified within the MSC cytoplasm. In higher resolutions (B, C) multiple protrusions (x) were obvious, but no evidence of tight junctions. (D) MSC in mono-culture after one week with obvious appearance of lipid inclusions (brown Y), myelin like inclusions (command sign) and phagocytes (green arrow), indicating senescence. (E) MSC in mono-culture after two weeks with cytoplasmic dissolution, indicating cell disintegration (minus symbol inside a circle).
Blockade of STC1 did not influence proliferation and apoptosis of AML cells
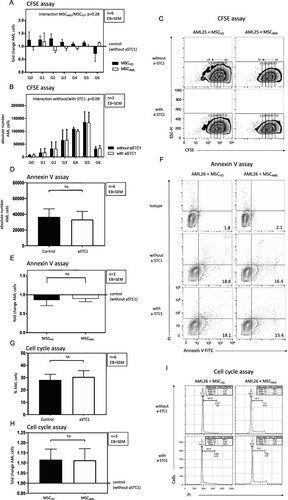
Since STC1 signaling pathway was proposed to play a role in aberrant hematopoiesis [Citation8], we investigated the effect of blocking STC1 on primary AML cell proliferation by flow cytometry using a CFSE based proliferation assay and cell cycle analysis. In the AML populations from three AML cases (AML samples 24–26), blocking of STC1 was not associated with significantly increased cell proliferation compared to control without anti-STC1 ((A, C, G, I)). Concordant with the proliferation analysis, there was no significant difference in induction of apoptosis by inhibiting STC1 ((E, F)). In addition, no differences could be seen with regard to the proliferation and apoptosis of AML cells co-cultured with MSCAML vs. MSCHD ((B, D, H)).
Figure 7. Blockade of STC1 had no effect on proliferation and apoptosis of AML cells. (A, B) Absolute number of successive generations (G1–G6) of AML cells (3 patients: AML samples 24–26), co-cultured with MSCAML (n = 3) ± anti-STC1 vs. MSCHD (n = 3) ± anti-STC1. Two-way ANOVA interaction between the row and the column factor: p = 0.28. (C) Representative zebra plot of CFSE stained AML cells from one patient. (D, E) Absolute count of apoptotic AML cells (3 patients: AML samples 24–26), co-cultured with MSCAML (n = 3) + anti-STC1 vs. MSCHD (n = 3) + anti-STC1, relative to the results of the control dishes. (F) Representative contour plot of Annexin V-FITC/PI stained AML cells from one patient. (G, H) Percentage of S/G2-phase AML cells (3 patients: AML samples 24–26), co-cultured with MSCAML (n = 3) ± anti-STC-1 vs. MSCHD (n = 3) ± anti-STC-1. (I) Representative histogram of PI stained AML cells from one patient. Percentage of cells in S-, G1- and G2-phase are displayed.
Blockade of STC1 did not affect UCP2 protein expression and ROS levels
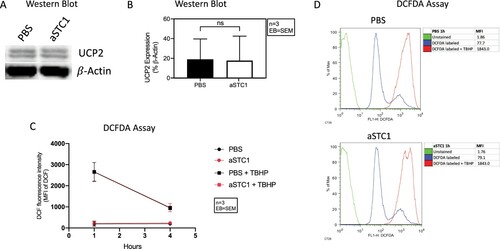
Ohkouchi et al. demonstrated the ability of MSC to augment the Warburg effect and promote the survival of lung cancer cells by making them resistant to ROS through secretion of STC1 and subsequent upregulation of UCP2 [Citation7]. Therefore, to further evaluate the functional implication of STC1 in AML cell survival, we preformed western blot analysis of UCP2 expression and detected ROS levels (using a DCFDA assay) after blocking STC1 in MSC-AML cell co-culture. STC1 inhibition was not accompanied by increased UCP2 protein expression ((A, B)). In line with this, we could not measure any differences in ROS levels 1 and 4 h after the addition of anti-STC1 compared to control. This was also the case after inducing ROS with tert-butyl hydrogen peroxide (TBHP) ((C, D)).
Figure 8. STC1 inhibition had no effect on UCP2 expression and ROS levels of AML cells. (A) Immunoblot showing UCP2 in MSC/AML co-culture after adding PBS and 0.1 μg/ml of anti-STC1 antibody. β-Actin served as control. (B) Quantification of the same Immunoblot as in (A) by showing the percentage of UCP2 expression related to β-Actin. (C) DCF fluorescence intensity 1 and 4 h after incubation with DCFDA ± TBHP. (D) Representative histogram depicting the DCF fluorescence intensity of unstained (green), DCFDA (blue) and DCFDA + TBHP (red) treated AML cells from one patient 1 h after addition of anti-STC1 to the MSC-AML cell co-culture.
Discussion
Human BM MSC promote hematopoietic progenitor cells by conserving function and thus granting proliferation, differentiation and mobilization. In our last study [Citation10], we approached the question if BM stromal cells are also supportive to AML cells. Our results demonstrated that human MSC are very efficient feeder cells, able to maintain AML cells in long-term culture. This advantageous co-existence seems to be due partially to molecules pivotal for intercellular communication within the niche. We showed that transforming growth factor beta 1 (TGFβ1) and C-X-C motif chemokine 12 (CXCL12) are two of these major regulators.
In order to identify other proteins involved in MSC-guided promotion of leukemic cells we now investigated the differences in gene expression profile between MSCAML and MSCHD. Using MSC mono-culture models, we first demonstrated that MSCAML had a significant slower expansion ability (time till 80% of the culture flasks appear confluent) compared to MSCHD. This is in line with recently published data by Desbourdes et al., showing longer population doubling time (PDT) and, corresponding to this, lower proliferation capacity measured by CFSE assay in MSCAML compared to MSCHD [Citation27]. The same authors stated multiple significant differences in gene expression profile of MSCAML compared to MSCHD, however concluding that niche factors are downregulated in MSCAML. By contrast, we identified five genes (STC1, TNFRSF10D, COL4A1, IER3, TRPV2) with known implication within the BM niche which were significantly overexpressed in MSCAML compared to MSCHD, while another five genes (EFNA5, CD9, ITGA10, BRD2, PDGFRA) showed significantly lower gene expression [Citation7–9,Citation13–26].
We then concentrated on STC1 which was the most overexpressed gene in MSCAML compared to MSCHD (3.3-fold). At the same time, STC1 was even more overexpressed in MSCAML compared to AML blasts (11.6 fold). This could be associated with the evidence in lung cancer cell models that STC-1 was initially produced and secreted by MSC and not by the neoplastic cell [Citation7]. However, as demonstrated in lung cancer but also in AML models, the STC1/UCP2 axis is upregulated in MSC within the neoplastic milieu [Citation7,Citation8]. This is in line with our observations. Using ELISA, we demonstrated significantly increased STC1 secretion by MSCAML compared to MSCHD. Concordant to this, immunohistochemical analysis of BM sections revealed markedly higher STC1 expression in BM from AML patients compared to HD. Tohmiya et al. already concluded that STC1 could be a novel marker for minimal residual disease of acute leukemia, and for an early diagnosis of relapse [Citation9].
To get further insights, we used MSC and AML co-culture models to mimic the in vivo leukemic niche. Firstly, we asked if the paracrine signaling path could be confirmed for stroma-AML cell intercommunication morphologically. We therefore investigated for the first time the ultrastructural characteristics of MSC-AML cell interaction by transmission electron microscopy. In our last report, we demonstrated that leukemic cells are difficult to maintain in the absence of a non-hematopoietic feeder layer [Citation10]. We now identified that MSC can also profit from AML cell intercommunication, beginning a process of degradation when cultured only alone longer than 1 week. Attributable to AML cell presence, MSC got overstimulated, generating many secretory vesicles, which, in the absence of tight junctions, were needed for paracrine communication. This concept of bidirectional interaction between stroma and pathogenic hematopoietic cells is in line with the current understanding of leukemic niche development, like it was evidenced by Medyouf et al. [Citation28]. In this xenograft transplant model, HSC from human low-risk MDS only engrafted when co-transplanted with autologous MSC. This demonstrated their dependency on signals from MSC. At the same time, healthy MSC adopted a phenotype similar to that of MSC from MDS patients when exposed to hematopoietic MDS cells.
In order to elaborate if STC1 is an important factor in MSC-AML cell interaction, we generated for the first time an in vitro co-culture model and tested if blockade of STC1 can disrupt the leukemia-stroma cell interaction. So far, Samudio et al. was the only group to highlight UCP2, a constituent of the STC1/UCP2 axis, as promoter of the Warburg effect in leukemic cells and thereby as an important factor facilitating leukemic survival [Citation8]. Nonetheless, they did not refer to the role of STC1, which was shown to upregulate UCP2 in the already mentioned MSC-lung cancer cell model [Citation7]. Surprisingly, measuring primary AML cell proliferation by CFSE assay, we could not detect a significant decrease of AML cells in successive generations when STC1 is blocked. Accordingly, cell cycle analysis showed no differences in the percentage of S/G2-phase AML cells after addition of anti-STC1 to the co-culture medium. Likewise, blockade of STC1 by anti-STC1 did not influence AML cell apoptosis in our setting. Addressing the above-mentioned publications, further evaluation of the functional role of STC1 in AML cell survival revealed no differences in UCP2 protein expression and ROS levels after STC1 inhibition. Therefore, we could not confirm the beneficial implication of STC1 in MSC-AML cell interaction as we initially presumed after considering the above-mentioned publications.
It should be also mentioned, that an extrapolation from in vitro experiments to the in vivo condition must be interpreted cautiously. Moreover, as reported by other authors, not all AML samples grow similarly well under feeder cell conditions. For example, AML with t(8;21)(q22;q22.1);RUNX1-RUNX1T1 barely proliferate in vitro [Citation29].
Information about the structure and function of the hematopoietic BM niche has considerably increased in the last years but still few is known about the mechanisms within the leukemic niche. Our data demonstrate that MSCAML have different features compared to MSCHD. One of the molecules which was most overexpressed in MSCAML is STC1. Though we could prove this by different methods, blockade of this pathway in MSC-AML cell co-culture was not associated with effects on AML cell proliferation or apoptosis. Nonetheless, it should be mentioned that due to the small sample size and variable expansion of individual AML patient cells further investigations are needed to draw in depth conclusions.
Acknowledgements
We have had the support of Laboratories of José Carreras Center, University Hospital Regensburg for use of Becton Dickinson FACS ARIA IIu cell sorter. Therefore, we thank Rüdiger Eder and Irina Fink.
Disclosure statement
No potential conflict of interest was reported by the author(s).
Data availability statement
The data that support the findings of this study are openly available in figshare at https://doi.org/10.6084/m9.figshare.14465721.v1 [Citation30].
References
- Mendez-Ferrer S, Michurina TV, Ferraro F, et al. Mesenchymal and haematopoietic stem cells form a unique bone marrow niche. Nature. 2010;466(7308):829–834.
- Fortunel NO, Hatzfeld A, Hatzfeld JA. Transforming growth factor-beta: pleiotropic role in the regulation of hematopoiesis. Blood. 2000;96(6):2022–2036.
- Ruscetti FW, Akel S, Bartelmez SH. Autocrine transforming growth factor-beta regulation of hematopoiesis: many outcomes that depend on the context. Oncogene. 2005;24(37):5751–5763.
- Zeng Z, Shi YX, Samudio IJ, et al. Targeting the leukemia microenvironment by CXCR4 inhibition overcomes resistance to kinase inhibitors and chemotherapy in AML. Blood. 2009;113(24):6215–6224.
- Nervi B, Ramirez P, Retting MP, et al. Chemosensitization of acute myeloid leukemia (AML) following mobilization by the CXCR4 antagonist AMD3100. Blood. 2009;113:6206–6214.
- Tabe Y, Shi YX, Zeng Z, et al. TGF-beta-neutralizing antibody 1D11 enhances cytarabine-induced apoptosis in AML cells in the bone marrow microenvironment. PLoS One. 2013;8(6):e62785.
- Ohkouchi S, Block GJ, Katsha AM, et al. Mesenchymal stromal cells protect cancer cells from ROS-induced apoptosis and enhance the Warburg effect by secreting STC1. Mol Ther. 2012;20(2):417–423.
- Samudio I, Fiegl M, McQueen T, et al. The Warburg effect in leukemia-stroma cocultures is mediated by mitochondrial uncoupling associated with uncoupling protein 2 activation. Cancer Res. 2008;68(13):5198–5205.
- Tohmiya Y, Koide Y, Fujimaki S, et al. Stanniocalcin-1 as a novel marker to detect minimal residual disease of human leukemia. Tohoku J Exp Med. 2004;204(2):125–133.
- Schelker RC, Iberl S, Müller G, et al. TGF-beta1 and CXCL12 modulate proliferation and chemotherapy sensitivity of acute myeloid leukemia cells co-cultured with multipotent mesenchymal stromal cells. Hematology. 2018;23(6):337–345.
- Liu G, Yang G, Chang B, et al. Stanniocalcin 1 and ovarian tumorigenesis. J Natl Cancer Inst. 2010;102(11):812–827.
- Dominici M, Le Blanc K, Mueller I, et al. Minimal criteria for defining multipotent mesenchymal stromal cells. The international society for cellular therapy position statement. Cytotherapy. 2006;8(4):315–317.
- Secchiero P, Melloni E, Corallini F, et al. Tumor necrosis factor-related apoptosis-inducing ligand promotes migration of human bone marrow multipotent stromal cells. Stem Cells. 2008;26(11):2955–2963.
- Ullah M, Sittinger M, Ringe J. Extracellular matrix of adipogenically mesenchymal stem cells reveals a network of collagen filaments, mostly interwoven by hexagonal structural units. Matrix Biol. 2013;32(7-8):452–465.
- Sudhakar A, Nyberg P, Keshamouni VG, et al. Human alpha1 type IV collagen NC1 domain exhibits distinct antiangiogenic activity mediated by alpha1beta1 integrin. J Clin Invest. 2005;115(10):2801–2810.
- Chen SY, Lin JS, Yang BC. Modulation of tumor cell stiffness and migration by type IV collagen through direct activation of integrin signaling pathway. Arch Biochem Biophys. 2014;555-6:1–8.
- Steensma DP, Neiger JD, Porcher JC, et al. Priority report: rearrangements and amplification of IER3 (IEX-1) represent a novel and recurrent molecular abnormality in myelodysplastic syndromes (MDS). Cancer Res. 2009;69(19):7518–7523.
- Morelli MB, Liberati S, Amantini C, et al. Expression and function of the transient receptor potential ion channel family in the hematologic malignancies. Curr Mol Pharmacol. 2013;6(3):137–148.
- Kuang S-Q, Bai H, Fang Z-H, et al. Aberrant DNA methylation and epigenetic inactivation of Eph receptor tyrosine kinases and ephrin ligands in acute lymphoblastic leukemia. Blood. 2010;115(12):2412–2419.
- Yamazaki H, Xu CW, Naito M, et al. Regulation of cancer stem cell properties by CD9 in human B-acute lymphoblastic leukemia. Biochem Biophys Res Commun. 2011;409(1):14–21.
- Toh WS, Lai RC, Zhang B, et al. MSC exosome works through a protein-based mechanism of action. Biochem Soc Trans. 2018;46(4):843–853.
- Reinisch A, Etchart N, Thomas D. Epigenetic and in vivo comparison of diverse MSC sources reveals an endochondral signature for human hematopoietic niche formation. Blood. 2015;125(2):249–260.
- Mochmann LH, Neumann M, von der Heide EK, et al. ERG induces a mesenchymal-like state associated with chemoresistance in leukemia cells. Oncotarget. 2014;5(2):351–362.
- Liu S, Walker SR, Nelson EA, et al. Targeting STAT5 in hematologic malignancies through inhibition of the bromodomain and extra-terminal (BET) bromodomain protein BRD2. Mol Cancer Ther. 2014;13(5):1194–1205.
- Pinho S, Lacombe J, Hanoun M, et al. PDGFRalpha and CD51 mark human Nestin+ sphere-forming mesenchymal stem cells capable of hematopoietic progenitor cell expansion. J Exp Med. 2013;210(7):1351–1367.
- Demoulin J-B, Montano-Almendras CP. Platelet-derived growth factors and their receptors in normal and malignant hematopoiesis. Am J Blood Res. 2012;2(1):44–56.
- Desbourdes L, Javary J, Charbonnier T, et al. Alteration of bone marrow mesenchymal stromal cells from de novo acute myeloid leukemia patients at diagnosis. Stem Cells Dev. 2017;26(10):709–722.
- Medyouf H, Mossner M, Jann JC, et al. Myelodysplastic cells in patients reprogram mesenchymal stromal cells to establish a transplantable stem cell niche disease unit. Cell Stem Cell. 2014;14:824–837.
- van Gosliga D, Schepers H, Rizo A, et al. Establishing long-term cultures with self-renewing acute myeloid leukemia stem/progenitor cells. Exp Hematol. 2007;35(10):1538–1549.
- Schelker R. (2021). GeneChip microarray assay_STC1.xls. figshare. Dataset. doi:https://doi.org/10.6084/m9.figshare.14465721.v1.