
ABSTRACT
Mean corpuscular volume (MCV) as a measure of the size of red blood cells (RBCs) has been pivotal in the diagnosis and morphologic classification of anemias for over a century. Despite its ubiquitous use and time-honored diagnostic value, one essential attribute of MCV has remained under the radar. It has been long underappreciated that the size of RBC correlates with the amount of hemoglobin (Hb) that it accommodates and, therefore, is an important determining factor of the total Hb level. By scrutinizing this basic principle, it has become possible to uncover a hitherto obscured relationship between MCV, hematocrit (Hct) and RBCs described as a dynamic equilibrium. This principle is shown to be invaluable in interpreting RBC parameters, particularly for the evaluation of patients with polycythemia.
Introduction
Hemoglobin (Hb), hematocrit (Hct) and red blood cells (RBCs) are indispensable for diagnosing anemias and polycythemias. The RBC indices, on the other hand, especially mean corpuscular RBC volume (MCV), have been used primarily in the evaluation of anemias. The role of MCV in the diagnosis of polycythemia is not known.
The fundamental relationship between the size of erythrocytes and their Hb content has been recognized for over 100 years [Citation1,Citation2]. The studies showed that larger erythrocytes (macrocytes) accommodate a greater amount of Hb than smaller erythrocytes (microcytes). This principle was later validated by demonstrating that MCV value mirrors the mean RBC Hb (MCH) [Citation3], but its clinical utility remained unrecognized until recently [Citation4]. Herein, this principle is revisited and applied to clinical practice for the evaluation of polycythemias.
Methods
This was an observational study. Patients with various clinical conditions were evaluated. Their routine RBC parameters acquired by using the electronic Hematology Analyzer, Sysmex XN-1000TM, were analyzed. The formula Hct = MCV × RBC was tested to establish the contribution of the independent variables (MCV and RBC) to the dependent one (Hct). Consequently, a new rule of dynamic equilibrium has been recognized. A few illustrative cases were selected for practical demonstration of the rule and its value in diagnosing polycythemias.
Results and discussion
Basic Considerations: Historically, MCV was calculated at the patient’s bedside by using a simple arithmetic operation – Hct divided by RBCs. The calculation instantly categorized anemias as normocytic, microcytic or macrocytic [Citation2,Citation5] and pointed to possible anemia etiology. If, for example, anemia is identified as macrocytic (high MCV), the diagnostic process aims at the specific pathologies such as vitamin deficiency, alcohol and drug effects. Thus, the diagnostic value of macrocytosis has been confined traditionally and unvaryingly to identify its cause. In contrast, the effect that macrocytosis exerts on RBC parameters such as Hb and Hct has been scarcely recognized [Citation6]. Because the size of RBCs (MCV) determines the Hb content of RBCs (MCH), the higher the MCV/MCH, the higher the Hb and vice versa. Similarly, MCV is a principal contributor to Hct because Hct is a product of RBCs of certain sizes: Hct = RBC × MCV. This classic formula not only demonstrates how Hct is calculated (manually or by cell analyzers), but it also exposes the fact that MCV is as important in determining Hct as RBCs.
‘Dynamic Equilibrium’: In addition to its clinical value, the equation Hct = RBC × MCV links the three red cell parameters in an important way. It demonstrates that while RBCs and MCV operate together, each parameter contributes to Hct individually. A simple way of thinking about the interplay of these variables is to picture a seesaw, where Hct is a pivot point, and RBCs and MCV represent swinging ends (). For Hct to remain steady, RBCs and MCV must be in dynamic equilibrium. That is, if the RBCs decline, the MCV must proportionally increase and vice versa. If, however, Hct is rising, it is paramount to estimate separately the impact of MCV and RBCs on Hct to identify the sole (or dominant) cause of the abnormality. Different causes will require different diagnostic pathways.
Practical Examples of the ‘Dynamic Equilibrium’: The way in which the dynamic equilibrium works in practice is traceable when at least two contrasting blood count readings are available. For example, patient 1 () demonstrates that while Hct levels are virtually identical in two separate tests, the RBC counts and MCV values are distinctly different: the RBCs have declined, but the MCV has increased (highlighted fields). These reciprocal changes in RBC and MCV values maintain the Hct in balance because the effect of each parameter is offset by the other. Such a synchronized interplay of MCV and RBCs in regulating the Hct level is universal and omnipresent. For example, heterozygous thalassemia characteristically exhibits pronounced microcytosis caused by impaired Hb synthesis. However, a total Hct level commonly remains normal or near normal due to compensatory erythropoiesis (erythrocytosis) that counterbalances the effect of low MCV [Citation7]. Similarly, the concurrent but opposing effects of RBCs and MCV on Hct occur in patients with polycythemia vera treated with hydroxyurea. On the one hand, hydroxyurea suppresses RBC production via inhibition of DNA synthesis. On the other hand, it causes RBC enlargement and an increase in MCH [Citation8,Citation9] that, in aggregate, balances the two counteractive drug effects with a resultant normal Hb level [Citation10,Citation11]. How this mechanism can be leveraged to clinical advantage is described below.
Clinical Applications of the ‘Dynamic Equilibrium’: Although MCV contribution to Hb/Hct is universal, it is particularly advantageous for assessing polycythemias as the following two examples illustrate. Patient 2 () presented with elevated Hct. In retrospect, the Hct rise occurred solely because of increased RBC count. The MCV input was nonexistent because its value remained unchanged (highlighted fields). This scenario is consistent with polycythemia vera or secondary erythrocytosis. Patient 3 (), who was noted to have his Hct increased by 7.5 points, demonstrates the opposite scenario. His Hct has increased exclusively due to increased MCV because RBCs, being stable, could not cause this change. Such cases should be easy to recognize provided appropriate vigilance. More challenging is the circumstances where RBC and MCV trigger Hb/Hct elevation by their ascending, but normal, values. Patient 4 () illustrates such a scenario.
Figure 1. Dynamic equilibrium. According to the formula Hct = MCV × RBC, both MCV and RBCs contribute to Hct level. If the values of MCV and RBC change equally and proportionally, Hct level remains stable.
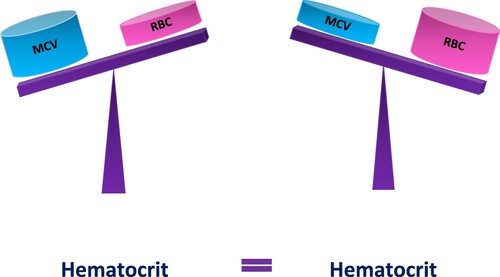
Table 1. The patients’ RBC parameters. The parameters with clinically meaningful changes in values are highlighted.
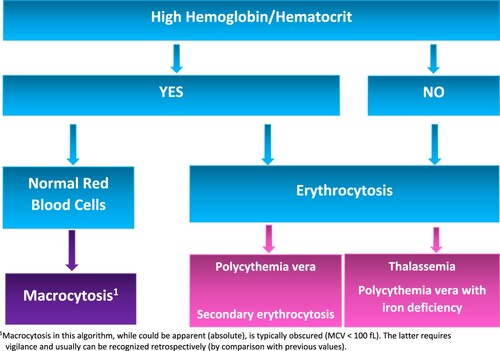
Because MCV elevation is common [Citation12] and frequently occurs without anemia [Citation13,Citation14], the described clinical effect of macrocytosis is more prevalent than generally appreciated. Moreover, the impact of MCV on Hb/Hct is by no means trivial. The observations demonstrate that the effect of a 10 fL-change in the MCV value on the total Hct approximates a change of 0.5 × 10⁶/µL in the RBC count. The recognition of RBC count equivalent of MCV explains the capacity of MCV to force Hb/Hct beyond the normal levels even in the absence of high RBCs. And, vice versa, it shows how even borderline MCV (<100 fL) can cause abnormally high Hb/Hct. Such cases, if unrecognized, could be incorrectly interpreted as polycythemia vera (, patients 3 and 4) and trigger unnecessary and costly tests (spleen imaging, erythropoietin and JAK2 mutation analyses) [Citation4]. shows a diagnostic algorithm demonstrating how clinically meaningful ‘relative macrocytosis’ can be identified.
Figure 2. A simple diagnostic algorithm for identification of relative macrocytosis as a contributing factor to Hb/Hct elevation. Macrocytosis could be borderline (MCV < 100 fL) or relative compared to previous measurements.
For the rule of dynamic equilibrium to work, accurate RBC and MCV measurements are mandatory. Spurious macrocytosis and spurious erythrocytosis will predictably cause a wrong interpretation.
MCV and Polycythemia Vera Diagnosis
It is customary to refer to high Hb/Hct levels as erythrocytosis. In fact, high Hb/Hct rather than high RBC count fulfill the World Health Organization’s major criterion for polycythemia vera [Citation15]. It has been shown previously that Hb cannot be used as a surrogate marker for absolute erythrocytosis [Citation16]. This study corroborates this notion by showing that Hb/Hct is affected not only by RBCs but MCV as well. Therefore, substituting ‘erythrocytosis’ with ‘high Hb/Hct’ is not only confusing but also conceptually wrong. Perhaps ‘hyperhemoglobinemia’ could solve this terminological dilemma.
Conclusion
The clinical value of MCV extends beyond the established merits of guiding anemia work-up as demonstrated here. The recognition that MCV is linked to Hb/Hct levels and RBC count in a quantifiable way has important practical applications. Whether MCV or RBCs is a principal cause of rising Hct is of profound clinical significance as it provides an important clue to the etiology of the abnormal tests and informs about the plan of further work-up. The approach allows instant narrowing of differential diagnosis thereby sparing costly resources in everyday evaluation of polycythemias.
Ackowledgements
The author received no support from any individual, organization, grant or corporation.
Disclosure statement
No potential conflict of interest was reported by the author(s).
Additional information
Funding
References
- Haden RL. Clinical significance of volume and hemoglobin content of the red blood cell. Arch Intern Med (Chic). 1932;49(6):1032–1057. doi:https://doi.org/10.1001/archinte.1932.00150130155013.
- Capps JA. A study of volume index: observations upon the volume of the erythrocyte and various diseased conditions. J M Res. 1903;10:367.
- Fischer SL, Fischer SP. Mean corpuscular volume. Arch Intern Med. 1983;143:282–283.
- Yavorkovsky LL. Elevated hemoglobin and macrocytosis: A neglected association to become a diagnostic tool (Case report). Permanente J. In press.
- Wintrobe MM. Classification of anemias on the basis of differences in the size and hemoglobin content of the red corpuscles. Proc Soc Exp Biol Med. 1930;27(9):1071–1073.
- Doig K, Zhang B. A methodical approach to interpreting the red blood cell parameters of the complete blood count. Clin Lab Sci. 2017;30(3):173–185. doi:https://doi.org/10.29074/ascls.30.3.173.
- Bessman JD. Microcytic polycythemia. Frequency of nonthalassemic causes. JAMA. 1977;238:2391–2392. doi:https://doi.org/10.1001/jama.1977.03280230055022.
- Burns ER, Reed LJ, Wenz B. Volumetric erythrocyte macrocytosis induced by hydroxyurea. Am J Clin Pathol. 1986;85(3):337–341. doi:https://doi.org/10.1093/ajcp/85.3.337.
- Spier S, Solomon LM, Esterly NB. A study of volume index. Observations upon the volume of erythrocytes in various disease conditions. J Med Res. 1903;10:367–401.
- Alter BP, Gilbert HS. The effect of hydroxyurea on hemoglobin F in patients with myeloproliferative syndromes. Blood. 1985;66(2):373–3799.
- Engström KG, Löfvenberg E. Treatment of myeloproliferative disorders with hydroxyurea: effects on red blood cell geometry and deformability. Blood. 1998;91(10):3986–3991. doi:https://doi.org/10.1182/blood.V91.10.3986.
- Davidson RJL, Hamilton PJ. High mean red cell volume: its incidence and significance in routine haematology. J Clin Pathol. 1978;31:493–498.
- Oh RC, Hitchcock K. How to evaluate macrocytosis without anemia? J Fam Practice. 2008;57(8):548–550.
- Seppä K, Laippala P, Saarni M. Macrocytosis as a consequence of alcohol abuse among patients in general practice. Alcohol Clin Exp Res. 1991;15(5):871–876. doi:https://doi.org/10.1111/j.1530-0277.1991.tb00615.x. PMID: 1755522.
- Arber DA, Orazi A, Hasserjian R, et al. The 2016 revision to the World Health Organization classification of myeloid neoplasms and acute leukemia. Blood. 2016;127(20):2391–2405.
- Johansson P, Safai-Kutti S, Kutti J. An elevated venous haemoglobin concentration cannot be used as a surrogate marker for absolute erythrocytosis: a study of patients with polycythaemia vera and apparent polycythaemia. Br J Haematol. 2005;129(5):701–705. doi:https://doi.org/10.1111/j.1365-2141.2005.05517.