
ABSTRACT
Purpose
Multiple myeloma (MM) is a haematological malignant disease with a clonal proliferation of plasma cells, and timely surveillance is helpful to improve the survival rate of patients with MM. However, there is a lack of simple and effective biomarkers for the diagnosis, prognosis, and residual disease evaluation of MM.
Material & Methods
In the detection cohort, we used the samples from six newly diagnosed MM patients and six control subjects. Plasma proteins were labelled with dimethyl reagents and enriched by lectin AANL6, then the deglycosylated peptides were identified by LC-MS/MS. Differentially expressed proteins were used for further exploration. In the validation cohort, we used 90 newly diagnosed patients with MM and 70 cases of unrelated diseases as controls. The diagnosis performance was analysed by ROC analysis using SPSS.
Results
In this study, we show, using lectin blots with AANL6, that glycosylation levels were higher in MM patients than in controls. After AANL6 enrichment, we detected 58 differentially expressed proteins using quantitative proteomics. We further validated one candidate Fibulin-1 (FBLN1). Using an Elisa assay, we showed that FBLN1 expression was increased in plasma of 90 cases of MM, and which was significantly correlated with DKK1 expression. ROC analysis showed that these two markers had a 95.7% specificity for determining the diagnosis of MM.
Conclusion
These data suggest that the MM cases display increased glycosylation after AANL6 enrichment and that the combined expression of FBLN1 and DKK1 can be used as an effective diagnostic biomarker.
Letter to editor
Multiple myeloma (MM) is a haematological malignant disease characterized by a clonal proliferation of plasma cells [Citation1] that secretes monoclonal immunoglobulin or fragment M proteins. The common clinical manifestations are bone destruction, anaemia, renal insufficiency, infection and hypercalcemia. The incidence and mortality of MM have increased worldwide in recent years, and the incidence of MM is 3–5% among people aged over 50 [Citation2,Citation3]. MM is still an incurable disease with poor prognosis, and the majority of MM patients will relapse eventually, but timely monitoring plays an important role in the improvement of survival rate in MM. In the clinic, the detection methods of imageological examination for myeloma-related diseases include traditional CT, MRI and PET-CT [Citation4], as well as bone marrow imaging, blood routine and biochemical tests [Citation5]. The 6-year overall survival (OS) has improved from 31% to 56% over 65 years and some patients can survive more than 10 years thanks to improved detection and treatment strategies of MM [Citation6,Citation7]. However, tumour burden is not accurately represented by the percentage of plasma cells in the bone marrow given the focal distribution of the disease. Bone marrow aspirates can also cause some discomfort and cannot be repeated ad libidum. Therefore, there is a need to find simple and effective biomarkers to improve diagnosis, MRD evaluation and progression in MM.
Previous reports have identified markers such as CD44 [Citation8] and C-terminal telopeptide of type I collagen (CTX-1) for MM have been found [Citation9]. The Dickkopf-related protein 1 (DKK1) can be used as a tumour marker in the diagnosis of MM [Citation10,Citation11]. Cavo et al. [Citation12] reported that using 18F-FDG PET/CT coupled with bone marrow-based techniques was helpful to detect minimal residual disease (MRD) of MM. Long et al. [Citation13] used nanoporous materials coupled MALDI-TOF MS to detect Bence-Jones proteins from urine for diagnosis of MM. In addition, the characterize circulating multiple myeloma cells (CMMC) from peripheral blood of MM patients would be used as a prognostic test for patients with plasma cell disorders [Citation14] and tumour DNA or novel immune biomarkers [Citation15]. However, due to the low sensitivity and specificity of these markers or the unsuitable detection, there are few indicators used for MM in the clinic and there is still a lack of effective and accurate markers for monitoring of MM.
Glycosylation is more sensitive for tumour diagnosis [Citation16]. Glycosylation changes in MM have also been reported in MM [Citation17], for example, immunoglobulin IgG have different N-glycosylation forms in plasma cell diseases [Citation18], the serum N-glycome may play a role in the monitoring of IgD multiple myeloma [Citation19], and the protein Mucin-1 has abnormal glycosylation in the early stage of MM [Citation20]. It was also found that changes in sialylation affected cell adhesion and migration due to higher expression of sialic transferase ST3GAL6 in MM [Citation21]. Tibullo et al. [Citation22] reported that the glycosylation of U266-R isincreased, and are higher concentration of UDP-N-acetylglucosamine (UDP-GlcNAc) for protein glycosylation, and the O-GlcNAc transferase (OGT) levels were higher in U266-R cells. GlcNAc modification is important in the development of cancer, but it is rarely reported in MM.
Lectin is widely used to enrich glycoconjugates carrying glycans and to identify the abnormal glycosylated proteins in tumours with mass spectrometry, which is a useful tool for cancer diagnosis and prognosis monitoring. In our previously reported, we identified a novel lectin AANL from Agrocybe aegerita that has a higher affinity than other lectins when binding with GlcNAc [Citation23,Citation24], and which has been used for early detection of non-small cell lung cancer [Citation16,Citation25]. Subsequently, AANL6, a mutant of AANL, was cloned and shown to have a higher affinity to terminal GlcNAc than AANL [Citation26]. Therefore, in this study, we used the lectin AANL6 for the enrichment of glycosylated peoteins from MM, and identified them using quantitative proteomics, in order to find a potential sensitive biomarker for diagnosis of MM.
The plasma samples and bone marrow samples were collected from Zhongnan Hospital of Wuhan University and First Affiliated Hospital of Xi’an Jiaotong University. The plasma and bone marrow samples from six newly diagnosed MM patients and six control subjects were collected and used for detection, in the validation cohort, we used 90 newly diagnosed patients with MM and 70 cases of unrelated diseases (such as iron deficiency anaemia, etc.) as controls. The information of collected samples were listed in and Supplemental information 1. The study was conducted in accordance with the Helsinki Declaration and approved by the Ethics Committee of Zhongnan Hospital at Wuhan University (Approval No. 2017066) and First Affiliated Hospital of Xi’an Jiaotong University. Written informed consent was received from all patients and normal subjects before inclusion in the study and information were collected from the electronic patient record.
Table 1. Characteristics of samples used in this study.
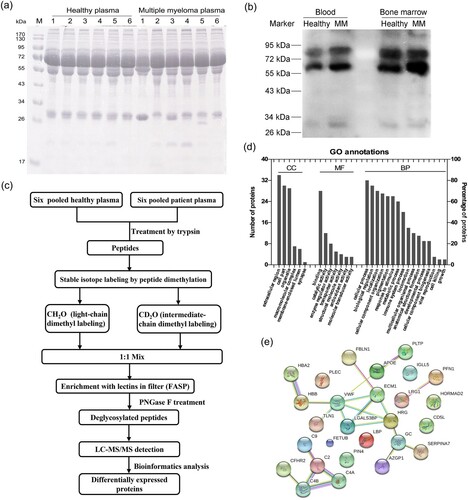
The protein bands contained in plasma samples from six MM patients and six control subjects were detected by SDS-PAGE, and differences between 36 and 55 kDa in gel were found in the plasma proteins of MM patients ((a)). Lectin-blot detection showed that the positive protein bands enriched by AANL6 were increased in both the blood and the bone marrow of MM patients compared to controls ((b)), which indicated that glycosylation levels in MM were higher than the controls. We used the lectin AANL6 to enrich the dimethyl labelled glycopeptide in an ultrafiltration tube, and detected the deglycosylated peptides using LC-MS/MS. The workflow of samples preparation was shown in (c). There were 160 proteins identified by LC-MS/MS, of which a total of 58 differentially expressed proteins (DEPs) were identified by data analysis (Supplemental information 1). There were 21 up-regulated proteins with a fold changed (FC) greater than 1.5, and 37 downregulated proteins with a FC less than 0.67. These DEPs were mainly involved in binding, cellular processes, and biological regulation, localization, and immune response as suggested by GO annotation ((d)).
Figure 1. Changes of glycosylation modification in MM patients, and identification of the differentially expressed proteins with quantitative proteomics. (a) 12% SDS-PAGE was used to detect the protein expression in plasma of controls and MM patients. (b) The changes of glycosylation levels in peripheral blood and bone marrow were detected by lectin-blot. The membrane was incubated with AANL6 (0.5 μg/mL) at RT for 1 h, and washed with 0.3% TBST for six times, then the membrane was probed with rabbit polyclonal antibodies against AANL6 (1:10000) at RT for 1 h. (c) Workflow of identification by LC-MS/MS. The proteins from 6 mixed plasma samples of control subjects and 6 mixed plasma samples of MM patients were treated via precipitation, resuspension, reduction in 10 mM DTT and alkylated by 40 mM iodoacetamide, and finally digested and digested with 2 μg/μL trypsin (Mass spectrometry grade, Promega) for overnight, respectively. 2 mg of the desalted peptides from the control subjects and the MM patients were labelled with dimethyl reagents, and mixed. The labelled peptides were incubated with AANL6 for 3.5 h, the lectin-bound glycosylated peptides were digested with PNGase F for 2.5 h at 37°C. Finally, the deglycosylated peptides were collected and desalted, then dried for LC-MS/MS with a quadrupole TOF LC-MS/MS mass spectrometer (Triple TOF 5600, AB Sciex Instruments). (d) The differentially expressed proteins were analysed by GO annotation using BGI WEGO website (http://wego.genomics.org.cn). CC, cellular component; MF, molecular function; BP, biological process. (e) Protein–protein interaction network was analysed using STRING v9.1 (https://string-db.org/cgi/input.pl).
To determine whether these DEPs were artefacts or MM-related, we selected Fibulin-1 (FBLN1) for further validation. Fibulin-1 (FBLN1) is a secreted glycoprotein with 703 amino acids and a molecular weight of about 70 kDa. It was showed that the expression of FBLN1 was up-regulated in the plasma of MM patients compared to the control group in our MS detection (Supplementary information 1). It has been reported that the mRNA level of FBLN1 in MM cells and the protein expression in serum of MM patients are significantly increased, and FBLN1 was involved in the growth, invasion and migration of myeloma [Citation27], which is consistent with our data. The interaction between FBLN1 protein and other DEPs was analysed by STRING software as shown in (e), which found that FBLN1 could mainly interact with extracellular matrix protein 1 (ECM1). In addition, in our result, seven peptides from FBLN1 were enriched by the lectin AANL6 (), only the peptide CATPHGDN98ASLEATFVKR contain the N-glycosylation consensus sequence ‘N-X-S/T/C’, which has been reported in UniProt dataset (https://www.uniprot.org/uniprot/P23142). The peptide, DSSCGTGYELTEDN258SCK, this site was not reported in UniProt, but it contains the non-canonical sequences N-X-C motif [Citation28], which will be a novel glycosylation site that enriched by AANL in this study, and the detailed structural data will need to be identified by HCD/ETD techniques.
Table 2. Identification of 7 peptides with 99% confidence in FBLN1 by LC-MS/MS.
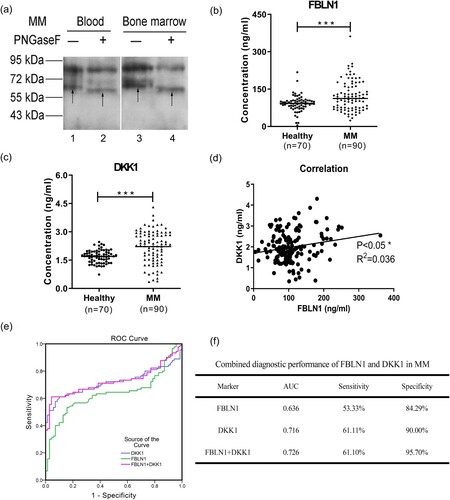
The N-linked glycosylation modifications of the FBLN1 in the blood and bone marrow of the MM patients were detected by Western blot. After the PNGase F treatment, the band of protein FBLN1 was moved down as shown by the arrows in (a), which indicated that FBLN1 was a N-linked glycoprotein. Elisa assays were performed and showed that the expression of FBLN1 was increased in plasma of 90 patients with MM ((b)), which was consistent with the results of proteomics by MS detection. Dickkopf-related protein 1 (DKK1) is a secretory glycoprotein and overexpressed in myeloma cells, and could as a biomarker for diagnosis and prognosis monitoring of MM [Citation10]. In this study, we also detected the expression of DKK1 and found the expression level of DKK1 was increased in plasma from MM patients ((c)). It was further found that the expression of FBLN1 was significantly positively correlated with the expression of DKK1 ((d)). The proteins FBLN1 and DKK1 were combined for differing MM patients from controls, which found that the area under the curve (AUC) value was 0.726 and the specificity was increased to 95.70%, and had better performance than alone ((e,f)). In addition, we have found the factors affecting the DKK1 and FBLN1 expressions by correlation analysis using SPSS, and the results are shown in Supplemental information 2.
Figure 2. The expression levels, correlation analysis, and ROC analysis of FBLN1 and DKK1 in plasma of MM patients. (a) N-linked glycosylation of FBLN1 was detected by western blot after PNGase F treatment. The samples were treated with denaturation buffer and boiled at 100°C for 10 min for denaturation, and then returned to RT. The denatured proteins were reacted directly with 500 U PNGase F (New England BioLabs) in the reaction buffer at 37°C for 2 h. Subsequently, the deglycosylated proteins were analysed by western blot and the membranes were incubated with anti-FBLN1 (1:150, No: MAC472Hu22) antibodies. Lane 1, 3 represents the band of FBLN1 as arrows shown. Lane 2, 4 represents the deglycosylated band of FBLN1 as arrows shown. (b) Detection of the expression of FBLN1, and the data statistics were analysed using GraphPad Prism (version6.0). (c) Detection of the expression of DKK1. (d) The correlation analysis of FBLN1 and DKK1 in plasma of MM patients using Graphpad Prism. (e) ROC curve and AUC analysis was constructed with IBM SPSS statistics (version 19.0) software. The new probability is calculated by binary logic regression for combination diagnosis analysis. (f) Combination of FBLN1 and DKK1 for diagnosis of MM. p < 0.05 is considered as significant differences in all statistical comparisons.
In conclusion, we show for the first time an increased GlcNAcylation in the BM of MM patients, which will provide more guide for glycosylation of MM. Furthermore, we show that combined FBLN1 and DKK1 expression can be used as a novel clinical biomarker for the diagnosis of MM. The sensitive detection indexes selected in this study will provide a scientific basis for clinical diagnosis and prognosis monitoring of MM.
Supplemental Material
Download MS Word (17 KB)Supplemental Material
Download MS Excel (40.9 KB)Acknowledgments
We thank Professor Hui Sun for providing the lectin AANL6, and thank the staff at the Department of Hematology at Zhongnan Hospital for samples collection.
Disclosure statement
The authors declare no conflicts of interest related to this study.
Data availability
All datasets generated for this study are included in the manuscript and/or the supplementary files. The mass spectrometry proteomics data have been deposited to the ProteomeXchange Consortium via the PRIDE partner repository with the dataset identifier PXD027111 (Username: [email protected]; Password: J9lmPWLJ).
Additional information
Funding
References
- Egan PA, Elder PT, Deighan WI, et al. Multiple myeloma with central nervous system relapse. Haematologica. 2020;105(7):1780–1790.
- Gerecke C, Fuhrmann S, Strifler S, et al. The diagnosis and treatment of multiple myeloma. Deutsches Arzteblatt International. 2016;113(27-28):470), -+.
- Fraz MA, Warraich FH, Warraich SU, et al. Special considerations for the treatment of multiple myeloma according to advanced age, comorbidities, frailty and organ dysfunction. Crit Rev Oncol Hematol. 2019;137:18–26.
- Zamagni E, Tacchetti P, Cavo M. Imaging in multiple myeloma: How? When? Blood. 2019;133(7):644–651.
- Landgren O, Rajkumar SV. New developments in diagnosis, prognosis, and assessment of response in multiple myeloma. Clin Cancer Res. 2016;22(22):5428–5433.
- Kumar SK, Dispenzieri A, Lacy MQ, et al. Continued improvement in survival in multiple myeloma: changes in early mortality and outcomes in older patients. Leukemia. 2014;28(5):1122–1128.
- Smith D, Yong K. Advances in understanding prognosis in myeloma. Br J Haematol. 2016;175(3):367–380.
- Harshman SW, Canella A, Ciarlariello PD, et al. Proteomic characterization of circulating extracellular vesicles identifies novel serum myeloma associated markers. J Proteomics. 2016;136:89–98.
- Ting KR, Brady JJ, Hameed A, et al. Clinical utility of C-terminal telopeptide of type 1 collagen in multiple myeloma. Br J Haematol. 2016;173(1):82–88.
- Mabille C, Ruyssen-Witrand A, Degboe Y, et al. DKK1 and sclerostin are early markers of relapse in multiple myeloma. Bone. 2018;113:114–117.
- Feng YF, Zhang YX, Wei XF, et al. Correlations of DKK1 with pathogenesis and prognosis of human multiple myeloma. Cancer Biomark. 2019;24(2):195–201.
- Cavo M, Terpos E, Nanni C, et al. Role of F-18-FDG PET/CT in the diagnosis and management of multiple myeloma and other plasma cell disorders: a consensus statement by the International myeloma working group. Lancet Oncology. 2017;18(4):E206–E217.
- Long SP, Qin Q, Wang YN, et al. Nanoporous silica coupled MALDI-TOF MS detection of Bence-Jones proteins in human urine for diagnosis of multiple myeloma. Talanta. 2019;200:288–292.
- Foulk B, Schaffer M, Gross S, et al. Enumeration and characterization of circulating multiple myeloma cells in patients with plasma cell disorders. Br J Haematol. 2018;180(1):71–81.
- Levin A, Hari P, Dhakal B. Novel biomarkers in multiple myeloma. Transl Res. 2018;201:49–59.
- Jin Y, Wang J, Ye X, et al. Identification of GlcNAcylated alpha-1-antichymotrypsin as an early biomarker in human non-small-cell lung cancer by quantitative proteomic analysis with two lectins. Br J Cancer. 2016;114(5):532–544.
- Zhang Z, Westhrin M, Bondt A, et al. Serum protein N-glycosylation changes in multiple myeloma. Biochim Biophys Acta Gen Subj. 2019;1863(5):960–970.
- Mittermayr S, Le GN, Clarke C, et al. Polyclonal immunoglobulin G N-glycosylation in the pathogenesis of plasma cell disorders. J Proteome Res. 2017;16(2):748–762.
- Chen J, Fang M, Chen X, et al. N-glycosylation of serum proteins for the assessment of patients with IgD multiple myeloma. BMC Cancer. 2017;17(1):881.
- Andrulis M, Ellert E, Mandel U, et al. Expression of mucin-1 in multiple myeloma and its precursors: correlation with glycosylation and subcellular localization. Histopathology. 2014;64(6):799–806.
- Glavey SV, Manier S, Natoni A, et al. The sialyltransferase ST3GAL6 influences homing and survival in multiple myeloma. Blood. 2014;124(11):1765–1776.
- Tibullo D, Giallongo C, Romano A, et al. Mitochondrial functions, energy metabolism and protein glycosylation are interconnected processes mediating resistance to bortezomib in multiple myeloma cells. Biomolecules. 2020;10(5):696.
- Jiang S, Chen Y, Wang M, et al. A novel lectin from Agrocybe aegerita shows high binding selectivity for terminal N-acetylglucosamine. Biochem J. 2012;443(2):369–378.
- Liu W, Han G, Yin Y, et al. AANL (Agrocybe aegerita lectin 2) is a new facile tool to probe for O-GlcNAcylation. Glycobiology. 2018;28(6):363–373.
- Jin Y, Yang Y, Su Y, et al. Identification a novel clinical biomarker in early diagnosis of human non-small cell lung cancer. Glycoconj J. 2019;36(1):57–68.
- Su Y, Ye X, Xu B, et al. CBS homogenization mutation strategy narrows the glycan binding profile of a GlcNAc-specific lectin AANL. Glycobiology. 2020;30(3):159–173.
- Khan R, Gupta N, Kumar R, et al. Augmented expression of urokinase plasminogen activator and extracellular matrix proteins associates with multiple myeloma progression. Clin Exp Metastasis. 2014;31(5):585–593.
- Lowenthal MS, Davis KS, Formolo T, et al. Identification of novel N-glycosylation sites at noncanonical protein consensus motifs. J Proteome Res. 2016;15(7):2087–2101.