
ABSTRACT
Objective:
SET domain containing protein 2 (SETD2) involves in the progression and development of chemotherapy resistance in acute myeloid leukemia (AML). Hence, this study aimed to investigate the relationship of SETD2 expression with disease risk, features, treatment response, and survival profile in AML.
Methods:
One-hundred and sixty primary AML patients were retrospectively analyzed. Their bone marrow (BM) samples before and after induction therapy were retrieved for SETD2 detection by RT-qPCR. Moreover, SETD2 expression in BM samples of 20 disease controls (DCs) were also determined.
Results:
SETD2 expression was downregulated in AML patients compared to DCs (P < 0.001). Higher SETD2 expression related to white blood cells ≤10 × 109/L despite not reaching statistical significance (P = 0.062). One-hundred and nineteen (74.4%) AML patients achieved complete response (CR), while the remaining 41 (25.6%) did not achieve that. Furthermore, increased SETD2 expression was associated with CR achievement (P = 0.015). Survival analyses displayed that SETD2 high (vs. low) was related to prolonged event-free survival (EFS) (P = 0.001) and overall survival (OS) (P = 0.021). Moreover, increased SETD2 quartile was correlated with favorable EFS (P = 0.004) and OS (P = 0.042). After adjustment using multivariate Cox’s regression analysis, higher SETD2 quartile was independently related to prolonged EFS [hazard ratio (HR): 0.766, P = 0.013] and OS (HR: 0.669, P = 0.013). It was also noticed that SETD2 expression was elevated during the induction therapy (P < 0.001).
Conclusion:
Detection of SETD2 may assist in estimating treatment response and survival profile in AML patients.
Introduction
Acute myeloid leukemia (AML) represents a common hematological malignancy featured by the proliferation of undifferentiated myeloid blasts [Citation1, Citation2]. The incidence and mortality of AML are both increasing globally, addressing the enormous global burden of this disease [Citation3, Citation4]. With the intensive application of chemotherapeutic agents (such as cytarabine plus daunorubicin or idarubicin) as induction therapy, around 80% of de novo AML patients are able to achieve complete response (CR) [Citation5–7]. However, it is estimated 30% of AML patients may develop relapse even after reaching CR during the induction therapy within one year [Citation8–10]. Therefore, identifying some potential biomarkers to estimate the treatment response in AML patients to further improve the overall AML management is necessary.
SET domain containing protein 2 (SETD2), a histone methyltransferase of H3K36, promotes DNA repair via methylation of H3K36 under DNA double-strand break [Citation11]. Recent studies show that SETD2 is involved in the initiation and progression of several hematological malignancies [Citation12, Citation13]. For instance, SETD2 knockout mice exhibit a reduced number of hematopoietic stem and progenitor cells (HSPCs) with increased apoptosis potency [Citation12]. However, another study reports that SETD2 deletion impairs the differentiation and self-renewal of HSPCs, leading to the malignant transformation toward myelodysplastic syndrome [Citation13]. Furthermore, reduced SETD2 is also implied in the development of chemotherapy resistance in leukemia [Citation14, Citation15]. Given that SETD2 plays such a critical role in leukemia, it is reasonable to hypothesize that SETD2 may also exhibit certain clinical value in AML patients, while the relevant study is limited.
Hence, this study detected the SETD2 expression from bone marrow (BM) samples at diagnostic biopsy and after induction therapy in AML patients, aiming to investigate the relationship of SETD2 expression with disease risk, features, treatment response, and survival profile in AML, which might add some evidence for assisting in the improvement of AML management.
Methods
Patients
After the approval from the ethics committee with an approval number of 2021-KY-11-002, this retrospective study analyzed 160 primary AML patients treated between July 2016 and September 2020. The inclusion criteria contained: (1) diagnosed as primary AML referring to the World Health Organization (WHO) classification Guideline [Citation16]; (2) aged more than 18 years old; (3) had available data for analysis; (4) had cryopreserved BM, which were collected before induction therapy. The exclusion criteria contained: (1) relapsed or refractory AML; (2) had BM failure syndromes; (3) complicated with other hematologic malignancy disease malignancy or cancers. Besides, twenty patients with non-proliferative hematologic malignancies who received BM examinations were enrolled as disease controls (DCs). All the surviving patients and the family members of deceased patients signed the informed consent.
Clinical data and specimen collection
Clinical characteristics (including demographic characteristics, French-American-British (FAB) classification, cytogenetic abnormalities, molecular aberrations, biochemical information, and risk stratification) of AML patients were gained correspondingly. Beyond that, cryopreserved BM samples of AML patients at diagnostic biopsy as well as BM samples of some AML patients (n = 95) after induction therapy were collected; meanwhile, BM samples of DCs were also obtained.
Specimen processing
After collection, BM samples from all subjects were used to detect SETD2 expression by two-step reverse transcription-quantitative polymerase chain reaction (RT-qPCR) assay. The kits used were as follows: TRIzol™ Reagent (No. Cat. 15596026, Invitrogen™, Carlsbad, California, America) was used for total RNA isolation; PrimeScript™ RT reagent Kit (No. Cat. RR037A, Takara, Shanghai, China) was used for cDNA synthesis; SYBR® Premix DimerEraser™ (No. Cat. RR091A, Takara, Shanghai, China) was used for cDNA amplification. The thermocycling condition was 1 cycle of 95°C for 60 sec, 40 cycles of 95°C for 15 sec, and 60°C for 60 sec. The 2−ΔΔCt method was used for calculation and GAPDH was used as an internal reference. Primers were designed in accordance with a previous study: SETD2, 5′-TCA CAA GGC AGA CTC AGT GG-3′ (sense) and 5′-CTG CTG TCT TGG GCT TTT TC-3′ (antisense); GAPDH, 5′-CAG CCT CAA GAT CAT CAG CA-3′ (sense) and 5′-GGT GCT AAG CAG TTG GTG GT-3′ (antisense) [Citation17].
Treatment and assessment
The AML patients received induction therapy with cytarabine plus daunorubicin (DA) or cytarabine plus idarubicin (IA) regimens per the National Comprehensive Cancer Network (NCCN) Guideline [Citation18]. Based on the treatment response information which was evaluated between the 21st day and 28th day after induction therapy began, CR was assessed [Citation19]. Based on follow-up data, event-free survival (EFS) and overall survival (OS) were imputed. The last date of follow-up was 28 May 2022. EFS was calculated from the induction therapy beginning to treatment failure (failure to respond), disease relapse, or death. OS was calculated from the induction therapy beginning to death.
Statistics
Statistical analysis and charting graphics were accomplished by SPSS 24.0 (IBM Corp., America) and GraphPad Prism 9.0 (GraphPad Software Inc., America), respectively. The Wilcoxon rank sum test and Chi-Square test were applied for comparison analysis; meanwhile, Spearman’s rank correlation test was used for association analysis. Kaplan-Meier (KM) curves with log-rank test or Breslow test were utilized to display the EFS and OS of AML patients. Wilcoxon signed-rank test was used to compare the difference in SETD2 expression before and after therapy. Moreover, forward-stepwise, backward-stepwise, and enter multivariate Cox’s regression analyses were utilized for evaluating the factors related to the EFS or OS among AML patients. The P value < 0.05 was considered statistically significant.
Results
AML patients’ features
The mean age of AML patients was 59.9 ± 12.2 years (). Moreover, there were 61 (38.1%) females and 99 (61.9%) males. The median [interquartile range (IQR)] values of white blood cell (WBC) and bone marrow (BM) blasts were 13.8 (7.8–24.3) × 109/L and 70.0% (58.3%-79.8%), separately. Regarding FAB classification, 16 (10.0%), 36 (22.5%), 44 (27.5%), 54 (33.8%), and 10 (6.2%) patients were classified as M1, M2, M4, M5, and M6, respectively. Furthermore, there were 34 (21.3%), 82 (51.2%), and 44 (27.5%) patients were categorized into favorable risk, intermediate risk, and poor risk, respectively. The detailed features of AML patients were displayed in .
Table 1. Patients’ characteristics.
Expression of SETD2 between AML patients and DCs
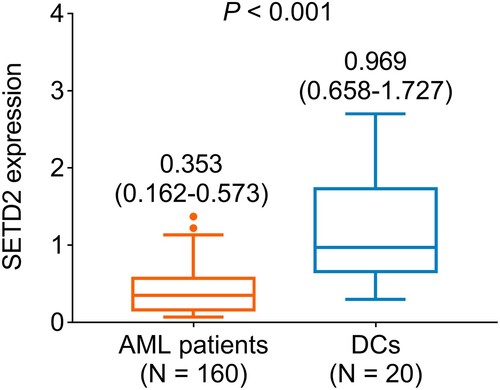
The median SETD2 expression in AML patients was 0.353 (IQR: 0.162–0.573) (). Moreover, the median SETD2 expression in DCs was 0.969 (IQR: 0.658–1.727). By comparison, SETD2 expression was downregulated in AML patients compared to DCs (P < 0.001).
Figure 1. SETD2 expression was reduced in AML patients compared to DCs.
Relationship between SETD2 expression and clinical features in AML patients
The clinical features were converted into categorized variables, and then it was observed that SETD2 did not relate to any categorized clinical features (including age, gender, WBC count, BM blasts, FAB classification, cytogenetics, FLT3-ITD mutation, isolated biallelic CEBPA mutation, NPM1 mutation, WT1 mutation, and risk stratification) in AML patients (all P > 0.05) (). It was noticed that higher SETD2 expression correlated with WBC ≤10 × 109/L despite not reaching statistical significance (P = 0.062). Moreover, SETD2 expression did not relate to BM blasts (continuous variable) in AML patients (r = −0.091, P = 0.251) (Supplementary Figure 1).
Table 2. Correlation of SETD2 expression with clinical features in AML patients.
Association of SETD2 expression with treatment response in AML patients
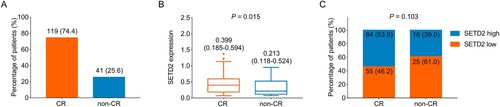
Among 160 primary AML patients treated with IA or DA regimens as induction therapy, 119 (74.4%) of them achieved CR, while the remaining 41 (25.6%) did not achieve ((A)). Moreover, elevated SETD2 expression was related to CR achievement in AML patients (P = 0.015, (B)). Furthermore, SETD2 high correlated with CR achievement although no statistical threshold was reached (P = 0.103, (C)).
Figure 2. Higher SETD2 expression was related to a better induction therapy response in AML patients. Presentation of CR rate in AML patients (A). Comparison of SETD2 expression between AML patients with CR and AML patients without CR (B). Correlation of SETD2 high with CR achievement in AML patients (C).
Association of SETD2 expression with survival profile in AML patients
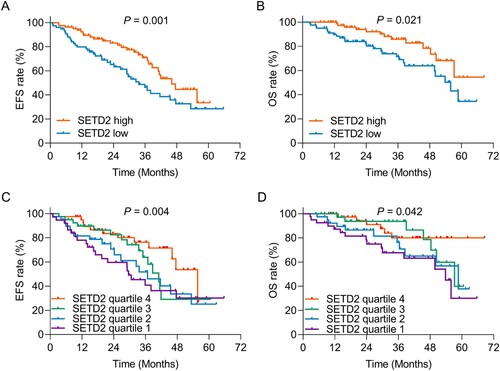
SETD2 high (vs. low) was related to prolonged EFS (P = 0.001, (A)) and OS (P = 0.021, (B)) in AML patients. Further analyses divided SETD2 expression into four quartiles and disclosed that increased SETD2 quartile was correlated to favorable EFS (P = 0.004, (C)) and OS (P = 0.042, (D)).
Figure 3. SETD2 high (vs. low) and increased SETD2 quartile were related to favorable survival profile in AML patients. Correlation of SETD2 high (vs. low) with EFS (A) and OS (B) in AML patients. Association of SETD2 quartile with EFS (C) and OS (D) in AML patients.
Forward multivariate Cox’s regression analyses observed that a higher SETD2 quartile was independently related to prolonged EFS [hazard ratio (HR): 0.766, P = 0.013] and OS (HR: 0.669, P = 0.013) (). Moreover, WBC (>10 × 109/L vs. ≤ 10 × 109/L) (HR: 2.585, P = 0.003) and FLT3-ITD mutation (yes vs. no) (HR: 1.955, P = 0.009) were both independently correlated to shorter EFS, while isolated biallelic CEBPA mutation (yes vs. no) (HR: 0.330, P = 0.013) could serve as an independent factor for estimating favorable EFS. Besides, isolated biallelic CEBPA mutation (yes vs. no) (HR: 0.184, P = 0.022) was independently related to prolonged OS, while poorer risk stratification (HR: 2.857, P < 0.001) was independently associated with shorter OS ().
Table 3. Forward multivariate Cox’s proportional hazards regression analysis for EFS and OS.
Furthermore, backward stepwise and enter multivariate Cox’s regression analyses were conducted for identifying the potential factors relating to EFS as well. Then it was discovered that a higher SETD2 quartile was independently related to prolonged EFS in backward stepwise multivariate Cox’s regression (HR: 0.774, P = 0.027) as well as in enter multivariate Cox’s regression (HR: 0.731, P = 0.015) (Supplementary Table 1).
Longitudinal change of SETD2 expression in AML patients
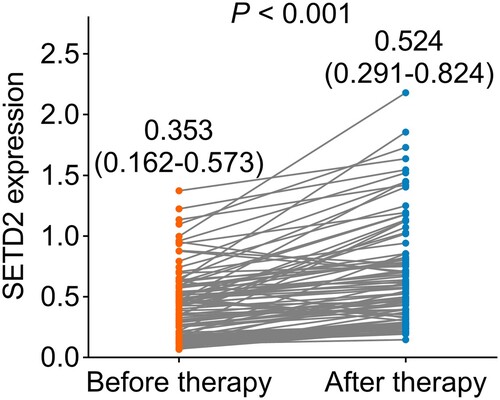
The median SETD2 expression before induction therapy was 0.353 (IQR: 0.162–0.573) (). While after therapy, the median SETD2 expression was 0.524 (IQR: 0.291–0.824). By comparison, there was an increase in SETD2 during the induction therapy (P < 0.001).
Figure 4. SETD2 expression was elevated during the induction therapy in AML patients.
Discussion
Although sufficient evidence suggests that SETD2 plays a critical role in hematological malignancies based on in vitro and in vivo studies, its clinical role is rarely reported [Citation12, Citation13, Citation20, Citation21]. In order to fulfill this gap, the current study determined the expression of SETD2 in BM samples of AML patients by RT-qPCR assay. Then, it was observed that SETD2 expression was reduced in AML patients compared to DCs, which could be explained as that: SETD2 mediated several oncogenic pathways (such as nuclear factor (NF)-κB pathway and c-Jun N-terminal kinase (JNK) pathway) to suppress the proliferation and self-renewal of HSPCs, where the later one served as a hallmark of AML, thus SETD2 was reduced in AML patients [Citation20, Citation22, Citation23]. Moreover, the association between SETD2 expression and clinical features was also determined in the current study. Surprisingly, SETD2 expression did not correlate to any clinical features of AML patients except that a weak relationship between higher SETD2 expression and less WBC count was observed (no statistical significance). The possible reason to explain these findings was that: SETD2 might be implicated in the regulation of the hematopoietic process through mediating the survival and differentiation of HSPCs, therefore it seemed to relate to less WBC count in AML patients; however further studies with a larger sample size were needed to further validate our findings [Citation20, Citation24, Citation25].
SETD2 is previously reported in the regulation of acquiring chemotherapy resistance in leukemia [Citation14, Citation15, Citation21]. For instance, SETD2 deletion impairs the DNA damage response (DDR) pathway and further inhibits apoptosis of leukemia cells under cytotoxic chemotherapy (including cytarabine and doxorubicin) [Citation21]. Moreover, SETD2 loss causes resistance to cytarabine-based chemotherapy via downregulating cell cycle pathways and dysregulating cell cycle checkpoints in AML [Citation14]. Furthermore, SETD2 knockout mice develop resistance to doxorubicin plus cytarabine therapy in AML due to the specific molecular profile of c-Kit+ B220+ Mac-1+ cells [Citation15]. However, the correlation of SETD2 expression with treatment response to chemotherapy in AML patients is still undetermined. Thus, the current study explored the relationship of SETD2 expression with treatment response and its longitudinal change during induction therapy in AML patients. Then, it was discovered that higher SETD2 expression was related to CR achievement in AML patients, which could be explained as that: SETD2 deficiency was related to the development of chemotherapy resistance through regulating the DDR pathway and cell cycle pathway; therefore, its higher level was correlated with a response to chemotherapy in AML patients [Citation14, Citation21]. Also, one interesting finding in the current study was the elevation of SETD2 expression during induction therapy in AML patients. Taken together, elevated SETD2 was related to CR achievement in AML patients.
One previous study reports that increased SETD2 expression is related to longer survival in patients with myelodysplastic syndrome [Citation20]. However, the online database Gene Expression Profiling Interactive Analysis (GEPIA) (http://gepia.cancer-pku.cn/detail.php) reveals that SETD2 expression does not relate to OS in AML patients. In the current study, it was observed that upregulated SETD2 was related to favorable survival in AML patients. Moreover, multivariate Cox's analysis indicated that higher SETD2 quartile could independently estimate longer EFS and OS in AML patients. These findings could be explained as that: (a) SETD2 was related to CR achievement during induction therapy, which further declined the chance of detectable residues in the BM of AML patients and improved their survival [Citation26, Citation27] (b) SETD2 might decline the chance of infection-related death in AML patients indirectly through elevating the number of terminally differentiated granulocyte and prolonged their survival [Citation24, Citation25, Citation28]. Moreover, our finding was not in line with results from GEPIA online database, and this could be owing to the difference in sample size and detection methods (RT-qPCR assay vs. RNA-sequencing), unrevealed subsequent treatment information, and unverified patient type (primary or relapse).
Several limitations existed in the current study. Firstly, further study could classify AML patients based on the International Consensus Classification (ICC) criteria [Citation29], and further explored the clinical value of SETD2 in AML patients. Secondly, the sample size of the current study was limited, thus further study with a larger sample size to explore the relationship between SETD2 with clinical features in AML patients was necessary. Finally, SETD2 expression in leukemia cells could be determined in the further study by separation of leukemia cells from BM samples in AML patients.
In conclusion, SETD2 detection reveals response to induction therapy and survival profile in AML patients, while further validation is needed.
Author’s contribution
Hui Liu designed the study, collected, analyzed the data, drafted and reviewed the manuscript. Hui Liu read and approved the final manuscript.
Supplemental Material
Download TIFF Image (840.8 KB)Supplemental Material
Download MS Word (20.4 KB)Disclosure statement
No potential conflict of interest was reported by the author(s).
Additional information
Funding
References
- Newell LF, Cook RJ. Advances in acute myeloid leukemia. Br Med J. 2021;375:n2026.
- Pelcovits A, Niroula R. Acute myeloid leukemia: a review. R I Med J. 2020;103(3):38–40.
- Shallis RM, Wang R, Davidoff A, et al. Epidemiology of acute myeloid leukemia: recent progress and enduring challenges. Blood Rev. 2019;36:70–87.
- Yi M, Li A, Zhou L, et al. The global burden and attributable risk factor analysis of acute myeloid leukemia in 195 countries and territories from 1990 to 2017: estimates based on the global burden of disease study 2017. J Hematol Oncol. 2020;13(1):72.
- Liu H. Emerging agents and regimens for AML. J Hematol Oncol. 2021;14(1):49.
- Estey EH. Acute myeloid leukemia: 2021. Update on risk-stratification and management. Am J Hematol. 2020;95(11):1368–1398.
- Omri H E, Taha RY, Elomri A, et al. Acute myeloid leukemia in Qatar (2010-2016): clinical, biological, and prognostic factors and treatment outcomes. Front Genet. 2020;11:553.
- Thol F, Ganser A. Treatment of relapsed acute myeloid leukemia. Curr Treat Options Oncol. 2020;21(8):66.
- Vosberg S, Greif PA. Clonal evolution of acute myeloid leukemia from diagnosis to relapse. Genes Chromosomes Cancer. 2019;58(12):839–849.
- Kadia TM, Reville PK, Borthakur G, et al. Venetoclax plus intensive chemotherapy with cladribine, idarubicin, and cytarabine in patients with newly diagnosed acute myeloid leukaemia or high-risk myelodysplastic syndrome: a cohort from a single-centre, single-arm, phase 2 trial. Lancet Haematol. 2021;5(8):e552–e561.
- Ui A, Chiba N, Yasui A. Relationship among DNA double-strand break (DSB), DSB repair, and transcription prevents genome instability and cancer. Cancer Sci. 2020;111(5):1443–1451.
- Zhou Y, Yan X, Feng X, et al. Setd2 regulates quiescence and differentiation of adult hematopoietic stem cells by restricting RNA polymerase II elongation. Haematologica. 2018;103(7):1110–1123.
- Zhang YL, Sun JW, Xie YY, et al. Setd2 deficiency impairs hematopoietic stem cell self-renewal and causes malignant transformation. Cell Res. 2018;28(4):476–490.
- Dong Y, Zhao X, Feng X, et al. SETD2 mutations confer chemoresistance in acute myeloid leukemia partly through altered cell cycle checkpoints. Leukemia. 2019;33(11):2585–2598.
- Song J, Du L, Liu P, et al. Intra-heterogeneity in transcription and chemoresistant property of leukemia-initiating cells in murine Setd2(-/-) acute myeloid leukemia. Cancer Commun (Lond). 2021;41(9):867–888.
- Arber DA, Orazi A, Hasserjian R, et al. The 2016 revision to the World Health Organization classification of myeloid neoplasms and acute leukemia. Blood. 2016;127(20):2391–2405.
- Park JS, Pierorazio PM, Lee JH, et al. Gene expression analysis of aggressive clinical T1 stage clear cell renal cell carcinoma for identifying potential diagnostic and prognostic biomarkers. Cancers (Basel). 2020;12(1).
- NCCN Clinical Practice Guidelines in Oncology (NCCN Guidelines®) Acute Myeloid Leukemia Version 2.2013. 2013.
- Dohner H, Estey EH, Amadori S, et al. Diagnosis and management of acute myeloid leukemia in adults: recommendations from an international expert panel, on behalf of the European LeukemiaNet. Blood. 2010;115(3):453–474.
- Chen BY, Song J, Hu CL, et al. SETD2 deficiency accelerates MDS-associated leukemogenesis via S100a9 in NHD13 mice and predicts poor prognosis in MDS. Blood. 2020;135(25):2271–2285.
- Mar BG, Chu SH, Kahn JD, et al. SETD2 alterations impair DNA damage recognition and lead to resistance to chemotherapy in leukemia. Blood. 2017;130(24):2631–2641.
- Yamashita M, Dellorusso PV, Olson OC, et al. Dysregulated haematopoietic stem cell behaviour in myeloid leukaemogenesis. Nat Rev Cancer. 2020;20(7):365–382.
- Elgarten CW, Aplenc R. Pediatric acute myeloid leukemia: updates on biology, risk stratification, and therapy. Curr Opin Pediatr. 2020;32(1):57–66.
- Skucha A, Ebner J, Grebien F. Roles of SETD2 in leukemia-transcription, DNA-damage, and beyond. Int J Mol Sci. 2019;20(5).
- Logan C, Koura D, Taplitz R. Updates in infection risk and management in acute leukemia. Hematology Am Soc Hematol Educ Program. 2020;2020(1):135–139.
- Hasserjian RP, Steensma DP, Graubert TA, et al. Clonal hematopoiesis and measurable residual disease assessment in acute myeloid leukemia. Blood. 2020;135(20):1729–1738.
- Aitken MJL, Ravandi F, Patel KP, et al. Prognostic and therapeutic implications of measurable residual disease in acute myeloid leukemia. J Hematol Oncol. 2021;14(1):137.
- Liew PX, Kubes P. The neutrophil's role during health and disease. Physiol Rev. 2019;99(2):1223–1248.
- Arber DA, Orazi A, Hasserjian RP, et al. International consensus classification of myeloid neoplasms and acute leukemias: integrating morphologic, clinical, and genomic data. Blood. 2022;140(11):1200–1228.