
ABSTRACT
Objectives
Acute myeloid leukemia (AML) often presents with abnormal blood cell counts and gene mutations at diagnosis. But, the correlation between blood cell counts and gene mutations and the clinical effects on AML is unclear.
Methods
279 AML patients with FMS-like tyrosine kinase 3(FLT3) mutations were selected. Patients with FLT3 mutations were counted by PCR amplification products direct sequencing and second-generation sequencing (NGS), and blood cell counts at the time of initial diagnosis. The relapse-free survival (RFS) and overall survival (OS) and the influence of the clinical characteristics of patients on the prognosis in different groups were analyzed.
Results
The median of platelet (PLT) count was higher in the TET2 non-mutation group than mutation group and higher in the IDH1/2 mutation group than non-mutation group. The median of white blood cell (WBC) count was reduced in the poor prognosis group. The differences in levels of WBC and PLT count varied among the four groups binding sequence (JM-B), switching sequence (JM-S), zipper sequence (JM-Z), and high chain region (JM-H). The differences in PLT count varied between the insertion length ≥39 bp and <39 bp, and between ≥ 50 bp and <50 bp; The OS and RFS in 10 < WBC (×109/L) < 100 group and in the 30 ≤ PLT (×109/L)<80 group were better.
Conclusions
In AML patients with FLT3 mutations, the location of FLT3 mutations and the type of co-mutated genes may be correlated with blood cell counts, and different blood cell counts may have an impact on the prognosis.
KEYWORDS:
1. Introduction
Acute myeloid leukemia (AML) is a class of malignant clonal diseases caused by pathological proliferation and abnormal differentiation of hematopoietic stem cells, often accompanied by various types of genetic mutations, such as FLT3 mutations. FLT3 is a member of the type III receptor tyrosine kinase family [Citation1–3]. It is one of the molecular markers identified in AML and the most common driver mutation. It occurs in approximately one-third of patients with AML [Citation4,Citation5]. The FLT3 plays an important role in the proliferation, differentiation, and survival of normal hematopoietic cells. FLT3 contains five functional domains: an immunoglobulin-like extracellular domain, a transmembrane domain, a juxtamembrane domain (JMD), an interrupted tyrosine kinase domain (TKD), and a small C-terminal domain. JM structure contains: JM-B, JM-S, JM-Z, and JM-H. Different mutation types have different implications for the prognosis of AML patients [Citation6,Citation7]. The treatment of AML has entered the molecular era, and FLT3 mutations have become an important molecular marker for assessing the prognosis of AML [Citation8]. 2017 European Leukemia Network guidelines have included FLT3 internal tandem duplication positive (FLT3-ITD) [Citation9]. Clinical studies have found that patients with FLT3-ITD mutations have lower treatment complete remission rates, short RFS, and OS. FLT3-ITD mutations are an independent poor prognostic factor in AML [Citation3,Citation10]. But the clinical prognostic significance of other FLT3 mutation types, locations, number of insertion fragments, etc., and co-mutated gene types are not completely clear. In addition, blood cell counts are the most easily obtained laboratory results in the clinic. The study showed that platelet to white blood cell ratio was an independent prognostic predictor in AML [Citation11], so it is of great significance to explore the correlation between blood cell counts and gene mutations. For this reason, we analyzed data from the 279 AML patients with FLT3 mutations categorized into subgroups according to different types to further explore the clinical characteristics in this study.
2. Patients and methods
2.1. Patients
We collected a database of all patients with newly diagnosed AML, treated at the First Affiliated Hospital of Nanjing Medical University and The Affiliated Jiangning Hospital of Nanjing Medical University, from January 2012 until March 2017, for FLT3 mutant AML (excluding Acute promyelocytic leukemia), including 150 males and 129 females, having a median age of 51 (18–88) years along with 60 months as a follow-up time. Patients received the traditional first-line treatment scheme such as IA scheme (Idarubicin 8–12 mg/m2 + Cytarabine 100 mg/m2) and Cytarabine (1–3 g/m2) [Citation9]. According to different conditions of patients, the drug dose and time of some treatment schemes are adjusted. Two cases received transplantation and four cases received sorafenib treatment after relapse. Baseline variables including FLT3 mutation location, mutation type, mutation length, number of inserted fragments, and co-occurring mutations as well as blood cell counts were collected and analyzed. The Institutional Review Board of the hospital approved the collection of data.
2.2. Mutation analysis
Using Ion Torrent S5 NGS sequencing platform (Thermo Fisher company in the United States), 40 genes (TET2, GATA2, DNMT3A, ETV6, EZH2, FLT3, ASXL1, BCOR, CBL, CDKN2A, CSF3R, IDH1, IDH2, NRAS, PTPN11, RUNX1, SETBP1, JAK2, Ckit, KRAS, MPL, SETD2, SF3B1, SH2B3, SRSF2, STAG2, TP53, MBD4, RAD21, PHF6, EP300, U2AF1, WT1, ZRSR2, SMC1A, CUX1, NF1, DHX15, IK2F1, ANKRD26) of patients were deeply sequenced by targeted amplicon method (NGS amplicon sequencing primers were designed and synthesized by Thermo Fisher company). Using optimized library preparation procedures, each library achieved at least a mean depth of 2000×. PCR-based DNA analysis was performed to detect FLT3-ITD, followed by the detection and sizing of PCR products using capillary electrophoresis.
2.3. Clinical endpoints
The study is to explore the correlation between blood cell counts and different types of gene mutations, and evaluate the impact of FLT3 mutational diversity and co-occurring mutations on OS and RFS in newly diagnosed patients with FLT3 mutations.
2.4. Statistical analysis
Patient characteristics were summarized using descriptive statistics, which included median and range, etc. Patient characteristics were compared using the Student t-test or Mann–Whitney U-test, as appropriate. To evaluate the prognostic value of blood cell counts, the Kaplan–Meier method was used and Cox proportional hazard regression model in the multivariate analysis. The relationship between patients’ survival time was done using the log-rank test, P < 0.05 was taken as statistically significant. All computations were carried out in SPSS 24.0 (SPSS Inc., Chicago, IL, USA) and GraphPad Prism 5 statistical software (GraphPad Prism Software Inc., San Diego, CA).
3. Results
3.1. Characteristics of patients with FLT3 mutations
Patients were grouped according to the WBC count and divided into groups WBC (×109/L) <4.0, 4 ≤ WBC (×109/L) ≤ 10, 10 < WBC (×109/L) < 100 and WBC (×109/L) ≥ 100. Based on the PLT count, they were divided into groups PLT (×109/L) < 30, 30 ≤ PLT (×109/L) < 80 and 80 ≤ PLT (×109/L). Based on the Hb count, they were divided into groups Hb (g/L) <60, 60 ≤ Hb (g/L) < 90 and 90 ≤ Hb (g/L). There was no statistically significant correlation between blood cell counts and other variables including age and sex. Clinical features of patients are summarized in .
Table 1. Characteristics of patients with FLT3 mutations.
3.2. To clarify blood cell counts on survival
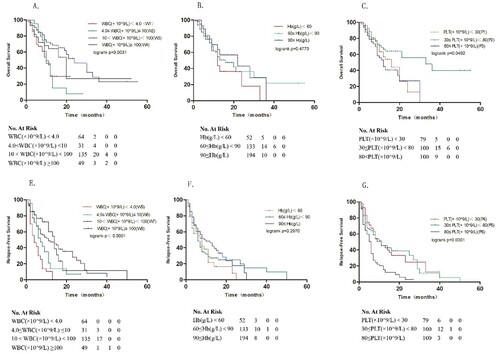
As shown in , blood cell counts illustrate a positively skewed distribution. Log2 transformation of blood cell counts was used to get closer to a normal distribution. Results revealed that 10 < WBC (×109/L) < 100 groups correlated with better survival, with median OS and RFS of 24 and 14 months, respectively, compared to the other three groups ((A,D), p = 0.0031 and p < 0.001, respectively). Revealed that 30 ≤ PLT (×109/L) < 80 groups correlated with better survival, with median OS and RFS of 33 and 11 months, respectively, compared to the other three groups ((C,F), p = 0.0492 and p = 0.001, respectively). Grouped by Hb count, no notable difference was observed in the three groups in OS and RFS ().
Figure 1. Survival analyses of AML patients with FLT3 mutations. Kaplan–Meier estimates of OS (A–C) and RFS (E–G). Post-hoc tests: W2 vs W3: P = 0.012; W2 vs W4:P = 0.0420; W5 vs W7: P < 0.001; W5 vs W8: P = 0.0016; W6 vs W7: P = 0.001; W7 vs W8: P = 0.002; P1 vs P2: P = 0.1466; P1 vs P3 P = 0.9831; P2 vs P3: P = 0.0176; P4 vs P5: P < 0.001; P4 vs P6: P < 0.001; P5 vs P6: P = 0.0095.
3.3. Multivariate prognostic analysis
Multivariate COX regression analysis was conducted based on common clinical indicators of AML patients, such as age, sex, blood cell counts, and treatment regimen. The results showed that age, sex, and treatment regimen had nothing to do with patients’ OS and RFS, and blood cell counts were an influential factor for patients’ prognosis ().
Table 2. COX regression analysis of OS and RFS for AML patients with FLT3 mutations.
3.4. Expression level of blood cell counts in AML patients under different groups.
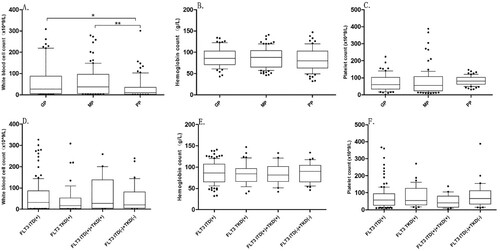
According to the 2017 European LeukemiaNet (ELN) guidelines [Citation9], including the results of cytogenetics and molecular genetics, the patients were divided into the good prognosis group (GP), medium prognosis group (MP), and poor prognosis group (PP). The median (interquartile range, IQR) of WBC (×109/L) count among the three groups were 26.46 [4.85, 62.57], 37.73 [7.37, 94.79], and 9.5 [3.03, 35.10], respectively, GP vs PP (p = 0.0084) and MP vs PP (p = 0.0042) ( A). The median of PLT count was the highest in the PP, but the difference between the three groups was not noticed, and no significant difference in Hb between the three groups (B, C). According to the type of the FLT3 mutation, the median of blood cell counts between the four subgroups was not significantly varied ( D–F).
Figure 2. The median of blood cell counts in AML patients with FLT3 mutations under different prognosis groups (A–C). The median of blood cell counts under different subtypes of FLT3 mutation groups (D–F).
Note: *p < 0.05, **p < 0.01
3.5. Expression level of blood cell counts in subgroups of different co-mutated genes
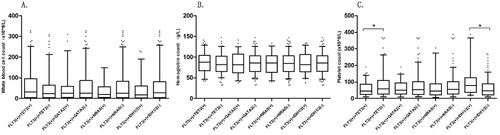
This study selected several common co-mutated genes, such as TET2, GATA2, NRAS, and IDH1/2, and then further divided them into mutation group and non-mutation group. The blood cell counts of 279 AML patients with FLT3 mutations were analyzed. The differences in WBC count and Hb were not statistically significant in the co-mutant gene groups (A, B). But the PLT count increased in the TET2 non-mutation group compared with the TET2 mutation group (median (IQR) 49.00[26.75,88.50] × 109/L, 60.50 [28.75, 109.00] × 109/L, respectively, p = 0.009) and decreased in the IDH1/2 non-mutation group compared with the IDH1/2 mutation group (median (IQR) 75.50[37.50, 125.75] × 109/L, 50.00 [23.25, 89.00] × 109/L, respectively, p = 0.000) (C).
Figure 3. The median of blood cell counts in AML patients with FLT3 mutations under different co-mutated gene types (A–C).
Note: *p < 0.05
3.6. Expression level of blood cell counts in different FLT3 mutation locations
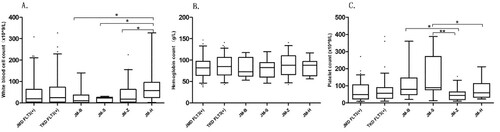
Patients were divided into JMD mutations group and TKD mutations group, and then further subdivided into four groups of JM-B, JM-S, JM-Z, and JM-H regions. The blood cell counts were analyzed. The differences in the median of blood cell counts were not statistically significant in the JMD and TKD regions. Among the four groups, JM-B, JM-S, JM-Z, and JM-H regions, the median (IQR) of WBC (×109/L) count was 10.08 [4.66,35.63], 20.87 [8.31, 24.66], 17.36 [4.70, 58.98], and 58.95 [28.92, 94.70], respectively. The WBC count had the highest count in the JM-H group compared to the JM-B, JM-S, and JM-Z groups (p = 0.0354, p = 0.0003, p = 0.0016, respectively) (A). The median (IQR) of PLT(×109/L) count was 50.50 [51.5, 141.00], 89 [78.50, 97.00], 44.50 [20.75, 62.00], and 58.50 [35.25, 108.50], respectively. The PLT had the lowest count in the JM-Z group compared to the JM-B and JM-S groups (p = 0.0393, p = 0.0045, respectively). The PLT count in the JM-S group was higher than the JM-S group (p = 0.0036) (C).
Figure 4. The median of blood cell counts in AML patients with FLT3 mutations under different gene mutation locations (A–C).
Note: *p < 0.05, **p < 0.01
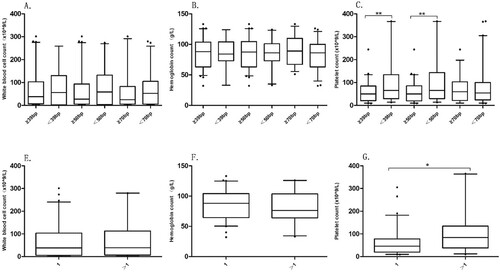
3.7. Expression level of blood cell counts in different subgroups of FLT3-ITD mutation
The mutation length of FLT3-ITD was grouped into three comparison groups by taking 39, 50 and 70 bp as cut-off point. According to the number of FLT3-ITD inserted fragments, they were divided into two groups =1 and >1. There were significant differences in PLT count in different mutation length groups and insert fragment groups. The median (IQR) of PLT(×109/L) count was 50.00 [21.25, 83.00], 65.00 [29.5, 132.00] between the insertion length ≥39 bp and <39 bp groups(p = 0.004); and 60.00 [20.75,84.50], 65.00 [30.00, 134.00] between insertion length ≥50 bp and <50 bp groups (p = 0.003) (C). The median (IQR) of PLT(×109/L) count between the = 1 group and >1 group was 46.00 [20.25,76.75], 84.00 [45.50, 122.50], respectively (p = 0.01) (G).
Figure 5. The median of blood cell counts in AML patients with FLT3 mutations under different FLT3-ITD insertion length (A–C) and different numbers of FLT3-ITD inserted fragments (E–G).
Note: *p < 0.05, **p < 0.01
4. Discussion
FLT3 is expressed in≈90% of leukemic blasts of patients with AML [Citation12]. Several studies have demonstrated that FLT3-ITD mutations are a significant poor prognostic marker for AML, which can guide patient selection for prognostic stratification and treatment options [Citation13–15]. However, treatment outcomes for AML patients with FLT3-ITD mutations are not uniformly effective, suggesting that AML with FLT3 mutations remains highly biologically heterogeneous and that other indicators should be sought to assess the condition and guide treatment for this subset of patients.
Blood cell counts are the most common laboratory test in clinical. But the impact of blood cell counts on patient treatment and prognosis can often be overlooked. In this study, we investigated the prognostic impact on patients by stratifying blood cell counts and further analyzed the correlation between the blood cell counts and gene mutations. We have made some interesting findings. It has been reported that the clinical characteristics of FLT3-ITD positive AML patients are usually high WBC count [Citation16]. In this study, the WBC count in the PP was significantly reduced in comparison with that in the MP and GP. Furthermore, grouping according to blood cell counts, the study found that WBC count and PLT count had an impact on OS and RFS in AML patients with FLT3 mutations. Patients with the lowest WBC count had worse OS and RFS. Although FLT3-positive AML patients have the highest WBC count and poor prognosis at the first diagnosis, the prognosis of the lowest WBC count is even worse. When platelets are reduced, it can be tricky for patients to treat, but analysis has found that it is not the case that the highest the patient's PLT count is the better; when the patient's PLT count is highest, the patient's prognosis may be worse. In AML with FLT3 mutations, the lowest WBC count and highest PLT count may have an adverse prognostic.
Previous studies on AML patients with FLT3 mutations have found that the insertion length and number of fragments of FLT-ITD have an impact on the prognosis of patients [Citation16,Citation17]. In this study, the location, number of insertion fragments, insertion length, and blood cell counts of 279 AML patients with FLT3 mutations were counted. It was found that the blood cell counts in patients at the time of initial diagnosis were associated with a variety of factors. There was a significant difference in PLT count among different co-mutated gene types. TET2 is present in approximately 9–23% of AML patients, there is disagreement and no consensus on its prognostic impact [Citation18–20]. Similarly, IDH gene mutations also play an important role in AML treatment [Citation21,Citation22]. In the TET2 mutation group, PLT count was reduced compared to the TET2 non-mutation group, while increased in the IDH1/2 mutation group compared to the IDH1/2 non-mutation group, but no differences were shown in the NRAS and GATA2 groups. Similarly, further grouping of FLT3 mutations type and location, there was no significant difference in WBC and PLT counts between groups ITD (+), TKD (+), ITD(+)+TKD(+), and ITD(–)+TKD(–). But the study revealed that PLT count had differential expression level in the JM-B, JM-S, JM-Z, and JM-H regions, with the highest count in the JM-S group and the lowest count in the JM-Z group. In addition, the WBC count was the highest in the JM-H group and at the lowest level in the JM-S group.
FLT3-ITD or TKD point mutations are two common types of mutations [Citation23]. In-frame duplications of 3 to 400 bp occur in up to 30% of adult patients with de novo AML [Citation3,Citation24]. Many studies have found that the insertion length of ITD and the number of inserted fragments have an impact on the prognosis of AML patients. The study pointed out that larger ITD size was an independent prognostic factor by multivariate Cox regression model analysis [Citation25]. We divide the insertion length into three groups with cut-off points of 39, 50, and 70 bp, respectively, and further investigate that there is variability in platelet count between the groups with insertion length ≥39 bp and <39 bp, ≥ 50 bp and <50 bp. In the <39 bp and <50 bp groups, the platelet count is higher, but between the ≥70 bp and <70 bp groups, there is no statistically significant difference in platelet count. In addition, the number of inserted fragments also influences the blood cell counts of patients, and the platelet count is higher when the number of inserted fragments is >1 than the number of inserted fragments is =1.
Studies demonstrated the blood cell counts at the initial diagnosis may be related to different gene mutations and have an impact on prognosis. However, we only found this phenomenon and cannot completely explain its internal reason. We believed that more studies will be conducted in the future to further reveal how gene mutations affect blood cell counts and how other functions played by blood cell counts affect the final prognosis.
Acknowledgements
We would like to thank Chun Qiao, Wenjie Liu (Department of Hematology, The First Affiliated Hospital of Nanjing Medical University), and Wei Zhang (Department of Hematology, The Affiliated Jiangning Hospital of Nanjing Medical University), for his valuable suggestions.
Disclosure statement
No potential conflict of interest was reported by the author(s).
Additional information
Funding
References
- Rosnet O, Mattei MG, Marchetto S, et al. Isolation and chromosomal localization of a novel FMS-like tyrosine kinase gene. Genomics. 1991;9(2):380–385.
- Agnes F, Shamoon B, Dina C, et al. Genomic structure of the downstream part of the human FLT3 gene: exon/intron structure conservation among genes encoding receptor tyrosine kinases (RTK) of subclass III. Gene. 1994;145:283–288.
- Kayser S, Schlenk RF, Londono MC, et al. Insertion of FLT3 internal tandem duplication in the tyrosine kinase domain-1 is associated with resistance to chemotherapy and inferior outcome. Blood. 2009;114:2386–2392.
- Chatain N, Perera RC, Rossetti G, et al. Rare FLT3 deletion mutants may provide additional treatment options to patients with AML: an approach to individualized medicine. Leukemia. 2015;29:2434–2438.
- Papaemmanuil E, Gerstung M, Bullinger L, et al. Genomic classification and prognosis in acute myeloid leukemia. N Engl J Med. 2016;374:2209–2221.
- Naseem S, Binota J, Varma N, et al. NPM1 and FLT3-ITD/TKD gene mutations in acute myeloid leukemia. Int J Hematol Oncol Stem Cell Res. 2021;15(1):15–26.
- Liu SB, Qiu QC, Bao XB, et al. Pattern and prognostic value of FLT3-ITD mutations in Chinese de novo adult acute myeloid leukemia. Cancer Sci. 2018;109(12):3981–3992.
- Zhao JC, Agarwal S, Ahmad H, et al. A review of FLT3 inhibitors in acute myeloid leukemia. Blood Rev. 2022;52:100905.
- Döhner H, Estey E, Grimwade D, et al. Diagnosis and management of AML in adults: 2017 ELN recommendations from an international expert panel. Blood. 2017;129(4):424–447.
- Richard FS, Sabine K, Lars B, et al. Differential impact of allelic ratio and insertion site in FLT3-ITD-positive AML with respect to allogeneic transplantation. Blood. 2014;124:3441–3449.
- Zhao S, Pan H, Guo Q, et al. Platelet to white blood cell ratio was an independent prognostic predictor in acute myeloid leukemia. Hematology. 2022;27(1):426–430.
- Carow CE, Levenstein M, Kaufmann SH, et al. Expression of the hematopoietic growth factor receptor FLT3 (STK-1/Flk2) in human leukemias. Blood. 1996;87:1089–1096.
- Kottaridis PD, Gale RE, Frew ME, et al. The presence of a FLT3 internal tandem duplication in patients with acute myeloid leukemia (AML) adds important prognostic information to cytogenetic risk group and response to the first cycle of chemotherapy: analysis of 854 patients from the United Kingdom Medical Research Council AML 10 and 12 trials. Blood. 2001;98(6):1752–1759.
- Kiyoi H, Kawashima N, Ishikawa Y. FLT3 mutations in acute myeloid leukemia: therapeutic paradigm beyond inhibitor development. Cancer Sci. 2020 Feb;111(2):312–322.
- Halahleh K, Taqash A, Abdelkhaleq H, et al. Analysis of FLT3-activating mutations in patients with acute myelogenous leukemia in Jordan: association with FAB subtypes and identification of subgroups with poor prognosis. Clin Lymphoma Myeloma Leuk. 2021;21(7):e588–e597.
- Abou Dalle I, Ghorab A, Patel K, et al. Impact of numerical variation, allele burden, mutation length and co-occurring mutations on the efficacy of tyrosine kinase inhibitors in newly diagnosed FLT3- mutant acute myeloid leukemia. Blood Cancer J. 2020;10(5):48.
- Liu SB, Dong HJ, Bao XB, et al. Impact of FLT3-ITD length on prognosis of acute myeloid leukemia. Haematologica. 2019;104(1):e9–e12.
- Medinger M, Passweg JR. Acute myeloid leukaemia genomics. Br J Haematol. 2017;179(4):530–542.
- Gaidzik VI, Paschka P, Späth D, et al. TET2 mutations in acute myeloid leukemia (AML): results from a comprehensive genetic and clinical analysis of the AML study group. J Clin Oncol. 2012;30(12):1350–1357.
- Cher CY, Leung GMK, Au CH, et al. Next-generation sequencing with a myeloid gene panel in core-binding factor AML showed KIT activation loop and TET2 mutations predictive of outcome. Blood Cancer J. 2016;6(7):e442.
- Fathi A T, Perl A E, Levis M, et al. Concurrent FLT3 inhibitor and IDH inhibitor therapy in patients with Acute Myeloid Leukemia (AML). Blood. 2020;136(Supplement 1):11–12.
- Garciaz S, Hospital M A, Saillard C, et al. IDH mutations identify a subgroup of NPM1 patients with a more favorable prognosis. a retrospective multicenter study of the filo group. Blood. 2020;136(Supplement 1):39–40.
- Guan W, Zhou L, Li Y, et al. Profiling of somatic mutations and fusion genes in acute myeloid leukemia patients with FLT3-ITD or FLT3-TKD mutation at diagnosis reveals distinct evolutionary patterns. Exp Hematol Oncol. 2021;10(1):27.
- Patel JP, Gonen M, Figueroa ME, et al. Prognostic relevance of integrated genetic profiling in acute myeloid leukemia. N Engl J Med. 2012;366:1079–1089.
- Chen F, Sun J, Yin C, et al. Impact of FLT3-ITD allele ratio and ITD length on therapeutic outcome in cytogenetically normal AML patients without NPM1 mutation. Bone Marrow Transplant. 2020;55(4):740–748.