
ABSTRACT
Objective
To explore the clinical outcomes and characteristics of TP53-mutated primary myelodysplastic syndromes (MDS).
Methods
A total of 74 de novo primary MDS patients who were diagnosed and treated in the Department of Hematology of our hospital from January 2018 and September 2021 were analyzed retrospectively. All patients had evaluable blood cell counts, mean corpuscular volume (MCV), lactate dehydrogenase (LDH), bone marrow (BM) morphology, biopsy, and MDS-related 20-gene mutations sequencing. In addition, 69 of 74 patients had complete cytogenetic analysis through conventional chromosome analysis and fluorescence in-situ hybridization.
Results
Patients were divided into two cohorts, the TP53-mutated type (TP53Mut) group (n = 19) and TP53 wild type (TP53WT) group (n = 55). Compared with the TP53WT group, patients in the TP53Mut group had higher ratios of cytogenetic abnormalities (82.4% vs. 30.8%, P < 0.001), with 5q- karyotype (64.70% vs. 38.5%, P < 0.001), complex karyotype(CK) (64.70% vs. 38.5%, P < 0.001), HR-MDS (94.7% vs. 61.8%, P = 0.008), and acute myelogenous leukemia (AML) transformation (26.3% vs. 12.7%, P < 0.001). Interestingly, patients in the TP53Mut group had lower median MCV than the TP53WT group (94.40 fl vs. 101.90 fl, P = 0.008). Furthermore, MCV = 100 fl as cutoff, and found that MCV ≤ 100 fl was more common in the TP53Mut group (73.7% vs. 38.2%, P < 0.001). After 1–4 courses of HMA ± chemotherapy, the overall response rate of the TP53Mut group was higher than the TP53WT group (83.3% vs. 71.4%, P = 0.012). With the median follow-up 12.0 months (1–46 months), the results show that the median OS and leukemia-free survival (LFS) of TP53Mut group was significantly shorter than the TP53WT group (P = 0.0018; P = 0.0310). Results of multivariate Cox proportional hazard analyses show TP53 mutation was an independent prognostic factor for the OS (HR 2.724, 95%CI 1.099–6.750, P = 0.030).
Conclusion
TP53-mutated primary MDS patients were associated with higher frequency of cytogenetic abnormalities, with 5q- karyotype, CK, AML transformation, higher risk IPSS-R, lower MCV and sensitive to HMA treatment, but worse survival.
Introduction
Myelodysplastic syndromes (MDS) are a heterogeneous group of clonal hematopoietic stem cell (HSC) malignancies characterized by inefffective hematopoiesis leading to peripheral blood cytopenia, and by the risk of acute myeloid leukemia (AML) transformation [Citation1]. It was reported that about 50–60% of patients exhibited acquired cytogenetic abnormalities [Citation2]. 5q-, + 8, −7/7q-, 20q-, -Y are the most common abnormal karyotypes [Citation3]. With the introduction of next-generation sequencing (NGS), a variety of genes that are recurrently mutated in MDS have been identified. Based on the functions, these genes are mainly divided into six groups, including DNA methylation (TET2, DNMT3A, IDH1/IDH2, etc.), RNA splicing (U2AF1, SF3B1, SRSF2, etc.), chromatin/histone modification (EZH2 and ASXL1, etc.), transcription factors (RUNX1, BCOR, etc.), cohesin (STAG2) and tumor suppressor (TP53). Haferlach et al [Citation4] summarized a total of 944 MDS cases, found that 80–90% patients harbored at least one mutation, much more sensitive than the cytogenetics, and the mutation analysis gradually became a research hotspot.
TP53, a tumor suppressor gene that spans 19,144 bp on chromosome 17p13.1 and contains 11 exons, which is associated with various cancers including hematological malignancies, and it was reported to be an independent prognostic factor for MDS patients [Citation5,Citation6]. TP53 mutations were observed in 20% of MDS patients, but the mutations reached up to 30–40% in therapy-related MDS cases [Citation4,Citation7,Citation8]. Moreover, TP53 mutations occurred frequently in MDS patients with complex karyotype (CK), strongly correlated with aberrations of chromosome 5, also predicting poor prognosis [Citation9,Citation10]. This retrospective study analyzed 74 de novo primary MDS patients in our single center, especially the gene mutations through NGS, and further enriched the characteristics of MDS patients with TP53 mutation.
Patients and methods
Patients
This study included 74 newly diagnosed primary MDS between January 2018 and September 2021. Including the complete blood counts (CBC), LDH, mean corpuscular volume(MCV), morphology (at least two puncture sites), biopsy and cytogenetics (conventional chromosome analysis or fluorescence in-situ hybridization), the target NGS panel using bone marrow (BM) samples was also performed. The CBC and MCV should exclude the influence of blood transfusion factors. The diagnostic criteria of MDS were according to the 2016 revision of the WHO classification [Citation1]. Prognostic model of MDS was based on the revised International Prognostic Scoring System (IPSS-R). Patients in very low-, low- or intermediate-risk groups were regarded as lower-risk MDS patients, and high- and very high-risk groups as higher-risk MDS. The presence of three or more distinct numerical or structural cytogenetic abnormalities was considered as CK. This study was approved by the Ethics Committee of the Affiliated Huaian No.1 People’s Hospital of Nanjing Medical University.
Molecular analysis through NGS
NGS was done with standard second-generation sequencing technology on a Illumina MiSeq System (Illumina, San Diego, CA) high-throughput sequencing platform. The 20-gene panel covered the commonly MDS-related mutations, including ASXL1, BCOR, EZH2, TET2, KRAS, NRAS, DNMT3A, ETV6, IDH1, IDH2, RUNX1, CBL, JAK2V617F, SRSF2, SF3B1, U2AF1, ZRSR2, STAG2, TP53 and SETBP1. The target panel involved nearly all types of mutations according to their functions. The average sequencing depth of 1000×, and the sensitivity was 1–2%, mutations were annotated using the databases dbSNP and COSMIC.
Statistical analysis
Statistical analysis was performed with SPSS 26.0 (IBM Corporation, Armonk, NY, USA) and Graphpad prism 8 (Graph Pad Software Inc., La Jolla, CA, USA). The two-sided χ2 test was used for categorical variables and the Mann–Whitney U test was used for continuous variables. The Kaplan–Meier analysis was adopted to assess the associations of TP53 mutation with leukemia-free survival (LFS) and overall survival (OS), and log-rank test was introduced to compare both curves. Univariate and multivariate Cox proportional hazards model were performed to identify significant prognostic predictors. Hazard ratio (HR) and 95% confidence interval (CI) were calculated. The significant variables with P < 0.1 defined in univariate survival analyses were included for the multivariate analyses to validate the prognostic value of TP53 mutation. Two-tailed P < 0.05 was considered significant.
Results
Patient characteristics
In this study, 19 of 74 patients (25.7%) had positive TP53 mutations, and patients were divided into two groups, including the TP53-mutated type (TP53Mut) group (n = 19) and TP53 wild type (TP53WT) group (n = 55). The TP53Mut group included 4 MDS-MLD cases, 1 MDS-EB-1 case, 13 MDS-EB-2 cases, and 1 MDS-U case ((A)). However, the TP53WT group included 1 MDS-SLD case, 11 MDS-MLD cases, 3 MDS-RS cases, 1 MDS-RS-MLD, 21 MDS-EB-1 case, 13 MDS-EB-2 cases, and 5 MDS-U cases ((B)). The TP53Mut group had a median age of 64 years (range, 13–83 years) and 15 patients (79.0%) were male, while the TP53WT group had a median age of 65 years (range, 37–87 years) and 37 patients (67.3%) were male, indicating no significant difference between the two groups (). Most of the patients underwent the required examinations, except 5 patients without cytogenetic results. The mean PLT level of TP53Mut group was lower than the TP53WTgroup(46.37 × 10⁹/L vs. 83.82 × 10⁹/L), but other CBC parameters between the two groups showed no significant difference, with the mean WBC 2.47 × 10⁹/L(range 1.02–4.57) vs. 2.64 × 10⁹/L(range 0.45–9.60), the mean HB level 67.05 g/L(range 52–103) vs. 71.24 g/L(range 39–144) (). Also, the LDH level, the ratios of ringed sideroblasts (RS), BM dysplasis and BM blasts ≥ 5% between the two groups seem no significant difference ().
Figure 1. The subtypes of MDS based on WHO 2016 classification. (A) The TP53Mut group; (B) The TP53WT group.
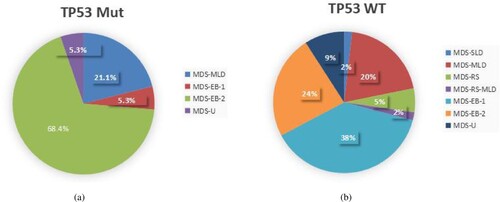
Table 1. Clinical and laboratory characteristics of patients in TP53Mut group and TP53WT group.
In addition, the parameter of MCV in blood routine was also surveyed, and results showing that the median MCV of patients in the TP53Mut group was much lower than the TP53WT group (94.40 fl vs. 101.90 fl, P = 0.008) (). According to the normal range of MCV in blood routine, using MCV = 100 fl as cutoff, we found that 15 of 19 patients in the TP53Mut group with MCV ≤ 100 fl, while there were 21 of 55 patients in the TP53WT group, indicating that MCV ≤ 100 fl was more common in the TP53Mut group (73.7% vs. 38.2%, P < 0.001) (). Based on the IPSS-R, there were 18 cases with higher risk IPSS-R except 1 case in the TP53Mut group, while 34 cases with higher risk and 21 cases with lower risk in the TP53WT group. Thus, much more patients had higher risk IPSS-R in the TP53Mut group (P = 0.008, ). Furthermore, compared with the TP53WT group, patients in the TP53Mut group had higher ratios of cytogenetic abnormalities (82.4% vs. 30.8%, P < 0.001), with 5q- karyotype (64.70% vs. 38.5%, P < 0.001), and CK (64.70% vs. 38.5%, P < 0.001) ().
TP53 mutation analysis
A total of 21 mutations were identified in the 19 cases, of which 17 (89.5%) cases harbored one mutation, 2 (10.5%) harbored two mutations (). Missense variant was the most common variant (17/21, 81.0%). The TP53 mutations were identified in the following sites: exon 4 in 3 (14.3%), exon 5 in 8 (38.1%), exon 6 in 4 (19.0%), exon 7 in 3 (14.3%), and exon 8 in 3 (14.3%) (). As shown in , DNA binding domains (exons 5–8) were the most common mutation sites in all cases. Among the 19 patients, 13 (68.4%) had other concurrent genetic mutations. TET2 was the most common mutation, detected in 6 (31.6%) patients, followed by DNMT3A in 3 (15.8%), SRSF2 in 3 (15.8%), U2AF1 in 3 (15.8%) cases. In addition, 19 cases had a median VAF of 43.22% (range, 7.46–88.2%) (). Recently, according to WHO 2022 guidelines, MDS with biallelic TP53 mutation (biTP53) has become a special subtype based on specific genetic abnormalities. showed 10 patients with biTP53, and the clinical characteristics of biTP53 MDS patients will be analyzed detailedly in the future.
Table 2. Cytogenetic and mutation characteristics of TP53-mutated patients.
Treatment response and survival
Treatment regimens of the 74 patients were diversified, including supportive care (SC), hypomethylation agents (HMA) ± chemotherapy (HMA ± chemo) and allogeneic hematopoietic stem cell transplantation (allo-HSCT). A total of 37 patients received SC, 1 allo-HSCT, and other 36 patients underwent HMA ± chemo regimens, of which 12 patients in the TP53Mut group, and 21 patients in the TP53WT group respectively. However, 2 patients have terminated HMA ± chemo regimens due to serious infection complications, 1 patient died of intracranial hemorrhage during chemotherapy. After 1–4 courses of HMA ± chemo regimens, much more patients got complete response (CR) or partial response (PR) in the TP53Mut group than the TP53WT group (83.3% vs. 71.4%, P = 0.012) (). Post HMA ± chemo regimens, 3 patients received allo-HSCT in the TP53WT group.
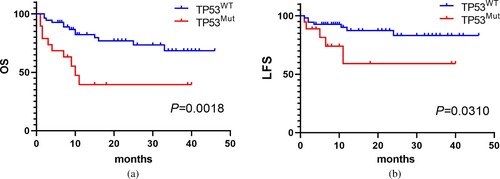
Follow-up to February 2022, as shown in , 5 of 19 patients in the TP53Mut group and 7 of 55 patients in the TP53WT group suffered AML transformation (26.3% vs. 12.7%, P < 0.001, ). Moreover, the survival rate of the TP53Mut group was 47.4% (9/19), while the TP53WT group was 76.4% (42/55). With the median follow-up 12.0 months (1–46 months), the results show that the median OS of TP53Mut group was significantly shorter than the TP53WT group (10.0 months vs. not reached, P = 0.0018) ((A)). And the LFS was also shorter than the TP53WT group (P = 0.0310) ((B)).
Figure 2. The Kaplan–Meier curve for OS and LFS of MDS patients stratified by TP53 mutation. (A) The OS of TP53Mut group was shorter than the TP53WT group. (B) The LFS was also shorter than the TP53WT group.
Univariate analyses for LFS and OS
Univariate analyses were performed to investigate the prognostic factors affecting disease transformation and death (). We found that TP53 mutation (HR 3.480, 95%CI 1.506–8.041, P = 0.004) and LDH level (HR 1.001, 95%CI 1.000–1.002, P = 0.001) were potential risk factors for poor OS. TP53 mutation was also prognostic for LFS (HR 3.374, 95%CI 1.04–10.901, P = 0.042). Five patients without complete cytogenetic data, which could affect the IPSS-R stratification, thus IPSS-R was not a potential risk factor for OS in this study.
Table 3. Univariate analyses for LFS and OS in 74 MDS patients.
Multivariate analyses for OS
All variables with P < 0.1 in univariate analyses were included in multivariate analyses. TP53 mutation, LDH level and BM dysplasis (%) were the prognostic-related risk factors for OS. We performed multivariate Cox regression analyses with the clinical variables based on the risk factors above. The results showed that TP53 mutation was an independent unfavorable factor for OS in primary MDS patients (HR 2.724, 95%CI 1.099–6.750, P = 0.030, ).
Table 4. Multivariate analyses for OS in 74 MDS patients.
Discussion
With the widespread availability of high throughput technology like NGS, multiple mutations have been revealed as significant factors in MDS. TP53 mutational analysis by NGS has proven to be a fundamental step in the diagnosis and prognosis of MDS. In this study, the frequency of mutated TP53 was up to 25.7%. Gu et al [Citation11] conducted a cohort of 63 MDS patients, found that TP53-mutated patients accounted for 18.5%. In our single-center study, we also found that patients in the TP53Mut group presented higher ratio of cytogenetic abnormalities, with 5q- karyotype, CK and higher risk IPSS-R than the TP53WT group (P < 0.05) (). Kulasekararaj AG et al [Citation12] analyzed 318 MDS patients, found that TP53 mutations were present in 5/26(19%) patients with isolated 5q-, and 21/29 (72%) with CK with 5q abnormalities. Yan et al [Citation13] summarized 425 MDS patients, with a result that mutational frequency of TP53 in IPSS-R cytogenetic prognostic subsets was 0 in very good, 2 in good (3.0%), 3 in intermediate (6.0%), 7 in poor (11.5%), and 16 in very poor (41.0%), indicating that TP53 mutational frequency ascended as karyotype risk increased (P < 0.001). In addition, we found that DNA binding domains (exons 5–8) were the most common mutation sites, and missense variant was the most common variant, consistent with literature reports [Citation14]. Based on the WHO 2022 guidelines for MDS, we found that 10 patients had biTP53 mutations, and we will study their clinical characteristics in the subsequent multi-center study.
In the past decades, the approved HMAs, azacytidine (AZA) and decitabine (DAC), have become the standard front-line treatment option in patients with higher-risk MDS [Citation15]. Some preclinical studies have demonstrated that TP53 mutations could increase the sensitivity of the cells to HMA treatment, and an improved response rate in TP53-mutated MDS [Citation16,Citation17]. In this study, a total of 33 patients with evaluable efficacy of HMA ± chemo regimen, including 12 TP53Mut cases, and 21 TP53WT cases. We found that higher overall response rate in the TP53Mut group than the TP53WT group (83.3% vs. 71.4%, P = 0.012) (), confirming that patients with TP53 mutation were more sensitive to HMA treatment. In addition, the 19 TP53-mutated cases had an AML transformation rate of 21.1%, lower than the literature of 30% [Citation18], but much higher than patients without TP53 mutation (). Ren et al [Citation14] reported that the median OS of 59 patients with gene detected was 14 (95% CI 10.82–17.18) months, and the median OS of 44 patients with TP53 mutations was significantly shorter (10 with 95% CI 7.05–12.95 months) when compared to patients without (27 with 95% CI 11.28–58.72 months, P < 0.01), and TP53 mutation was an independent unfavorable factor for OS after multivariate analysis. In this study, the survival rate of the TP53Mut group was 47.4% (9/19), while the TP53WT group was 76.4% (42/55), indicating that patients in the TP53Mut group had shorter median OS than the TP53WT group (10.0 months vs. not reached, P = 0.0018), and the median OS was also shorter (P = 0.0310) ((A); (B)). Univariate and multivariate analyses were also performed to investigate the prognostic factors affecting disease progression and death. Results indicated that TP53 mutation was an independent risk factor predicting poor OS in primary MDS patients (HR 2.724, 95%CI 1.099–6.750, P = 0.030, ).
MCV, an important index for differential diagnosis of cytopenia disorders, is usually elevated among MDS patients. Recently, two studies have confirmed that MCV ≤ 100 fl was an independent risk factor for MDS patients, especially in patients with BM blasts less than 5%, predicting poor prognosis [Citation19,Citation20]. Ok et al [Citation8] assessed 108 therapy-related MDS and AML patients, and found that 40 patients (37%) had TP53 mutation, with results showing a significantly lower MCV compared with patients without TP53 mutation (median, 90.0 fl vs. 93.0 fl, P = 0.0076). In this study, the median MCV of primary MDS patients in the TP53Mut group was also lower than the TP53WT group (94.40 fl vs. 101.90 fl, P = 0.008) (). In addition, MCV ≤ 100 fl and MCV > 100 fl were divided according to the normal range of blood routine examination, 15 of 19 patients in the TP53Mut group with MCV ≤ 100 fl, while there were 21 of 55 patients in the TP53WT group, indicating that MCV ≤ 100 fl was more common in the TP53Mut group (73.7% vs. 38.2%, P < 0.001) ().
In summary, we show the clinical outcomes and characteristics of patients with TP53 mutation in de novo primary MDS. TP53 mutation correlates with high frequency of cytogenetic abnormalities, with 5q- karyotype, CK, AML transformation, higher risk IPSS-R, lower MCV and sensitive to HMA treatment, but worse survival. Allo-HSCT is the only curative approach for TP53-mutated MDS patients. Hunter et al [Citation21] showed a trend of improved OS in those who achieved TP53 clonal clearance before the allo-HSCT (median 25.2 vs. 11.7 months; P = 0.10), and a serial VAF < 5% was recognized as TP53 clearance, proven to be an informative biomarker for patients proceeding to allo-HSCT. In addition, TP53-mutated MDS patients have normal or lower MCV levels inversely, increasing difficulty for clinician in the differential diagnosis of cytopenias through the blood routine. Thus, the application of an MCV cutoff (100 fl) might help us to make a more accurate risk assessment of MDS patients with TP53 mutation.
Disclosure statement
No potential conflict of interest was reported by the author(s).
Additional information
Funding
References
- Arber DA, Orazi A, Hasserjian R, et al. The 2016 revision to the World Health Organization classification of myeloid neoplasms and acute leukemia. Blood. 2016;127(20):2391–2405.
- Hasserjian RP. Myelodysplastic syndrome updated. Pathobiology. 2019;86(1):7–13.
- Zahid MF, Malik UA, Sohail M, et al. Cytogenetic abnormalities in myelodysplastic syndromes: an overview. Int J Hematol Oncol Stem Cell Res. 2017;11(3):231–239.
- Haferlach T, Nagata Y, Grossmann V, et al. Landscape of genetic lesions in 944 patients with myelodysplastic syndromes. Leukemia. 2014;28(2):241–247.
- Peller S, Rotter V. TP53 in hematological cancer: low incidence of mutations with significant clinical relevance. Hum Mutat. 2003;21(3):277–284.
- Horiike S, Kita-Sasai Y, Nakao M, et al. Configuration of the TP53 gene as an independent prognostic parameter of myelodysplastic syndrome. Leuk Lymphoma. 2003;44(6):915–922.
- Papaemmanuil E, Gerstung M, Malcovati L, et al. Clinical and biological implications of driver mutations in myelodysplastic syndromes. Blood. 2013;122(22):3616–3627. quiz 3699.
- Ok CY, Patel KP, Garcia-Manero G, et al. TP53 mutation characteristics in therapy-related myelodysplastic syndromes and acute myeloid leukemia is similar to de novo diseases. J Hematol Oncol. 2015;8:45.
- Kulasekararaj AG, Smith AE, Mian SA, et al. TP53 mutations in myelodysplastic syndrome are strongly correlated with aberrations of chromosome 5, and correlate with adverse prognosis. Br J Haematol. 2013;160(5):660–672.
- Sallman DA, Komrokji R, Vaupel C, et al. Impact of TP53 mutation variant allele frequency on phenotype and outcomes in myelodysplastic syndromes. Leukemia. 2016;30(3):666–673.
- Gu S, Xia J, Tian Y, et al. A novel scoring system integrating molecular abnormalities with IPSS-R can improve the risk stratification in patients with MDS. BMC Cancer. 2021;21(1):134.
- Kulasekararaj AG, Smith AE, Mian SA, et al. TP53 mutations in myelodysplastic syndrome are strongly correlated with aberrations of chromosome 5, and correlate with adverse prognosis. Br J Haematol. 2013;160(5):660–672.
- Yan X, Wang L, Jiang L, et al. Clinical significance of cytogenetic and molecular genetic abnormalities in 634 Chinese patients with myelodysplastic syndromes. Cancer Med. 2021;10(5):1759–1771.
- Ren Y, Mei C, Ye L, et al. Analysis of clinical and molecular features of MDS patients with complex karyotype in China. Blood Cells Mol Dis. 2019;75:13–19.
- Hunter AM, Sallman DA. Targeting TP53 mutations in myelodysplastic syndromes. Hematol Oncol Clin North Am. 2020;34(2):421–440.
- Ren Y, Wang J, Zhang H, et al. TP53 mutations are associated with very complex karyotype and suggest poor prognosis in newly diagnosed myelodysplastic syndrome patients with monosomal karyotype. Asia Pac J Clin Oncol. 2020;16(3):172–179.
- Welch JS, Petti AA, Miller CA, et al. TP53 and decitabine in acute myeloid leukemia and myelodysplastic syndromes. N Engl J Med. 2016;375(21):2023–2036.
- Grove CS, Vassiliou GS. Acute myeloid leukaemia: a paradigm for the clonal evolution of cancer? Dis Model Mech. 2014;7(8):941–951.
- Wang H, Wang X, Xu X, et al. Mean corpuscular volume predicts prognosis in MDS patients with abnormal karyotypes. Ann Hematol. 2010;89(7):671–679.
- Shi ZX, Qin TJ, Xu ZF, et al. Mean corpuscular volume ≤100fl was an independent prognostic factor in patients with myelodysplastic syndrome and bone marrow blast<5 percent. Zhonghua Xue Ye Xue Za Zhi. 2020;41(1):28–33.
- Hunter AM, Komrokji RS, Yun S, et al. Baseline and serial molecular profiling predicts outcomes with hypomethylating agents in myelodysplastic syndromes. Blood Adv. 2021;5(4):1017–1028.