
ABSTRACT
Background
Diffuse large B-cell lymphomas (DLBCLs) are phenotypically and genetically heterogeneous. We aimed to build a ferroptosis-related gene (FRG) prognostic signature to predict the outcome of DLBCLs.
Methods
Our study retrospectively investigated the mRNA expression level and clinical data of 604 DLBCL patients from three GEO public datasets. We performed Cox regression analysis to extract the FRGs with prognostic values. ConsensusClusterPlus was used to categorize the DLBCL samples according to gene expression. The least absolute shrinkage and selection operator (LASSO) method and univariate Cox regression were implemented to construct the FRG prognostic signature. The association between the FRG model and clinical characteristics was also investigated.
Results
We identified 19 FRGs with potential prognostic values and classified the patients into clusters 1 and 2. Cluster 1 showed a shorter overall survival (OS) time than cluster 2. The two clusters had different patterns of infiltrating immune cells. LASSO was used to generate a six-gene risk signature (GCLC, LPCAT3, NFE2L2, ABCC1, SLC1A5, and GOT1), based on which a risk score formula and prognostic model were constructed for predicting the OS of DLBCL patients. Kaplan–Meier survival analysis proved that poorer OS was exhibited in the higher-risk patients stratified by the prognostic model in both the training and test cohorts. In addition, both the decision curve and the calibration plots showed that the nomogram had good agreement between the predicted results and actual observations.
Conclusions
We developed and validated a novel FRG-based prognostic model which could help to predict the outcomes of DLBCL patient.
Background
DLBCLs are heterogeneous diseases comprising intermediate- and high-grade B-cell lymphomas with various clinical, pathological, and molecular markers. It is estimated that 30–40% of patients do not respond well to the standard treatment, and mortality is highest within 2 years of diagnosis. Quickly determining which patients have poorer prognoses allows patients to be considered for novel or targeted-treatment strategies faster. The most common way to predict the outcome of DLBCL is the application of the International Prognostic Index (IPI), Revised IPI, and the National Comprehensive Cancer Network (NCCN-IPI). In rituximab-targeted therapy, the IPI could only interpret less than 25% of the variation in OS, leading to limited separability of the highest-risk subgroups [Citation1]. Pathological subclassification based on molecular factors can also help clinicians obtain basic judgment on the patient's prognosis. Three subtypes of DLBCLs, namely activated B-cell–like [ABC], germinal center B-cell–like [GCB], and unclassified, have been identified according to the cell of origin and are widely used in clinical applications [Citation2]. Patients with ABC type have a more aggressive profile and activation of the NF-κB and B-cell antigen receptor signaling pathways [Citation3,Citation4], and GCB type tumors are often associated with aberrant chromatin-modification, PI3K signaling, and overexpression of Bcl-2 and MYC through copy number gains or chromosomal translocations [Citation5,Citation6]. Researchers have identified four crucial genotypes in DLBCL, with different mutant patterns, epigenetic features, and clinical characteristics: MCD, defined as the co-occurrence of MYD88L265P and CD79B mutations; EZB, defined as EZH2 mutations and Bcl-2 translocations; N1, defined as NOTCH1 mutations; and BN2, defined as Bcl-6 fusions and NOTCH2 mutations [Citation7]. These subtypes are instructional for precision-medicine strategies but are of limited assistance in the prediction of patients’ outcomes.
Ferroptosis is a form of regulated cell death characterized by oxidative stress and antioxidant defense mechanisms. Crucial roles played by ferrous ions in this process are oxidation of lipids, damage to plasma membranes, and imbalance in removing reactive oxygen species. This process is different from other well-known cell death mechanisms such as autophagy, necrosis, and apoptosis, as it does not depend on the classical death pathways such as caspase activation. Ferroptosis is a dynamic equilibrium involving oxidation and antioxidation. As a consequence of an imbalance in ferrous metabolism, ROS accumulate and lipid peroxidation occurs, leading to damage to the plasma membrane and cell death [Citation8,Citation9]. Since ferroptosis was first defined in 2012, it has been implicated as a potential physiological function in tumor suppression. Many genes have been considered regulators or markers of ferroptosis. Ferroptosis could be elevated by the tumor suppressor p53 protein and BAP1, both of which lead to the inhibition of tumor development [Citation10,Citation11]. Increasing research has proved that this form of cell death might be a therapeutic approach against hematological tumors [Citation12,Citation13]. A study of 114 cancer cell lines proved that DLBCL cells were highly vulnerable to ferroptosis inducer erastin [Citation14]. Ferroptosis may be induced by dimethyl fumarate, which is a promising option in the treatment of GCB DLBCLs [Citation15]. There is a possibility that ferroptosis could also be used in DLBCL prognosis formulation. Hence, we aimed to identify the expression patterns of FRGs in DLBCL patients to facilitate risk stratification.
Prognosis prediction based on gene expression profiles is still a developing approach. It necessitates new biomarkers for accurate prognosis prediction of DLBCL patients. Along with the development of statistical tools, several researchers have constructed risk score models based on FRG signature to evaluate the prognostic value of DLBCLs [Citation16–18]. Whether these ferroptosis-related genes are associated with survival remains to be investigated. In our study, we combined two datasets with the largest sample number from Gene Expression Omnibus (GEO) public databases as the training cohort. We made use of transcriptome profiles and corresponding clinical parameters of DLBCL patients to analyze the differential expression of FRGs. Then, we identified the functions enriched in the pathways and their biological roles to investigate the potential biological mechanisms. Next, we studied the immune cell profiles of each sample to evaluate the immune infiltration in the DLBCL samples. We also constructed and validated a multi-gene prognostic model with six FRGs in the training and testing cohorts, which might help improve the treatment strategies of DLBCL.
Methods
Data sources
All datasets used in this study are publicly available. The mRNA expression data and corresponding clinical information of the three independent cohorts (GSE10846, GSE11318, and GSE4475) were downloaded from the GEO database. Then, the dataset was comprehensively and rigorously preprocessed, which consisted of the removal of duplicates and low-variance features, missing value imputation, data characteristic assessment, and outlier removal. All patients with unclear clinicopathological characteristics, clinical stage, OS, or survival status were excluded. The clinical data of the DLBCL patients in the GEO dataset are shown in . The GSE10846 and GSE11318 RNA-seq data were merged into one new 447-sample cohort after the removal of 171 samples. From GSE4475, 155 samples were used as an external validation cohort. All data were collected on 14 April 2021.
Table 1. Clinical data of the DLBCL patients in the GEO dataset.
Comprehensive analyses of FRG-based clusters in DLBCL patients
We reviewed the published high-level literature on the subject of ferroptosis over the past 3 years and identified 60 FGRs [Citation9,Citation19,Citation20]. The cohort was screened for the expression of the 60 FRGs. Univariate Cox regression analysis was executed to explore the correlation between the FRGs and survival data using the R package (Additional File 1). P < 0.05 was set as the filtering threshold, and 19 genes were determined to be related to the prognoses of DLBCL patients. Next, we used the ConsensusClusterPlus (available through the Bioconductor project: http://www.bioconductor.org/) software package to categorize the DLBCL samples based on the 19 genes’ expression profiles. The samples were clustered using the pam algorithm by generating consensus in unsupervised class discovery. Ultimately, the samples were differentiated into two clusters based on transcriptomic datasets [Citation21]. We further analyzed the expression of the 19 FGRs and survival rate by calculating the DEGs within the two clusters using the limma package. The filtering threshold was set at FDR < 0.05 and |log2FC| > 1.2. Further functional analyses of the biological processes (BPs), molecular functions (MFs), and cellular components (CCs) regulated by the differently expressed genes in the two clusters were analyzed based on the Kyoto Encyclopedia of Genes and Genomes (KEGG) [Citation22–24] and Gene Ontology (GO) data using the R software and Clusterprofiler package. We used the ESTIMATE package in R to evaluate the Stromal Score, Immune Score, and ESTIMATE Score. We also used MCPcounter to determine 10 immune cell scores and the ssGSEA method in the GSVA package to assess the immune cell scores.
Establishment and validation of FRG signature
The 449 samples in GSE10846 and GSE11318 were separated into the training set (70%, i.e. 317) and the testing set (30%, i.e. 132). First, we used the R software package named Survival to execute univariate Cox regression analysis on the FRGs with significant prognostic values and then performed LASSO cox regression analysis to eliminate overfitting. We performed multivariate Cox regression analysis to screen the genes selected as the independent prognostic factors of OS and then calculated the regression coefficients of the genes to select an optimal prognostic model. The risk score of every DLBCL patient was also evaluated according to the expression level and coefficient of the six genes. The risk score formula was coeffificientgene1 × expressiongene1 + coeffificientgene2 × expressiongene 2 + … … coeffificientgene n × expressiongene n.
All samples were separated into two subgroups, high- and low-risk groups, according to the calculated median risk score. Subsequently, we conducted Kaplan–Meier survival analysis to contrast the survival probability between the two subgroups. The validity and effectiveness of the prediction in 1 year, 3 years, and 5 years of the polygenic signature were estimated by receiver operating characteristic (ROC) analysis using the pROC package. The risk scores of patients in different age, gender, and disease stage groups were evaluated using the abovementioned formula, and each group could be further classified into two subgroups, namely high- and low-risk groups.
We also calculated the risk scores of the DLBCL patients in the testing cohort and the external dataset GSE4475 to verify the robustness of the predictive model by the same signature and coefficients. Then, we constructed the Kaplan–Meier survival and survival ROC curves to demonstrate the predictive capability of the model in the internal and external validation cohorts.
Construction of a clinical FRG nomogram for DLBCL patients
First, the prognostic value of the multi-gene signature and different variables such as age, gender, and clinical stage were assessed by performing univariate Cox regression analysis. We also conducted multivariate Cox regression analysis to confirm whether the risk score is the independent prognostic factor for predicting the OS of DLBCL patients. We further employed the RMS and Survival packages to fit the regression model and built a nomogram. A correction curve was depicted to estimate the coherence between the nomogram-predicted results and actual observations. Calibration curves of the nomograms were calculated to evaluate the prediction accuracy of the nomograms.
Immunohistochemistry
Fifteen tumor tissue samples, comprising six GCB DLBCL and nine ABC DLBCL tissue samples, were obtained from the Hematology Department of Second Xiangya Hospital. Tissue sections were incubated at 60°C for 2 h and then in xylene and in a series of descending ethanol concentrations for rehydration. The slides were boiled in sodium citrate in a microwave oven for 20 min, and then, 3% hydrogen peroxide solution was used to treat the slides for 5 min, and 5% goat serum was used to block the non-specific antigen for 30 min. Antibodies against GCLC (Affinity, USA), LPCAT3 (Abcam, UK), NFE2L2 (Affinity, USA), ABCC1 (Affinity, USA), SLC1A5 (Affinity, USA), and GOT1 (Affinity, USA) were incubated with the sections for 1 h. The slides were incubated by secondary antibody, then stained with 3,30-diaminobenzidine and with hematoxylin, soaked in warm water for 10 min, dehydrated, incubated in dimethylbenzene, and mounted.
Statistical analysis
PERL software, R software, and GraphPad Prism 7 were employed for data processing and statistical analyses. Univariate and multivariate Cox regression analyses, differential expression analysis, ROC curve analysis, and Kaplan–Meier survival analysis were conducted using the corresponding packages in R software to determine the difference in the OS between the stratified groups. The Wilcoxon test was performed to compare the two groups, and the Kruskal–Wallis test was employed to compare prognosis between groups. For each analysis, p < 0.05 was considered statistically significant.
Results
Molecular classification and verification based on FRGs
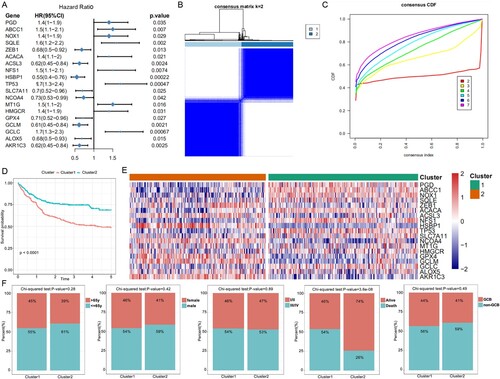
We determined 19 FGRs that were associated with the prognoses of DLBCL patients using univariate Cox regression analysis ((A)). The result of k = 2 from the unsupervised consensus analysis of all samples seemed to be more accurate according to the CDF curve, as it could separate all the samples into two subgroups with the least amount of correlation between the groups ((B,C)). To determine the correlation between the clinical outcomes and clustering results, we contrasted the OS between the two clusters of DLBCL patients and concluded that cluster 1 (C1) patients had poorer OS (p < 0.0001) than cluster 2 (C2) patients ((D)). The heatmap showed that the 19 FRGs were expressed differently in the two clusters ((E)). There was no significant difference in age, gender, pathology type, and stage between the two subtypes, but C1 had a higher level of death ratio than C2 ((F)).
Figure 1. Molecular classification and verification based on FRGs. (A) Forest plots show the association between gene expression of the FGRs and OS using univariate Cox regression analysis. (B) The consensus score matrix of all samples when k = 2. A higher consensus score between two samples indicates they are more likely to be grouped into the same cluster. (C) The cumulative distribution functions of the consensus matrix for each k (indicated by colors). (D) The OS of the DLBCL patients in the two clusters demonstrated by Kaplan–Meier curves. (E) Heatmaps show the different expression levels of the 19 FRGs. (F) Composition ratio of the two subgroups for clinical characteristics such as stage, age, gender, outcome, and pathological subtype.
Identification and functional annotation analyses of the DEGs
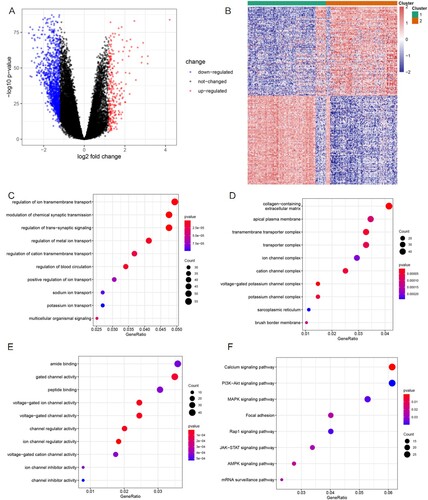
We detected the differential expression profile between C1 and C2 using the limma package and found that 248 genes were upregulated and 1242 genes were downregulated (Additional File 2) in C2 compared to C1 (p < 0.05, |log2FC| > 1.2). The representative 100 DEGs are displayed as a volcano plot and heatmap in (A,B). These 1490 DEGs were investigated based on GO annotations and KEGG pathway enrichment analysis to examine their functions. As the chord plots show ((C–E)), the main BPs participating were regulation of ion membrane transport, modulation of chemical synaptic transmission, trans-synaptic signaling, and metal ion transport. The enriched CC terminologies were apical plasma membrane, collagen-containing extracellular matrix, transmembrane transport complex, and ion channel complex. The MF mainly regulated amide binding, gated channel activity, and peptide binding (Additional File 3). Biological functions related to iron ion molecular, such as ion channel and ion-gated channel activities, were significantly enriched. The KEGG pathway analysis revealed ((F) and Additional File 4) that the calcium, PI3K-Akt, and MAPK signaling pathways, which are crucial for cellular proliferation and cell cycle regulation of lymphoma, were significantly enriched [Citation25].
Figure 2. Identification and functional annotation analyses of the DEGs. (A) Volcano plot of the DEGs between the C1 and C2 groups. Upregulated genes are presented as red nodes; downregulated genes as blue nodes; and genes with no differences as black nodes. (B) Heatmap of the DEGs to visualize gene expression levels. (C–E) The top 10 significant GO terms for the DEGs are displayed. (F) The top eight KEGG pathways of the DEGs are displayed.
FRG-based cluster was significantly associated with immune function
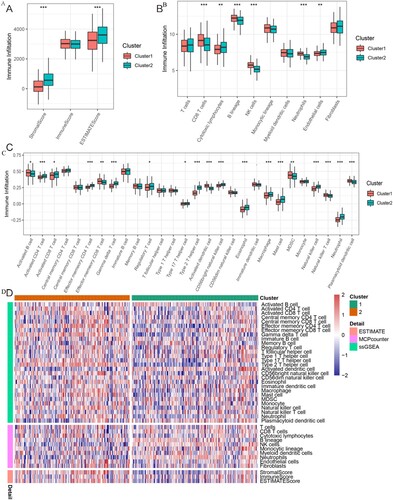
We compared the immunity scores between the two ferroptosis subtypes that demonstrated significant differences in the tumor microenvironment (TME) based on the Stromal Score (p < 0.001) and ESTIMATE Score (p < 0.001). C2 had higher Stromal Score and ESTIMATE Score than C1 ((A)). The Stromal Score represents the frequency of stromal components in the TME, and the ESTIMATE Score, which was the sum of the Immune Score and Stromal Score, reflects the comprehensive proportion of both stromal components and immune cells in the TME. MCPcounter analysis helped find that the immune scores of CD8 T cells, B lineage, NK cells, and neutrophils were significantly higher in C1 than in C2, whereas the immune scores of cytotoxic lymphocytes and endothelial cells were significantly higher in C2 than in C1 ((B)). These data imply that the TME of the C1 high-risk group was more immunoactive than C2. ssGSEA analysis showed that activated B cell, activated dendritic cell, MDSC, NK T cell, effector memory CD8 T cell, and plasmacytoid dendritic cell scores were higher in C1 than in C2. However, activated CD4 T cell, activated CD8 T cell, effector memory CD4 T cell, type 2 T helper cell, type 17 T helper cell, regulatory T cell, gamma delta T cell, CD56 bright NK cell, macrophage, mast cell, NK cell, eosinophil, and neutrophil scores were higher in C2 than in C1 ((C)). We plotted Immune Score heatmaps between the two molecular subgroups ((D)).
Figure 3. Relationship between the TME and FRG-based subtypes. (A) Boxplot shows the Stromal Score, Immune Score, and ESTIMATE Score between the two clusters. (B) Boxplot shows the abundance of 10 immune cells in C1 and C2. (C) Boxplot shows the abundance of 28 immune cells between the two clusters. (D) Heatmap for immune responses based on the ESTIMATE, MCPcounter, and ssGSEA algorithms in the two subtypes. *: p < 0.05; **: p < 0.01; and ***: p < 0.001.
Construction of FRG signature for OS in the training cohort
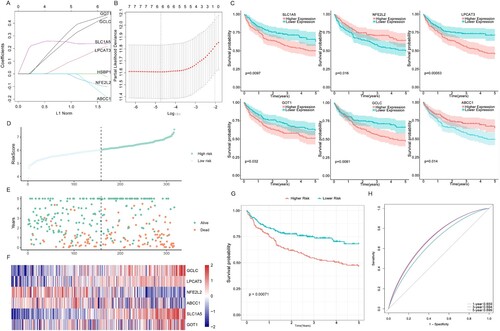
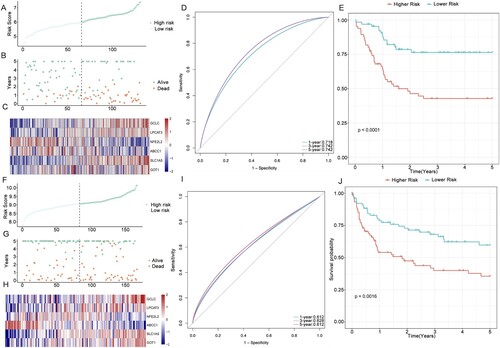
Seven FRGs were selected as the most useful predictors and identified as associated with OS ((A), Additional File 5) using the Survival package. The final multi-gene prognostic signature for OS used a six-gene signature composed of GCLC, LPCAT3, NFE2L2, ABCC1, SLC1A5, and GOT1 based on the optimal value of lambda by the LASSO Cox regression (0.008845861) ((B)). The prognostic Kaplan–Meier survival analysis of these six genes showed that the high expression of GCLC, LPCAT3, SLC1A5, and GOT1 was associated with poor prognosis, whereas ABCC1 and NFE2L2 were related to good outcomes ((C)). The risk score was calculated as follows: (expression level of GCLC × 0.47) + (expression level of LPCAT3 × 0.1) + (expression level of NFE2L2 × −0.31) + (expression level of ABCC1 × −0.1) + (expression level of SLC1A5 × 0.2) + (expression level of GOT1 × 0.35). The 317 DLBCL patients were stratified into two subgroups, namely the high-risk group (n = 158) and the low-risk group (n = 159), according to the median cut-off value (p = 0.00071) ((D)). In addition, we found a higher proportion of patients died in the high-risk group ((E)). The expression levels of the six FRGs in the two groups are presented as heatmaps ((F)). In consistence, the Kaplan–Meier survival curve indicated that the high-risk group had a poorer OS than the low-risk group ((G)). We also analyzed the predicted results of the risk score classification for 1-, 3-, and 5-year survival. The predictive performance of the risk score for OS is presented as time-dependent ROC curves. The area under the curve (AUC) reached 0.659 at 1 year, 0.694 at 3 years, and 0.699 at 5 years ((H)), indicating that DLBCL patients’ prognoses was predicted by the model with high sensitivity and specificity.
Figure 4. Identification of a six-FRG risk signature for predicting the OS of DLBCL in the training cohort. (A) LASSO coefficient spectrum of seven genes in DLBCL patients. (B) Cross-validation for tuning parameter selection in the proportional hazards model. (C) KM survival curve of the DLBCL patients with high or low expression of the six genes. High expression of SLC1A5, LPCAT3, GOT1, and GCLC was associated with inferior OS, whereas high expression of ABCC1 and NFE2L2 was associated with good outcomes. (D) Risk score in the low- and high-risk groups. (E) Survival time and survival state of patients. (F) Heatmap of the six genes in the two risk groups. (G) KM survival curve of the two groups. The high-risk group showed worse OS status than the low-risk group in the training cohort. (H) Time-dependent ROC curve of the prognostic signature in the training cohort.
Internal and external validation of the prognostic signature in the verification group
To evaluate the robustness of the six-gene signature constructed in the training cohort, the DLBCL patients from the verification cohort were also separated into two risk groups by the median value generated by the same formula used in the training cohort. Similar to the results obtained in the training cohort, patients with high risk tend to correlate with worse OS status than those with low risk (p < 0.0001). Furthermore, the ROC curve of the prognostic signature showed that the AUC was 0.718 at 1 year, 0.742 at 3 years, and 0.742 at 5 years, which indicated satisfactory accuracy of the model ((A–E)). The patients from the independent cohort (GSE4475) were also categorized into two risk groups using the same formula ((F)). The OS status based on the risk score and heatmap of the expression level of the six genes is shown in (G,H). The results were consistent with those obtained from both the testing cohort and the training cohort. The Kaplan–Meier plot showed that the DLBCL patients in the high-risk group had a poorer OS than those in the low-risk group (p = 0.0016) ((J)), and the ROC curve analysis showed that the AUC of the six-gene signature was 0.612 at 1 year, 0.628 at 3 years, and 0.612 at 5 years ((I)).
Figure 5. Internal and external validation of the six-gene signature. (A–B) Distribution of the DLBCL patients and OS status according to the median risk scores in the testing cohort. (C) Heatmap of the six genes in the two risk groups of the testing cohort. (D–E) ROC curve and KM survival analysis of the prognostic signature in the testing cohort. (F–G) Distribution of the DLBCL patients and OS status according to the median risk scores in the independent cohort (GSE4475). (H) Heatmap of the six genes in the two risk groups of the independent cohort. (I–J) ROC curve and KM survival analysis of the prognostic signature in the independent cohort (GSE4475).
Analysis of the risk model and clinical characteristics
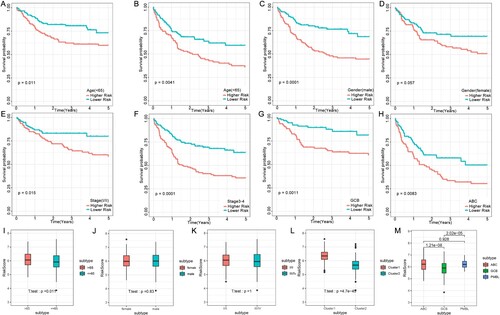
The risk score analysis in the training cohort found that the six-gene prognostic signature could also predict survival outcomes in clinical subgroups defined by parameters such as age, gender, stage groups, and germinal center B-cell subtype. A stratified analysis was performed according to age (>65 y subtype and ≤65 y subtype), gender (female subtype and male subtype), stage (stages I/II subtype and stages III/IV subtype), and germinal center B-cell subtype (GCB subtype and ABC subtype). All subtypes were tested using the FRG-based model and showed significantly shorter OS in the high-risk group than low-risk group ((A–H)). These results further indicated that our model had good predictive ability for different clinical signs. The risk score was also compared between the age (>65 y and ≤65 y), gender (female and male), stage (stages I/II and stages III/IV), molecular (C1 and C2), and germinal center B-cell (GCB and ABC) subtypes. The results showed the risk score was significantly higher in C1 than in C2 and in > 65 y than in ≤ 65 y. The risk score was also higher in the ABC subtype than in the GCB subtype, which was often related to poorer prognosis ((I–M)).
Figure 6. Connection between the FRG signature and other clinical characteristics in the training cohort. OS status for the two groups (high risk vs. low risk) assigned by age (A and B), gender (C and D), clinical stage (E and F), and germinal center B-cell subtype (G and H). Comparison of the risk score in DLBCL patients stratified by different age (I), gender (J), stage (K), and molecular subtypes (L) and the germinal center B-cell subtype (M). Red is the high-risk group, and blue is the low-risk group.
Construction of a nomogram of DLBCL patients
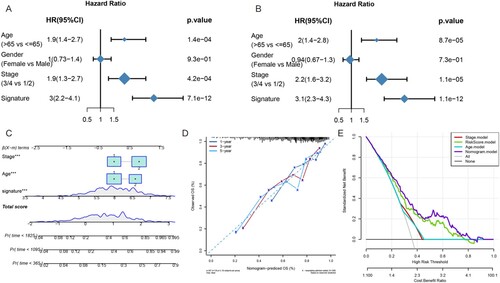
We performed univariate and multivariate Cox regression analysis to investigate whether the six-gene signature was an independent prognostic factor in DLBCL patients. The univariate Cox regression analysis indicated that age (HR = 1.9, p < 0.001), stage (HR = 1.9, p < 0.001), and risk score of the six-gene signature (HR = 3, p < 0.001) were significantly related to the OS status of the DLBCL patients in the merged cohort (p < 0.001) ((A)). The multivariate Cox regression analysis results also showed that the age (HR = 2, p < 0.001), stage (HR = 2.2, p < 0.001), and risk score of the prognostic signature (HR = 3.1, p < 0.001) were independent prognostic factors for DLBCL patients ((B)). Nomograms show risk model results intuitively and conveniently. They predict the outcome, with the length of the lines representing the impact of different variables on the outcome. We incorporated a multivariate analysis of the results, which included clinical characteristics and the novel FRGs’ prognostic signature together, to generate a hybrid nomogram model for predicting the 1-, 3-, and 5-year death rates ((C)). The nomogram showed that the risk score contributed more to the total score than other variables. The 1-, 3-, and 5-year death rates of patients increased as the total score increased. The calibration plots approached 45° and showed satisfactory agreement between the predicted OS rates and actual observations at 1, 3, and 5 years ((D)), indicating that the nomogram was stable and accurate. The risk score and nomogram both had good reliability based on the decision curve (DCA). Rather than a single independent predictive factor, the hybrid nomogram could obtain the optimal net benefit at 1, 3, and 5 years ((E)).
Figure 7. Construction of a nomogram of DLBCL patients. (A) Univariate Cox regression analysis presented as a forest plot that shows the correlations between the gender, age, clinical stage, risk factors, and OS of DLBCL patients. (B) Multivariate Cox regression analysis shows the correlation between the risk score, clinical parameters, and OS status. (C) Nomogram to predict the OS of patients. (D) The calibration curve showed that the nomogram could predict OS with high consistency with the actual OS. (E) DCA curves indicated that the nomogram had optimal clinical net benefits.
Expression levels of key genes in the DLBCL samples with different molecular features
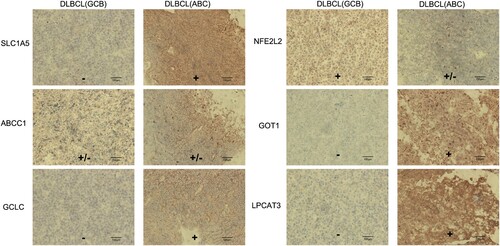
To investigate the clinical significance of the six genes, we used immunohistochemistry to examine the expression of the six key genes in the DLBCL samples with different prognostic molecular features, which include DLBCL with GCB type and DLBCL with ABC type. The result showed that the protein expression levels of the GCLC, LPCAT3, SLC1A5, and GOT1 genes were relatively higher in DLBCL with ABC type than in DLBCL with GCB type, whereas NFE2L2 and ABCC1 had no obvious difference in the two types ().
Figure 8. Differences in protein expression of the six ferroptosis-related genes in a DLBCL tumor tissue using immunohistochemistry.
Discussion
DLBCL is known as a clinical and molecular heterogeneous malignant hematological tumor. Various classification methods and molecular markers have been established to characterize this disease [Citation26]. We believe a DLBCL prognostic model would be worthy and meaningful for a long time. In the era of rituximab, the most common international prognostic indicators used in DLBCL patients include the IPI, the Revised IPI, and the NCCN-IPI. All these systems use standard clinical and laboratory factors to predict outcomes without explicitly considering the molecular heterogeneity of DLBCL. The progression of DLBCL is affected by numerous biological parameters. Hence, a prognostic model including the molecular mechanism, such as ferroptosis, would have better accuracy and precision. The novel molecular DLBCL classifier is instructional for precision-medicine strategies but offer limited assistance for the prediction of patients’ outcomes. Furthermore, the role and significance of mRNA expression of FRGs in the prognostic assessment of DLBCL are currently unclear. To develop practical molecular markers related to DLBCL prognosis, we have identified a signature of six FRGs using high-throughput expression analysis. Ferroptosis is a programed cell death modality that involves the regulation of cell death based on iron metabolism. This suggests new ideas and therapeutic strategies for tumor treatment. It could reverse the resistance of tumor cells to chemotherapy drugs and promote the removal of defective cells [Citation27]. Consequently, ferroptosis is potentially a novel mechanism for tumor therapy. Several researchers have concentrated on the role of ferroptosis in DLBCL treatment and development [Citation14,Citation15]. Deregulation of iron homeostasis gene expression was identified to be associated with a prognostic value in independent cohorts of DLBCL patients [Citation15]. Hence, we speculated that FRG might represent an independent prognostic factor compared to age, stage, gender, and molecular type.
In our study, based on the expression profile of FRGs, consensus clustering analysis divided the DLBCL patients into two clusters. The results showed obvious differences in OS between the two clusters. C1 patients had a much worse prognosis than C2 patients. Further analyses uncovered DEGs between the two clusters. KEGG pathway analyses identified genes participating in the PI3K-Akt and calcium signaling pathways. Both these pathways participate in the pathogenesis of lymphoma. The PI3K-Akt pathway is frequently activated in a variety of solid tumors and hematological malignancies; therefore, PI3K is considered an attractive therapeutic target in oncology. Currently, two PI3K inhibitors, copanlisib and idelalisib, have been approved for use against leukemia and B-cell lymphoma [Citation28–30]. Calcium signaling pathway also participates in GA101-induced cell death in lymphoma cells [Citation31]. Recent evidence indicates that Ca2+ ions play an important role in cell death mediated by oxidative glutamate toxicity or oxytosis, which is a form of programed cell death similar to ferroptosis [Citation32]. The GO enrichment mainly included several iron-related BPs and MFs, such as ion-gated channel activity and ion channel activity. We speculated that ferroptosis was related to ion channels and oxidative stress in DLBCL pathogenesis. In this study, we also found that the C1 group had a smaller ratio of stromal components than the C2 group. MCPcounter analysis showed a larger percentage of CD8 T cells, B lineage, NK cells, and neutrophils in C1 than in C2, and ssGSEA analysis showed a larger ratio of activated B cell, effector memory CD8 T cell, activated dendritic cell, MDSC, NK T cell, and plasmacytoid dendritic cell scores in C1 than in C2. Ferroptosis is considered both immunogenic and pro-inflammatory. Research has confirmed a direct link between ferroptosis and anti-tumor immunity. Among these immune cell types, a higher proportion of NK cells were correlated with poorer DLBCL outcomes, but dendritic cells might contribute to longer OS [Citation33]. Since the main feature of MDSC is its potent immune-suppressive activity, the stronger immunosuppressive effect of MDSC might contribute to the poor prognosis of the high-risk group [Citation34]. Regulatory T cells and CD4+ T cells, which reportedly correlated with improved survival in DLBCL, had a lower ratio in the C1 subtype than C2 subtype [Citation33,Citation35]. A higher ratio of activated CD8+ T cells could secrete IFN-γ and increase tumor cell lipid peroxidation and ferroptosis, which ultimately improves the anti-tumor efficacy of immunotherapy [Citation36]. Immune suppression and immune dysregulation are associated with the development of B-cell lymphoma. For example, HIV-positive, HHV8-positive, and EBV-positive individuals have a high risk of acquiring non-Hodgkin lymphoma. The ferroptosis of immune cells might contribute to the development of lymphoma by inducing immune dysregulation.
Previous studies have proved that the ferroptosis inducer erastin is useful for inducing cell death in 114 DLBCL cell lines [Citation14]. Ferroptosis might also be induced by dimethyl fumarate, which is a promising and novel therapeutic option in the treatment of GCB DLBCL, but the correlation between ferroptosis and DLBCL patients’ OS remains largely unclear. In this study, we identified a novel risk-scoring model constructed by six genes (GCLC, LPCAT3, NFE2L2, ABCC1, SLC1A5, and GOT1) to classify DLBCL patients into two classes and predicted the OS of DLBCL patients independently. Gene markers related to ferroptosis were established, and the expression levels of the six genes were not found to be influenced by the variances in the underlying diseases of DLBCL, indicating that the constructed prognosis signature could be useful for different types of DLBCL patients. Moreover, the hybrid nomogram based on the six-gene signature may provide support to clinicians to develop optimal treatment strategies. By concentrating on the function of the six ferroptosis genes, previous research has shown that the six genes play key roles in the development of cancer cells. GCLC is a rate-limited enzyme that primarily regulates the de novo synthesis of glutathione. It has been reported that activation of GCLC is related to drug resistance in various tumors, such as breast, head, lung, and neck cancers [Citation37–39]. LPCAT3 is an enzyme that primarily maintains systemic homeostasis by transferring lysophosphatidylcholine to phosphatidylcholine in the liver. It also participates in intestinal stem cell growth and phospholipid remodeling and tumorigenesis [Citation40,Citation41]. NFE2L2 is a main regulator of antioxidant response and regulates the activity of several ferroptosis and lipid peroxidation-related proteins [Citation42]. ABCC1 plays a pivotal role in protecting cells by removing a vast array of drugs to sub-lethal levels. Upregulation of ABCC1 leads to rescue from cell death and is often associated with resistance to chemotherapeutic agents [Citation43]. SLC1A5 is a cell surface solute-carrying transporter that facilitates the uptake of neutral amino acids [Citation44]. Blocking SLC1A5 to prevent glutamine uptake successfully restrains tumor cell proliferation in melanoma [Citation45], breast cancer [Citation46], and acute myeloid leukemia [Citation47]. This may explain the relationship between the biological function of SLC1A5 and its predicted ability. GOT1 plays an active role in ROS balance and energy metabolism in chronic acidosis stress [Citation48]. Few studies on the role of these genes in DLBCL patients’ prognoses have been reported, and their influence on the development of ferroptosis needs to be clarified. We evaluated the protein expression level of the six genes in the DLBCL clinical samples with different pathological types. GCB DLBCL had more favorable outcomes than those with ABC DLBCL when treated with standard immunochemotherapy [Citation49]. In our results, patients with ABC-type DLBCL had a higher expression of GCLC, LPCAT3, SLC1A5, and GOT1 than those with GCB-type DLBCL. These results support that GCLC, LPCAT3, SLC1A5, and GOT1 might be associated with the pathomechanism of the ABC DLBCL type. However, more investigation into how these ferroptosis genes could influence the survival of DLBCL is needed. Our 15 samples in the IHC were all from retrospective studies. The optimal validation would test the mRNA expression level by qPCR and perform IHC stains of the six markers in the high- vs. low-risk score groups. In clinical practice, it is technically difficult to obtain a fresh lymphoma sample to perform PCR before we know the pathologic diagnosis and lymphoma type. The most possible convenient way to apply the model is to examine the protein levels of the six genes using immunohistochemistry. Therefore, there is still some way to go before the FRG-based model can be put to practical use.
Conclusions
In summary, our research used a large database to establish a novel six-gene signature model related to FRGs for predicting the prognoses of DLBCL patients. This prognostic model has potential value for guiding therapy and offers insights into the identification of potential biomarkers of outcomes in DLBCL. In our model, the clinical applicability was evaluated using DCA. The calibration curve and results of DCA proved its good performance. Our samples in this research were all from retrospective studies; therefore, it is necessary to conduct more comprehensive experimental research for determining its clinical utility. The most salient disadvantage of the currently used prognosis signatures is their non-reproducibility in external datasets. Hence, we performed both internal and external validation of our proposed prognostic signature to confirm the reproducibility of the six-gene signature. However, additional experimental verification and prospective cohort studies are necessary to prove the potential mechanism and prognostic value of FRGs in DLBCL patients.
Disclosure statement
No potential conflict of interest was reported by the author(s).
Data availability statement
The gene expression profile and corresponding clinical information of the three independent cohorts (GSE10846, GSE11318, and GSE4475) were retrieved from the Gene Expression Omnibus (GEO) database (https://www.ncbi.nlm.nih.gov/geo/). All data included in this study are available from the corresponding author upon reasonable request.
Additional information
Funding
References
- Zhou Z, Sehn LH, Rademaker AW, et al. An enhanced International Prognostic Index (NCCN-IPI) for patients with diffuse large B-cell lymphoma treated in the rituximab era. Blood. 2014;123(6):837–842.
- Alizadeh AA, Eisen MB, Davis RE, et al. Distinct types of diffuse large B-cell lymphoma identified by gene expression profiling. Nature. 2000;403(6769):503–511.
- Nagel D, Vincendeau M, Eitelhuber AC, et al. Mechanisms and consequences of constitutive NF-kappaB activation in B-cell lymphoid malignancies. Oncogene. 2014;33(50):5655–5665.
- Davis RE, Ngo VN, Lenz G, et al. Chronic active B-cell-receptor signalling in diffuse large B-cell lymphoma. Nature. 2010;463(7277):88–92.
- Aukema SM, Siebert R, Schuuring E, et al. Double-hit B-cell lymphomas. Blood. 2011;117(8):2319–2331.
- Erdmann T, Klener P, Lynch JT, et al. Sensitivity to PI3K and AKT inhibitors is mediated by divergent molecular mechanisms in subtypes of DLBCL. Blood. 2017;130(3):310–322.
- Schmitz R, Wright GW, Huang DW, et al. Genetics and pathogenesis of diffuse large B-cell lymphoma. N Engl J Med. 2018;378(15):1396–1407.
- Dixon SJ, Lemberg KM, Lamprecht MR, et al. Ferroptosis: an iron-dependent form of nonapoptotic cell death. Cell. 2012;149(5):1060–1072.
- Stockwell BR, Friedmann AJP, Bayir H, et al. Ferroptosis: a regulated cell death nexus linking metabolism, redox biology, and disease. Cell. 2017;171(2):273–285.
- Jiang L, Kon N, Li T, et al. Ferroptosis as a p53-mediated activity during tumour suppression. Nature. 2015;520(7545):57–62.
- Zhang Y, Shi J, Liu X, et al. BAP1 links metabolic regulation of ferroptosis to tumour suppression. Nat Cell Biol. 2018;20(10):1181–1192.
- Shen Z, Song J, Yung BC, et al. Emerging strategies of cancer therapy based on ferroptosis. Adv Mater. 2018;30(12):e1704007.
- Tang R, Xu J, Zhang B, et al. Ferroptosis, necroptosis, and pyroptosis in anticancer immunity. J Hematol Oncol. 2020;13(1):110.
- Yang WS, SriRamaratnam R, Welsch ME, et al. Regulation of ferroptotic cancer cell death by GPX4. Cell. 2014;156(1-2):317–331.
- Schmitt A, Xu W, Bucher P, et al. Dimethyl fumarate induces ferroptosis and impairs NF-kappaB/STAT3 signaling in DLBCL. Blood. 2021;138(10):871–884.
- Xiong D, Li M, Zeng C. Construction and validation of a risk scoring model for diffuse large B-cell lymphoma based on ferroptosis-related genes and its association with immune infiltration. Transl Oncol. 2022;16:101314.
- Chen H, He Y, Pan T, et al. Ferroptosis-related gene signature: a new method for personalized risk assessment in patients with diffuse large B-cell lymphoma. Pharmgenomics Pers Med. 2021;14:609–619.
- Weng J, Chen L, Liu H, et al. Ferroptosis markers predict the survival, immune infiltration, and ibrutinib resistance of diffuse large B cell lymphoma. Inflammation. 2022;43(3):1146–1161.
- Bersuker K, Hendricks JM, Li Z, et al. The CoQ oxidoreductase FSP1 acts parallel to GPX4 to inhibit ferroptosis. Nature. 2019;575(7784):688–692.
- Hassannia B, Vandenabeele P, Vanden Berghe T. Targeting ferroptosis to iron out cancer. Cancer Cell. 2019;35(6):830–849.
- Wilkerson MD, Hayes DN. Consensusclusterplus: a class discovery tool with confidence assessments and item tracking. Bioinformatics. 2010;26(12):1572–1573.
- Kanehisa M, Goto S. KEGG: kyoto encyclopedia of genes and genomes. Nucleic Acids Res. 2000;28(1):27–30.
- Kanehisa M. Toward understanding the origin and evolution of cellular organisms. Protein Sci. 2019;28(11):1947–1951.
- Kanehisa M, Furumichi M, Sato Y, et al. KEGG: integrating viruses and cellular organisms. Nucleic Acids Res. 2021;49(D1):D545–D551.
- Sapon-Cousineau V, Sapon-Cousineau S, Assouline S. PI3K inhibitors and their role as novel agents for targeted therapy in lymphoma. Curr Treat Options Oncol. 2020;21(6):51.
- Lacy SE, Barrans SL, Beer PA, et al. Targeted sequencing in DLBCL, molecular subtypes, and outcomes: a Haematological Malignancy Research Network report. Blood. 2020;135(20):1759–1771.
- Mou Y, Wang J, Wu J, et al. Ferroptosis, a new form of cell death: opportunities and challenges in cancer. J Hematol Oncol. 2019;12(1):34.
- Xu ZZ, Xia Z-G, Wang A-H, et al. Activation of the PI3K/AKT/mTOR pathway in diffuse large B cell lymphoma: clinical significance and inhibitory effect of rituximab. Ann Hematol. 2013;92(10):1351–1358.
- Yang J, Li Y, Zhang Y, et al. Sirt6 promotes tumorigenesis and drug resistance of diffuse large B-cell lymphoma by mediating PI3K/Akt signaling. J Exp Clin Cancer Res. 2020;39(1):142.
- Curigliano G, Shah RR. Safety and tolerability of phosphatidylinositol-3-kinase (PI3K) inhibitors in oncology. Drug Saf. 2019;42(2):247–262.
- Latour S, Zanese M, Le Morvan V, et al. Role of calcium signaling in GA101-induced cell death in malignant human B cells. Cancers (Basel). 2019;11(3):291.
- Maher P, van Leyen K, Dey PN, et al. The role of Ca2+ in cell death caused by oxidative glutamate toxicity and ferroptosis. Cell Calcium. 2018;70:47–55.
- Ciavarella S, Vegliante MC, Fabbri M, et al. Dissection of DLBCL microenvironment provides a gene expression-based predictor of survival applicable to formalin-fixed paraffin-embedded tissue. Ann Oncol. 2019;30(12):2015.
- Kumar V, Patel S, Tcyganov E, et al. The nature of myeloid-derived suppressor cells in the tumor microenvironment. Trends Immunol. 2016;37(3):208–220.
- Tzankov A, Meier C, Hirschmann P, et al. Correlation of high numbers of intratumoral FOXP3+ regulatory T cells with improved survival in germinal center-like diffuse large B-cell lymphoma, follicular lymphoma and classical Hodgkin’s lymphoma. Haematologica. 2008;93(2):193–200.
- Wang W, Green M, Choi JE, et al. CD8+ t cells regulate tumour ferroptosis during cancer immunotherapy. Nature. 2019;569(7755):270–274.
- Fiorillo M, Sotgia F, Sisci D, et al. Mitochondrial “power” drives tamoxifen resistance: NQO1 and GCLC are new therapeutic targets in breast cancer. Oncotarget. 2017;8(12):20309–20327.
- Hiyama N, Ando Takahiro, Maemura K, et al. Glutamate-cysteine ligase catalytic subunit is associated with cisplatin resistance in lung adenocarcinoma. Jpn J Clin Oncol. 2018;48(4):303–307.
- Lin LC, Chen C-F, Ho C-T, et al. γ-Glutamylcysteine synthetase (γ-GCS) as a target for overcoming chemo- and radio-resistance of human hepatocellular carcinoma cells. Life Sci. 2018;198:25–31.
- Wang B, Rong X, Palladino END, et al. Phospholipid remodeling and cholesterol availability regulate intestinal stemness and tumorigenesis. Cell Stem Cell. 2018;22(2):206–220.e4.
- Wang B, Tontonoz P. Phospholipid remodeling in physiology and disease. Annu Rev Physiol. 2019;81:165–188.
- Dodson M, Castro-Portuguez R, Zhang DD. NRF2 plays a critical role in mitigating lipid peroxidation and ferroptosis. Redox Biol. 2019;23:101107.
- Lu JF, Pokharel D, Bebawy M. MRP1 and its role in anticancer drug resistance. Drug Metab Rev. 2015;47(4):406–419.
- Kanai Y, Hediger MA. The glutamate/neutral amino acid transporter family SLC1: molecular, physiological and pharmacological aspects. Pflugers Arch. 2004;447(5):469–479.
- Wang Q, Beaumont KA, Otte NJ, et al. Targeting glutamine transport to suppress melanoma cell growth. Int J Cancer. 2014;135(5):1060–1071.
- van Geldermalsen M, Wang Q, Nagarajah R, et al. ASCT2/SLC1A5 controls glutamine uptake and tumour growth in triple-negative basal-like breast cancer. Oncogene. 2016;35(24):3201–3208.
- Willems L, Jacque N, Jacquel A, et al. Inhibiting glutamine uptake represents an attractive new strategy for treating acute myeloid leukemia. Blood. 2013;122(20):3521–3532.
- Abrego J, Gunda V, Vernucci E, et al. GOT1-mediated anaplerotic glutamine metabolism regulates chronic acidosis stress in pancreatic cancer cells. Cancer Lett. 2017;400:37–46.
- Rutherford SC, Leonard JP. DLBCL cell of origin: what role should it play in care today? Oncology (Williston Park). 2018;32(9):445–449.