
ABSTRACT
Objectives
The study aims to analyze genetic mutation and clinical characteristics and study their correlation with survival prognosis of patients with myelodysplastic syndromes (MDS). Moreover, the differential DNA methylation profiles between TET2 mutated (Mut)/ASXL1 wild-type (WT) and TET2-Mut/ASXL1-Mut MDS samples were investigated to explore the mechanism of MDS patients with TET2/ASXL1 mutations.
Methods
The clinical data of 195 patients diagnosed with MDS were selected and statistically analyzed. The DNA methylation sequencing data set was obtained from the GEO and bioinformatics analyzed.
Results
Of the 195 MDS patients, 42 (21.5%) carried TET2 mutations. 81% of TET2-Mut patients could detect comutated genes. The most commonly comutated gene in MDS patients with TET2-Mut was ASXL1, which had a tendency towards poorer prognosis (P = 0.08). GO analysis showed that highly methylated differentially methylated genes (DMGs) was mainly enriched in biological processes such as cell surface receptor signal pathway and cell secretion. Hypomethylated DMGs was mainly enriched in cell differentiation and cell development. KEGG analysis showed that hypermethylated DMGs was mainly enriched in Ras signal pathway and MAPK signal pathway. Hypomethylated DMGs was mainly enriched in extracellular matrix receptor interaction and focal adhesion. PPI network analysis identified 10 hub genes of hypermethylated and hypomethylated DMGs that may be associated with patients with TET2-Mut/ASXL1-Mut respectively.
Conclusions
Our results illustrate the interrelationships between genetic mutations and clinical phenotypes and disease outcomes, with substantial potential for clinical application. Differentially methylated hub genes might represent potential biomarkers and provide novel insights and possible targets for MDS with double TET2/ASXL1 mutations.
1. Introduction
Myelodysplastic syndromes (MDS) is a group of heterogeneous myeloid clonal diseases originating from stem cells [Citation1], with an estimated incidence ranging from 5–13 cases per 100,000 individuals per year [Citation2]. The natural disease course and outcomes of patients with MDS vary substantially. Patients with MDS exhibit widespread aberrant DNA methylation in the late stage of the disease [Citation3]. In terms of the diagnosis and prognosis of MDS, clinicians frequently rely on the morphological, immunological and cytogenetic evaluations of peripheral blood and bone marrow and IPSS-R. In recent years, with advances in molecular biology, accumulating evidence has revealed that gene mutations play vital roles in the diagnosis, prognosis, and treatment of patients. Therefore, molecular-level studies will contribute to the accurate diagnosis and prognostication of MDS.
TET2 mutations occur with a higher frequency in haematological malignancies, including approximately 20–30% of MDS [Citation4]. TET2 mutations are associated with aberrant DNA methylation, increased risk of MDS progression and adverse prognosis for AML [Citation5]. Although the prognostic significance of TET2 mutation in patients with MDS has not been elucidated, TET2 mutations often accompany other gene mutations, which affect the prognosis of patients with MDS. In the present study, the clinical features and comutated genes of patients with TET2 mutations were analyzed to investigate the type and frequency of comutated genes and the relationship between comutations and the prognosis. Compared with concurrent double TET2/ASXL1 mutations, TET2 mutated (Mut)/ASXL1 wild-type (WT) patients tend to experience prolonged overall survival (OS) [Citation6,Citation7]. Additionally, early studies showed that double TET2/ASXL1 mutations were correlated with poorer response rates to hypomethylating agents, but TET2-Mut/ASXL1-WT with higher response rate [Citation8,Citation9]. It is speculated that a certain relationship and interaction exist between TET2 mutations and ASXL1 mutations. Based on the rapid development of microarray and high-throughput sequencing technology, bioinformatics plays a critical role in cancer research. Nevertheless, the changes in biological processes and signaling pathway TET2/ASXL1 mutations cause in MDS have not been reported. In this study, we retrospectively analyzed the clinical characteristics, outcomes and gene mutations of patients with MDS. Based on bioinformatics, the DNA methylation profiles of TET2/ASXL1 MDS samples in the GEO database were investigated to further explore the pathological mechanisms of TET2/ASXL1 mutations in MDS.
2. Materials and methods
2.1. Data collection
A total of 87 MDS patients in the Department of Hematology of the first Hospital of Lanzhou University from June 2015 to June 2021 were retrospectively collected. Diagnostic criteria and subclassified standards were based on the World Health Organization (WHO) in 2016 [Citation10]. All patients were risk-classified with regards to revised International Prognostic Scoring System (IPSS-R) [Citation11]. The follow-up started from the date of MDS diagnosis to August 2021 or death, conducted through telephone interviews or clinic visits. The study has been approved by the Ethics Committee of the First Hospital of Lanzhou University (LDYYLL2022-310) and adhered to the tenets of the Helsinki Declaration.
Information on 141 patients with MDS, including the DNA methylation sequencing dataset and corresponding clinical data, was downloaded from the GSE129828 dataset in the Gene Expression Omnibus (GEO). We obtained the complete clinical and follow-up data for 108 patients. Due to the low incidence rate of MDS, this study combined the cases from our institution and the GEO dataset to increase the statistical power of our analysis. In total, 195 patients were statistically analyzed in this study.
2.2. Cytogenetic analysis and Gene sequencing
Bone marrow (BM, 2–3 mL) was collected from 87 patients with MDS and then heparinized. Cytogenetic analysis was conducted by conventional G-banding analysis and fluorescence in situ hybridization (FISH). Polymerase chain reaction (PCR) was used for gene amplification in BM cells. Then PCR products were sequenced using the Illumina platform. MDS-related gene mutations were detected, including: ASXL1, TET2, SF3B1, RUNX1, SRSF2, DNMT3A, TP53, EZH2, ETV6, NRAS, IDH1, IDH2, CBL, JAK2.
2.3. Bioinformatics analysis of methylation data
Forty-six patients with TET2 mutation were screened from 141 patients with MDS using the R software (R 4.0.5) and related R packages and divided into two groups: TET2-Mut/ASXL1-WT and TET2-Mut/ASXL1-Mut. The MethylKit R package of the R platform was used for a differential methylation analysis between the two groups. Differentially methylated regions (DMRs) were identified using the ‘calculateDiffMeth’ function of the R-based methylKit package based on a q-value < 0.05 and a methylation difference cut-off of 20%. Then, hypermethylated DMRs and hypomethylated DMRs were obtained. DMGs were obtained by gene annotation using the eDMR package with the following criteria: regions with at least 3 CpG, 1 of which was a DMC, with an absolute mean methylation difference ≥ 20 and DMR q-value < 0.05.
Gene Ontology (GO) enrichment and Kyoto Encyclopedia of Genes and Genomes (KEGG) pathway analysis were performed to analyze DMGs using R package org.hs.eg.db, clusterProfiler and ggplot2. Subsequently PPI networks and hub genes were analyzed with the Search Tool for the Retrieval of Interacting Gene (STRING) database and Cytoscape software (V.3.9.1). We submitted the DMGs to the STRING database (http://string.embl.de/) [Citation12]. An interaction score > 0.4 was selected as statistically significant. Using the cytoHubba plugin in Cytoscape, the top 10 genes were screened as hub genes and ranked by degree. Then, Cytoscape was used for PPI network visualization. Each node represents a gene or protein, and edges between nodes define molecular interactions [Citation13].
3. Results
3.1. Baseline characteristics
In total, 195 patients with MDS were enrolled in this study. The median age at diagnosis was 66 years (range, 17–91 years), and 65.1% of the patients were male. Seventy-six patients (39%) had abnormal karyotypes. The most common subtype was MDS multilineage dysplasia (MDS-MLD, 35.6%) based on the 2016 WHO classification, and refractory anaemia with excess of blast (RAEB, 35.2%) was the most common subtype according to the FAB classification. Regarding IPSS-R risk stratification, patients in the intermediate group were the most common (27.2%). More detailed baseline characteristics are summarized in .
Table 1. Baseline characteristics of the195 MDS cases at time of diagnosis.
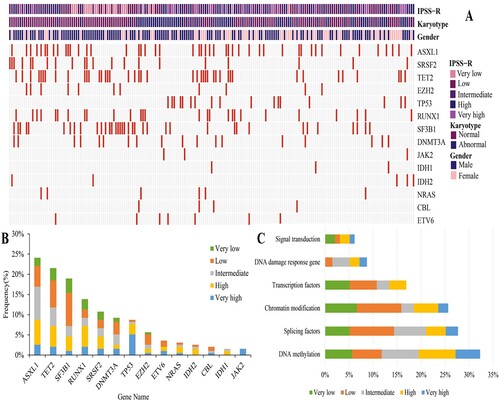
Of the 195 patients, 136 (69.7%) carried at least one gene mutation, with a median of 1 mutation detected per patient (range, 0–5). ASXL1 was the most frequently mutated gene (24.1%), followed by TET2 (21.5%), SF3B1 (19%), RUNX1 (13.8%), and SRSF2 (10.8%) (mutated in >10% of the cases). According to clinical information and mutated genes, a landscape of gene abnormalities was generated ((A)). Based on the distribution of mutations classified by IPSS-R risk stratification, intermediate risk (8.2%) was the most common risk subgroup for ASXL1 mutations, low risk was the most common risk subgroups for TET2 mutations (6.7%) and SF3B1 mutations (8.2%), and high risk was the most common risk subgroup for RUNX1 mutations (5.1%) and SRSF2 mutations (3.1%) ((B)). Fourteen mutant genes were classified into six functional pathways, including DNA methylation, splicing factors, chromatin modification, transcription factors, DNA damage response genes, and signal transduction ((C)). The most prevalent functional pathway was DNA methylation (32.3%). The median number of altered pathways was 1 (range 0–4), with 71 (36.4%) patients carrying mutations in one pathway, 43 (22.1%) in two pathways, 17 (10.4%) in three pathways and 5 (2.6%) in four pathways.
Figure 1. Mutational landscape of MDS(A) Molecular and clinical characterization of 195 MDS patients. Each column represents one patient, each line represents one gene, red boxes indicate mutations. Patients are organized by IPSS-R risk group, karyotype and gender (top). (B)Frequency of mutations identified in 195 MDS patients, divided according to IPSS-R risk group. The Y axis includes the percentage of patients harboring the specified mutation. Stacked columns display prevalence of each given mutation by IPSS-R risk group. (C) Distribution of mutations by functional pathways within the 195 MDS patients. 14 mutated genes are grouped into six functional pathways including DNA methylation, splicing factors, chromatin modification, transcription factors, DNA damage response gene, signal transduction.
3.2. Prognostic implications of MDS patients
The median OS of the 195 patients was 637 days (range 20–4185 days). In the univariate analysis, age (P = 0.001), IPSS-R risk stratification (P < 0.001), IPSS-R scores (P < 0.001), ASXL1 mutation (P = 0.015), EZH2 mutation (P = 0.018), TP53 mutation (P < 0.001), RUNX1 mutation (P < 0.001), ETV6 mutation (P = 0.087), IDH1 mutation (P = 0.099) and ETV6 mutation (P = 0.094) were related to the OS of patients with MDS (P < 0.1). Furthermore, the results of the multivariate Cox regression analysis revealed that age (HR 1.888, CI 1.137–3.137, P = 0.014), TP53 mutation (HR 3.452, CI 1.676–7.109, P < 0.001) and RUNX1 mutation (HR 1.991, CI 1.183–3.349, P = 0.009) were independent unfavorable prognostic factors for OS ().
Table 2. Univariate and multivariate analysis for overall survival among 195 patients with MDS.
3.3. Clinical characteristics of TET2 mutations
TET2 mutations were detected in 42 (21.5%) patients. We divided these patients into two groups based on the TET2 mutation status. Detailed characteristics of the two groups are presented in Table S1. The results revealed no significant differences in age, gender, absolute neutrophil count, haemoglobin level, platelet count, percentage of BM blasts, abnormal karyotype and IPSS-R between the two groups (P ≥ 0.05).
3.4. Comutation pattern and survival analysis of patients with TET2 mutations
One or more comutations were detected in 34 (81%) patients carrying TET2 mutations. Among them, ASXL1 had the highest comutation rate, accounting for 33.3% (14/34). Other genes showing comutation frequencies > 10% included RUNX1 (26.2%, 11/34), SRSF2 (19.1%, 8/34), and SF3B1 (16.7%, 7/34) (Figure S1).
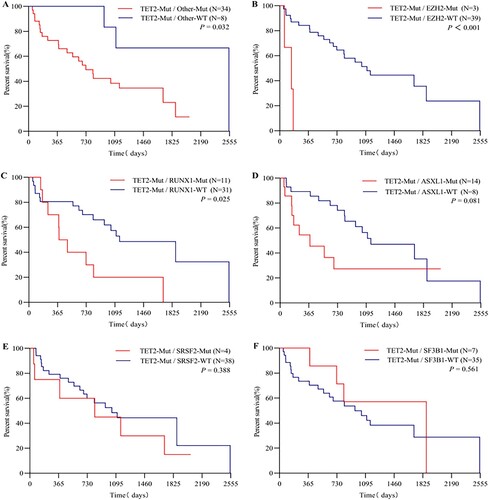
Our results show that the prognosis of patients with a TET2 mutation along with coexistent mutations was worse than that of patients with an isolated TET2 mutation (median OS: 727 vs. 2549 days, P = 0.032) ((A)). Next, we performed a survival analysis on TET2 mutant carriers with comutations. In the context of TET2 mutations, EZH2-Mut patients had a significantly inferior outcome to EZH2-WT patients (median OS: 150 vs. 1111 days, P < 0.001) ((B)); the OS of patients with RUNX1-Mut was significantly shorter than that of patients with RUNX1-WT (median OS: 437 vs. 1155 days, P = 0.025) ((C)). The results of the Kaplan–Meier analysis of other genes with comutated frequencies > 10% are displayed in . Shorter OS was observed for patients with ASXL1-Mut than for patients in the ASXL1-WT group (median OS: 380 vs. 1155 days, P = 0.08) ((D)).
Figure 2. Kaplan-Meier survival curve of TET2 mutant patients with comutations. (A) Co-occurrence of additional mutations. (B) Co-occurrence of EZH2-Mut. (C) Co-occurrence of RUNX1-Mut. (D) Co-occurrence of ASXL1-Mut. (E) Co-occurrence of SRSF2-Mut. (F) Co-occurrence of SF3B1-Mut. Log rank p-values are shown in each figure.
3.5. Identification of DMRs and DMGs
Studies have found that the ASXL1 mutation status affects treatment response and survival of patients with TET2 mutations. The DNA methylation spectrum of 29 patients with TET2-Mut/ASXL1-WT MDS and 17 patients with TET2-Mut/ASXL1-Mut MDS was investigated to further explore the mechanism by which the TET2/ASXL1 mutation status modulates the occurrence, development and treatment of MDS. DMRs were detected in samples from two groups of patients with MDS using the R language, and 337 DMR-related genes were screened by gene annotation, of which 132 were hypermethylated and 205 were hypomethylated.
3.6. GO and KEGG enrichment analysis of DMGs
GO and KEGG analyses were conducted to determine the potential biological functions of the identified hyper and hypo-DMGs (). Hypermethylated DMGs are mainly located in projection neurons, distal axons, actin-based projection cells, linear pseudopodia, growth cones, polarized sites and splice complex. The main molecular functions involved are signal receptor binding, receptor activity regulation, receptor–ligand activity, signal receptor activator, actin binding, coreceptor activity, inhibin binding, intracellular calcium-activated chloride channel activity and intracellular chloride channel activity. The main biological processes involved are animal organ development, cell surface receptor signal pathway, anatomical morphogenesis, cell secretion, enzyme-linked receptor protein signal pathway, transmembrane receptor protein tyrosine kinase signal pathway, lymphocyte activation, positive regulation of kinase activity, and skeletal system development. Most of the hypomethylated DMGs were located in chromosomes, projection neurons, cytoplasmic vesicle membrane, axon and specific granule membrane basement membrane. The main molecular functions involved are transcriptional regulatory factor activity, DNA binding transcriptional factor activity, RNA polymerase II specificity, RNA polymerase II transcriptional regulatory region sequence specific DNA binding, poly (U) RNA binding, polypyrimidine bundle binding and leucine zipper domain binding. The main biological processes involved are cell differentiation, cell development, animal organ development, neurogenesis, neuron generation, neuron differentiation, visual system development, and sensory system development.
Figure 3. GO enrichment terms and KEGG enrichment pathways of differentially methylated genes. (A) GO enrichment terms of hypermethylated DMGs. (B) GO enrichment terms of hypomethylated DMGs. (C)The KEGG enrichment pathways of hypermethylated DMGs. (D) The KEGG enrichment pathways of hypomethylated DMGs. GO: Gene Ontology; KEGG: Kyoto Encyclopedia of Genes and Genomes. GO enrichment analysis includes biological processes (BP), cellular components (CC) and molecular functions (MF). The color indicates the significant degree of enrichment and the size indicates the number of genes enriched for each result.
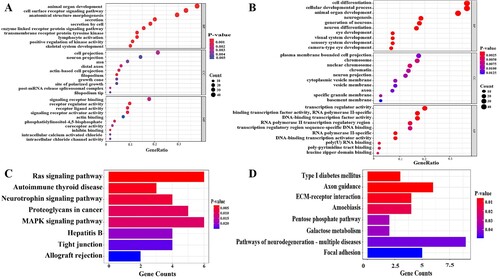
The pathway analysis of hypermethylated DMGs showed that these genes are mainly involved in the Ras signal pathway, autoimmune thyroid disease, neurotrophic factor signal pathway, proteoglycan, MAPK signal pathway, hepatitis B tight junction, allograft rejection and other signal pathways. Hypomethylated DMGs are mainly involved in type I diabetes and adhesion plaque.
3.7. PPI network analysis and identification of hub genes
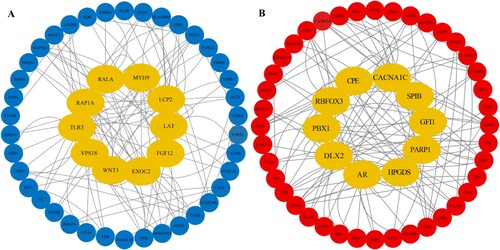
The interactions of 132 hypermethylated genes encoding proteins were analyzed using the STRING database and Cytoscape software. We used Degree algorithms in the cytoHubba plugin to detect the top 10 hub genes: EXOC2, LCP2, RAP1A, TLR3, LAT, FGF13, WNT3, VPS18, MYH9 and RALA ((A)). The interactions between proteins encoded by 205 hypomethylated genes were analyzed. The top 10 hub genes were as follows: AR, CACNA1C, PBX1, HPGDS, GFI1, CPE, RBFOX3, DLX2, PARP1 and SPIB ((B)).
Figure 4. The protein-protein interactome (PPI) network and hub genes. (A) PPI network of hypermethylated DMGs. (B) PPI network of hypomethylated DMGs. Yellow nodes mean hub genes, blue nodes mean hypermethylated DMGs, and red nodes mean hypomethylated DMGs.
4. Discussion
In our study, age, RUNX1 mutation and TP53 mutation were significantly associated with a poor prognosis of MDS. Malcovati et al. [Citation14] reported that the prognosis of patients with MDS is related to age and gender. Older ages and male patients had worse prognosis. Previous studies have shown that the aforementioned mutations are independent poor prognostic factors for MDS [Citation15,Citation16]. The tumor-suppressor gene TP53 plays a critical role in the maintenance of genomic stability. TP53 gene mutation can weaken or disappear the tumor suppressor effect of the TP53 protein, resulting in a large number of malignant clones of tumor cells, which are common in MDS and AML. It has been reported in previous literature that the incidence of TP53 mutation in patients with MDS was about 5–10% and TP53 mutations would confer poor prognosis [Citation17]. TP53 mutation rate in this study was 8.7%. The OS of patients with TP53-Mut was poor than that of patients with TP53-WT (median OS: 295 vs. 891 days, P < 0.001), which was consistent with the above results. In our study, the univariate prognostic analysis showed that ASXL1 mutations were related to a poor patient prognosis but were not an independent prognostic factor for survival in the multivariate analysis, consistent with the results of a previous study [Citation18]. The effect of ASXL1 mutation on MDS may change and be affected by the interaction with other genetic alterations during disease progression. Further follow-up basic and clinical studies are needed.
Ten-eleven translocation 2 (TET2) is a DNA demethylase that converts 5-methylcytosine (5mC) to 5-hydroxymethylcytosine (5hmC), a critical step promoting DNA demethylation [Citation19]. TET2 is highly expressed in CD34+ cells and myeloid lineage cells, such as CD33+ BM progenitors and CD14+ monocytes, modulating haematopoietic stem and progenitor cell (HSPC) self-renewal and differentiation [Citation20,Citation21]. TET2 mutations enhance DNA methylation and facilitate the proliferation of malignant clones [Citation22,Citation23]. In the present study, differences in clinical characteristics between the TET2 mutated and wild-type groups were not statistically significant. Identical conclusions were obtained in a previous report [Citation24]. Reports of the detailed clinical characteristics of patients with MDS carrying TET2 mutations in the literature are limited. In addition, TET2 mutations appeared to be prognostically irrelevant in our study. Nevertheless, Kosmider [Citation25] et al. found that TET2 mutation was a molecular marker of good prognosis for MDS, and Jankowska [Citation21] et al. showed that TET2 mutation was associated with an inferior outcome. In addition, some studies failed to show a relationship between TET2 mutations and the prognosis [Citation26,Citation27]. The prognosis of patients with MDS carrying a TET2 mutation is controversial and might be related to the various disease subtypes, ages, treatment regimens and types of coexisting mutations analyzed at each research center.
Moreover, 81% of patients with TET2 mutations concurrently carried other gene mutations in our study, most commonly in ASXL1, RUNX1, SRSF2 and SF3B1. Previous studies have shown that TET2 mutations commonly coexist with mutations in NRAS, KRAS, ASXL1, DNMT3A, EZH2, JAK2 and SRSF2 in patients with MDS [Citation28,Citation29]. To our knowledge, little information on TET2 comutations is available to date. Additional studies are warranted to further elucidate whether a significant correlation exists, as well as clinical implications between TET2 mutations and comutated genes. In the present study, a survival analysis was performed on patients with TET2 comutated genes. On the background of TET2 mutation, the co-occurrence of at least one mutant gene, EZH2 mutation and RUNX1 mutation, suggested poor prognosis. Furthermore, compared with patients carrying TET2/ASXL1 comutations, TET2-Mut/ASXL1-WT patients tended to experience prolonged OS, consistent with a previous study [Citation9]. While our understanding of the role of TET2 mutation in MDS has improved, many unanswered questions remain, for example, what are the interactions and causality among TET2 mutation and comutated genes in MDS? Moreover, an issue that must be explored in subsequent studies is whether TET2/ASXL1 comutations can be used as a predictor of specific drug response.
Aberrant DNA methylation is a distinguishing feature of MDS that is manifested by low methylation throughout the genome and high methylation in the gene promoter region, leading to genomic instability and abnormal expression of tumor suppressor genes and proto-oncogenes [Citation30]. TET2 mutations are associated with aberrant DNA methylation. The most common comutation of TET2 in our study was with ASXL1. Moreover, previous studies have found that the state of ASXL1 mutation can affect the survival of patients with TET2 mutation and the efficacy of hypomethylating agents [Citation8,Citation9]. Recently, methylation changes have gained increasing attention in cancer research, along with the fast progress in methylation detection technology(second-generation of sequencing). We performed a bioinformatics analysis of a DNA methylation sequencing dataset of patients with MDS to analyze the biological process and signal pathway changes caused by TET2/ASXL1 mutation at the molecular level, so as to provide a basis for follow-up MDS related research. The GO analysis showed that the hypermethylated DMGs were abundant in multiple signaling pathways. One of the possible pathogenic mechanisms of MDS is the cumulative imbalance of various signaling pathways regulating myeloid cell proliferation, differentiation, maturation and apoptosis [Citation31]. Hypomethylated DMGs were abundant in various biological processes, including cell differentiation and development. MDS is a heterogeneous clonal disease originating from haematopoietic stem cells that is characterized by abnormal differentiation and development of myeloid cells. The KEGG analysis revealed that hypermethylated DMGs were mainly enriched in the Ras and MAPK signaling pathways. RUNX1 mutations are often accompanied by a hyperactivated RTK-Ras signaling pathway in patients with MDS [Citation32]. The MAPK signaling pathway is a key pathway downstream of insulin-like growth factor 1 receptor (IGF-1R). IGF-1R is suspected to be a potential therapeutic target for MDS by suppressing the MAPK pathway to reduce the clonal proliferation of cells [Citation33]. Hypomethylated DMGs were mainly involved in extracellular matrix (ECM)-receptor interaction and focal adhesion. The ECM plays a pivotal role in the physiological activities of cells and the maintenance of tissue structure and function. The specific interaction between cells and ECM affects the processes of cell proliferation, differentiation, apoptosis, adhesion and phenotypic expression [Citation34]. Focal adhesion is the main connection between cells and ECM, and is responsible for maintaining tension during cell movement and signal transduction. Abnormal focal adhesions protein in mesenchymal stromal cells are associated with the development of MDS [Citation35]. Through changes in the methylation state, the genes enriched in the aforementioned pathways may affect various biological processes, including cell proliferation, differentiation and tumor cell metastasis.
Subsequently, with the aim of obtaining a better understanding of the interaction between DMGs, we further constructed PPI networks and identified hub genes. The top 10 hub genes of hypermethylated DMGs included EXOC2, LCP2, RAP1A, TLR3, LAT, FGF12, WNT3, VPS18, MYH9 and RALA. A meta-analysis showed that TLR3 single nucleotide polymorphisms (SNPs) are potential biomarkers for evaluating the cancer risk [Citation36]. TLR3 is associated with MDS pathogenesis leading to bone marrow failure. Upregulation of IRF3 is related to dismal prognostic markers in patients with MDS, such as excess blasts and the degree and number of cytopenias [Citation37]. The MYH9 gene encodes a protein related to cytoskeletal reorganization and cell migration [Citation38,Citation39]. Previous studies reported elevated MYH9 expression in patients with leukaemia and other malignant tumors, which is closely related to disease progression and a poor prognosis [Citation40,Citation41]. Patients with acute myelomonocytic leukaemia (AML-M4) presenting high MYH9 expression readily develop chemotherapeutic resistance, which is a marker of an adverse prognosis [Citation42].
The top 10 hub genes of hypomethylated DMGs included AR, CACNA1C, PBX1, HPGDS, GFI1, CPE, RBFOX3, DLX2, PARP1 and SPIB. PBX1 has been shown to play a role in oncogenesis by regulating multiple biological processes, including proliferation, invasion, metastasis and angiogenesis [Citation43], and it is associated with myeloid leukaemia [Citation44]. GFI1 is a transcription factor with essential roles in controlling the differentiation of myeloid and lymphoid cells [Citation45]. Studies have suggested associations of GFI1 expression levels with the prediction of survival outcomes and response to treatment of patients with AML, MDS and MM [Citation46–48]. PARP1 is a proto-oncogene that encodes a DNA-dependent poly (ADP-ribosyl) transferase associated with DNA repair, transcription, cell proliferation and apoptosis. PARP1 is known to play critical roles in DNA damage detection and repair [Citation49]. PARP1 was reported to be a novel therapeutic target in patients with AML and MDS [Citation50].
The screened hub genes listed above interact most closely with other proteins throughout the network and may play key roles in the initiation and progression of MDS in patients with TET2/ASXL1 mutations. However, a limitation of our study is the lack of a clinical correlation analysis and molecular biology experiments for hub genes. Hence, future studies should focus on validating the effects of hub genes on MDS, providing new ideas and theoretical basis for exploring the pathogenesis and possible drug targets of MDS with TET2/ASXL1 mutations.
5. Conclusions
Collectively, our study showed that age, RUNX1 mutations and TP53 mutations were independent adverse prognostic factors for the overall survival of patients with MDS. We also found that the most commonly comutated gene in patients with TET2-Mut MDS was ASXL1, which tended to result in a poorer prognosis. In addition, the functional enrichment analysis indicated that DMGs play vital roles in multiple cellular events, such as the regulation of proliferation, differentiation, maturation and apoptosis. We hope that the identification of hub genes as potential biomarkers might provide new insights into and possible targets for MDS associated with concurrent TET2/ASXL1 mutations.
Supplemental Material
Download MS Word (4 MB)Disclosure statement
No potential conflict of interest was reported by the author(s).
Correction Statement
This article has been corrected with minor changes. These changes do not impact the academic content of the article.
Additional information
Funding
References
- Adès L, Itzykson R, Fenaux P. Myelodysplastic syndromes. Lancet (London, England). 2014;383:2239–2252.
- Cogle CR, Craig BM, Rollison DE, et al. Incidence of the myelodysplastic syndromes using a novel claims-based algorithm: high number of uncaptured cases by cancer registries. Blood. 2011;117:7121–7125.
- Kennedy JA, Ebert BL. Clinical implications of genetic mutations in myelodysplastic syndrome. J Clin Oncol 2017;35:968–974.
- Feng Y, Li X, Cassady K, et al. Tet2 function in hematopoietic malignancies, immune regulation, and DNA repair. Front Oncol. 2019;9:210. doi:10.3389/fonc.2019.00210.
- Guillamot M, Cimmino L, Aifantis I. The impact of DNA methylation in hematopoietic malignancies. Trends Cancer. 2016;2:70–83.
- Haferlach T, Nagata Y, Grossmann V, et al. Landscape of genetic lesions in 944 patients with myelodysplastic syndromes. Leukemia. 2014;28:241–247.
- Papaemmanuil E, Gerstung M, Malcovati L, et al. Clinical and biological implications of driver mutations in myelodysplastic syndromes. Blood. 2013;122:3616–3627; quiz 99.
- Bejar R, Lord A, Stevenson K, et al. TET2 mutations predict response to hypomethylating agents in myelodysplastic syndrome patients. Blood. 2014;124:2705–2712.
- Hunter AM, Komrokji RS, Yun S, et al. Baseline and serial molecular profiling predicts outcomes with hypomethylating agents in myelodysplastic syndromes. Blood Adv. 2021;5:1017–1028.
- Arber DA, Orazi A, Hasserjian R, et al. The 2016 revision to the World Health Organization classification of myeloid neoplasms and acute leukemia. Blood. 2016;127:2391–2405.
- Greenberg PL, Tuechler H, Schanz J, et al. IPSS-R Revised international prognostic scoring system for myelodysplastic syndromes. Blood. 2012;120:2454–2465.
- Szklarczyk D, Gable AL, Nastou KC, et al. The STRING database in 2021: customizable protein-protein networks, and functional characterization of user-uploaded gene/measurement sets. Nucleic Acids Res. 2021;49:D605–D612.
- Doncheva NT, Morris JH, Gorodkin J, et al. Cytoscape StringApp: network analysis and visualization of proteomics data. J Proteome Res 2019;18:623–632.
- Malcovati L, Porta MG, Pascutto C, et al. Prognostic factors and life expectancy in myelodysplastic syndromes classified according to WHO criteria: a basis for clinical decision making. J Clin Oncol. 2005;23:7594–7603.
- Bejar R, Stevenson K, Abdel-Wahab O, et al. Clinical effect of point mutations in myelodysplastic syndromes. N Engl J Med 2011;364:2496–2506.
- Nazha A, Narkhede M, Radivoyevitch T, et al. Incorporation of molecular data into the revised international prognostic scoring system in treated patients with myelodysplastic syndromes. Leukemia. 2016;30:2214–2220.
- Sallman DA, Komrokji R, Vaupel C, et al. Impact of TP53 mutation variant allele frequency on phenotype and outcomes in myelodysplastic syndromes. Leukemia. 2016;30:666–673.
- Boultwood J, Perry J, Pellagatti A, et al. Frequent mutation of the polycomb-associated gene ASXL1 in the myelodysplastic syndromes and in acute myeloid leukemia. Leukemia. 2010;24:1062–1065.
- Ito S, Shen L, Dai Q, et al. Tet proteins can convert 5-methylcytosine to 5-formylcytosine and 5-carboxylcytosine. Science. 2011;333:1300–1303.
- Pronier E, Almire C, Mokrani H, et al. Inhibition of TET2-mediated conversion of 5-methylcytosine to 5-hydroxymethylcytosine disturbs erythroid and granulomonocytic differentiation of human hematopoietic progenitors. Blood. 2011;118:2551–2555.
- Jankowska AM, Szpurka H, Tiu RV, et al. Loss of heterozygosity 4q24 and TET2 mutations associated with myelodysplastic/myeloproliferative neoplasms. Blood. 2009;113:6403–6410.
- Tahiliani M, Koh KP, Shen Y, et al. Conversion of 5-methylcytosine to 5-hydroxymethylcytosine in mammalian DNA by MLL partner TET1. Science. 2009;324:930–935.
- Hellstrom-Lindberg E. Significance of JAK2 and TET2 mutations in myelodysplastic syndromes. Blood Rev 2010;24:83–90.
- Smith AE, Mohamedali AM, Kulasekararaj A, et al. Next-generation sequencing of the TET2 gene in 355 MDS and CMML patients reveals low-abundance mutant clones with early origins, but indicates no definite prognostic value. Blood. 2010;116:3923–3932.
- Kosmider O, Gelsi-Boyer V, Cheok M, et al. TET2 mutation is an independent favorable prognostic factor in myelodysplastic syndromes (MDSs). Blood. 2009;114:3285–3291.
- Gangat N, Mudireddy M, Lasho TL, et al. Mutations and prognosis in myelodysplastic syndromes: karyotype-adjusted analysis of targeted sequencing in 300 consecutive cases and development of a genetic risk model. Am J Hematol 2018;93:691–697.
- Lin Y, Lin Z, Cheng K, et al. Prognostic role of TET2 deficiency in myelodysplastic syndromes: a meta-analysis. Oncotarget. 2017;8:43295–43305.
- Shih AH, Abdel-Wahab O, Patel JP, et al. The role of mutations in epigenetic regulators in myeloid malignancies. Nat Rev Cancer. 2012;12:599–612.
- Tefferi A. Mutations galore in myeloproliferative neoplasms: would the real Spartacus please stand up? Leukemia. 2011;25:1059–1063.
- Issa J-P. Epigenetic changes in the myelodysplastic syndrome. Hematol Oncol Clin North Am 2010;24:317–330.
- Daw S, Chatterjee R, Law A, et al. Analysis of hematopathology and alteration of JAK1/STAT3/STAT5 signaling axis in experimental myelodysplastic syndrome. Chem Biol Interact. 2016;260:176–185.
- Niimi H, Harada H, Harada Y, et al. Hyperactivation of the RAS signaling pathway in myelodysplastic syndrome with AML1/RUNX1 point mutations. Leukemia. 2006;20:635–644.
- He Q, Zheng Q, Xu F, et al. IGF-IR promotes clonal cell proliferation in myelodysplastic syndromes via inhibition of the MAPK pathway. Oncol Rep. 2020;44:1094–1104.
- Padhi A, Nain AS. ECM in differentiation: a review of matrix structure, composition and mechanical properties. Ann Biomed Eng. 2020;48:1071–1089.
- Aanei CM, Eloae FZ, Flandrin-Gresta P, et al. Focal adhesion protein abnormalities in myelodysplastic mesenchymal stromal cells. Exp Cell Res 2011;317:2616–2629.
- Wang BG, Yi DH, Liu YF. TLR3 gene polymorphisms in cancer: a systematic review and meta-analysis. Chin J Cancer. 2015;34:272–284.
- de Oliveira RTG, Cordeiro JVA, Vitoriano BF, et al. ERVs-TLR3-IRF axis is linked to myelodysplastic syndrome pathogenesis. Med Oncol. 2021;38:27.
- Mu Y, Chen Y, Zhang G, et al. Identification of stromal differentially expressed proteins in the colon carcinoma by quantitative proteomics. Electrophoresis. 2013;34:1679–1692.
- Morimura S, Suzuki K, Takahashi K. Nonmuscle myosin IIA is required for lamellipodia formation through binding to WAVE2 and phosphatidylinositol 3,4,5-triphosphate. Biochem Biophys Res Commun 2011;404:834–840.
- Park S-Y, Kim H, Yoon S, et al. KITENIN-targeting microRNA-124 suppresses colorectal cancer cell motility and tumorigenesis. Mol Ther. 2014;22:1653–1664.
- Ravid K. MAL: not just a leukemia inducer. Blood. 2009;114:3977–3978.
- Yu M, Wang J, Zhu Z, et al. Prognostic impact of MYH9 expression on patients with acute myeloid leukemia. Oncotarget. 2017;8:156–163.
- Veiga RN, de Oliveira JC, Gradia DF. PBX1: a key character of the hallmarks of cancer. J Mol Med (Berl). 2021;99:1667–1680.
- Shimabe M, Goyama S, Watanabe-Okochi N, et al. Pbx1 is a downstream target of Evi-1 in hematopoietic stem/progenitors and leukemic cells. Oncogene. 2009;28:4364–4374.
- van der Meer LT, Jansen JH, van der Reijden BA. Gfi1 and Gfi1b: key regulators of hematopoiesis. Leukemia. 2010;24:1834–1843.
- Botezatu L, Michel LC, Makishima H, et al. GFI136N as a therapeutic and prognostic marker for myelodysplastic syndrome. Exp Hematol 2016;44:590–5.e1.
- Khandanpour C, Thiede C, Valk PJM, et al. A variant allele of growth factor independence 1 (GFI1) is associated with acute myeloid leukemia. Blood. 2010;115:2462–2472.
- Petrusca DN, Toscani D, Wang F-M, et al. Growth factor independence 1 expression in myeloma cells enhances their growth, survival, and osteoclastogenesis. J Hematol Oncol. 2018;11:123. doi:10.3389/fonc.2019.00210.
- Jagtap P, Szabó C. Poly(ADP-ribose) polymerase and the therapeutic effects of its inhibitors. Nat Rev Drug Discovery. 2005;4:421–440.
- Kontandreopoulou C-N, Diamantopoulos PT, Tiblalexi D, et al. PARP1 as a therapeutic target in acute myeloid leukemia and myelodysplastic syndrome. Blood Adv. 2021;5:4794–4805.