
ABSTRACT
Background:
Acute myeloid leukemia (AML) is the most common malignant hematological disease originating from hematopoietic stem cells. Endoplasmic reticulum stress (ERs) has been reported to be involved in multiple tumor-related biological processes. However, the prognostic role of ERs-related genes in AML has not been fully investigated.
Methods:
The TCGA-LAML RNA-seq dataset was downloaded from the UCSC Xena website as the training cohort. Univariate Cox regression analysis was used to identify 42 ER stress-related genes associated with prognosis. Then, a ERs risk score prognostic model was established through LASSO regression analysis. AML patients were divided into high- and low-risk groups according to the median risk score. The Kaplan-Meier survival curve, time ROC curve analysis and univariate and multivariate independent prognostic analyses were presented for the high- and low-risk groups. Moreover, we verified the ERs risk model in the TARGET-AML and GSE37642 datasets. Next, we performed immune cell infiltration analysis, immune checkpoint gene expression analysis and drug sensitivity analysis.
Results:
We found 42 ER stress-related genes with prognostic significance, and a prognostic model consisting of 13 genes was constructed and verified. The survival rate of AML patients in the low-risk group was better than that in the high-risk group. The tumor microenvironment and immune cell infiltration results showed that immune cell infiltration was correlated with the survival status of patients.
Conclusion:
This research identified a ERs risk model with significant prognostic value. These genes are expected to be potential prognostic biomarkers in AML, providing a new theoretical basis for disease management.
Introduction
Acute myeloid leukemia (AML) is a highly heterogeneous clonal malignant proliferative disease; as the most common type of leukemia in adults, it is characterized by the accumulation of immature myeloid progenitor cells in the bone marrow and peripheral blood [Citation1]. Fifty to seventy percent of AML patients who are sensitized to primary induction chemotherapy achieve remission, but most patients tend to relapse due to the emergence of drug resistance [Citation2]. In recent years, treatment methods such as high-dose chemotherapy and allogeneic hematopoietic stem cell transplantation have been greatly developed, and the overall survival of AML remains low, with a survival rate of only 24% [Citation2]. At present, the etiology and pathogenesis of leukemia are still not clear, and its recurrence and refractoriness are the main reasons for the low overall survival rate. Therefore, exploring effective therapeutic strategies to improve the prognosis of AML patients is imperative.
Endoplasmic reticulum stress is an imbalance in ER homeostasis characterized by the accumulation of unfolded or misfolded proteins and alterations in the Ca2+ concentration. To alleviate the damage caused by endoplasmic reticulum stress, cells relieve ER stress through biological processes such as the unfolded protein response (UPR), endoplasmic reticulum-associated protein degradation (ERAD), and autophagosome formation [Citation3]. Inositol requiring enzyme 1 (IRE1), protein kinase R-like ER kinase (PERK) and activating transcription factor 6 (ATF6) mediate three classic UPR pathways and play an essential role in relieving ERS and maintaining the homeostasis of the cellular environment [Citation4]. In the absence of endoplasmic reticulum stress, these three sensors are in an inactive state due to their binding to the molecular chaperone protein named glucose-regulated protein 78 (GRP78/BiP) [Citation5]. When ER stress occurs, unfolded proteins or misfolded proteins competitively bind to GRP78/BiP proteins such that GRP78/BiP dissociates from IRE1, PRKR and ATF6, activating downstream signaling pathways [Citation5]. Inhibition of the UPR-mediated pro-survival pathway and induction of the persistent ERS-mediated pro-death pathway are two approaches for ER stress-related antitumor therapy.
Hypoxia, acidification, malnutrition, genetic mutations, reactive oxygen species (ROS) and other factors can all cause the accumulation of unfolded or misfolded proteins in cells, resulting in endoplasmic reticulum stress [Citation6]. In fact, AML cells experience an unfavorable bone marrow microenvironment, usually leading to ER stress activation. The unfolded protein response (UPR) and autophagy are activated, alleviating the ERS response and helping AML cells escape the effect of prolonged ERS-induced cell death [Citation7]. Multiple research achievements have reported that the three UPR branches (IRE1α, PERK and ATF6α) are activated differently in various hematopoietic tumors, such as leukemia, lymphoma and myeloma [Citation8–10]. Similar to solid cancers, the UPR plays a crucial role in the adaptation to cellular stress of leukemia cells by inducing distinct mechanisms that attempt to re-establish ER homeostasis and restore normal function. Different activation mechanisms of ER stress have been reported in leukemia, such as oncogenic kinase-related signaling pathways, epigenetic modification of promoters and genomic instability [Citation11]. The UPR response may illustrate that AML cells either resolve stress through an adaptive phase to allow cancer progression or trigger proapoptotic signaling during prolonged or intense stress leading to activation of the terminal UPR. Leukemia cells that are subject to the biological processes of endoplasmic reticulum stress are beneficial to tumor progression and may increase the response to chemical tolerance to various drugs [Citation12]. Therefore, our main purpose was to explore the prognostic value of ER stress-related genes, revealing the potential value and construct a novel prognostic feature of AML according to the expression level of ER stress-related genes.
In the current study, we obtained 42 ER stress-related genes with prognostic value based on the mRNA expression profile and complete clinical information of AML patients in the TCGA-LAML training set. Then, we constructed a prognostic prediction model with 13 genes based on the identified genes with prognostic value. Patients were divided into high- or low-risk groups according to the median risk score. Survival analysis, ROC curve analysis and independent prognostic analysis were performed and validated in two validation sets. For further in-depth data analysis, GO and KEGG gene enrichment analysis, tumor microenvironment analysis, immune cell infiltration analysis, correlation analysis and drug sensitivity analysis were performed in the two risk groups of the TCGA-LAML training set. In conclusion, this study is beneficial for exploring the potential association between ER stress and disease and evaluating the clinical value of prognosis in AML.
Materials and methods
Data acquisition
As the training cohort, the TCGA-LAML RNA-seq dataset and the corresponding clinical information were downloaded from the UCSC Xena website (https://xenabrowser.net/datapages/), and the gene annotation files were acquired from the GENCODE website (version 22, www.gencodegenes.org/). The mRNA expression profiles in the TCGA-LAML RNA-seq dataset were further extracted according to the gene annotation files. Finally, we obtained data from 117 AML patients with complete mRNA expression profiles and survival information. As the first validation cohort, the TARGET-AML RNA-seq dataset and the corresponding clinical information were also downloaded from the UCSC Xena website. Then, we acquired the data of 146 AML patients with complete mRNA expression profiles and survival information. As the second validation cohort, the Series Matrix File data of GSE37642 and the corresponding clinical information were downloaded from the GEO database (https://www.ncbi.nlm.nih.gov/geo/), and the probe annotation platform files were acquired from GPL570 [Citation13]. Similarly, we collected data from 136 AML patients with complete mRNA gene expression profiles and survival information. The ‘Limma’ R package was used to normalize the GSE37642 gene expression profiles (Supplementary Figure S1). Moreover, two ER stress-related gene sets (GO RESPONSE TO ENDOPLASMIC RETICULUM STRESS and GO REGULATION OF RESPONSE TO ENDOPLASMIC RETICULUM STRESS) were downloaded from Molecular Signature Database v7.5.1 (MSigDB) (http://www.gsea-msigdb.org/gsea/msigdb/index.jsp) [Citation14]. A total of 256 ER stress-related genes were acquired in two gene sets after overlapping genes were removed. Among them, 244 genes could be found in the TCGA-LAML dataset. As all data used in this study were obtained from public databases, no ethics committee approval was needed.
Construction and validation of the prognostic signature
To select prognosis-related genes, we combined the expression levels of ER-related genes with survival time and survival state, and then univariate Cox regression analysis was performed in 117 AML samples from the TCGA training cohort to screen survival-related genes with p < 0.05 as the cutoff value. Then, LASSO regression analysis was used on these survival-related genes to determine the most valuable predictive genes. The genes and their coefficients were determined by the optimal penalty parameter λ associated with the minimum 10-fold cross validation.
According to the established risk scoring formula, the risk scores of 117 patients in the TCGA training cohort were calculated and divided into high-risk or low-risk groups with the median risk score as the cutoff point. Patient risk scores of the TARGET-AML and GSE37642 validation sets were also calculated based on the established risk scoring formula and grouped by median risk score. In the training cohort, the survival differences between the high-risk and low-risk groups were compared using Kaplan–Meier survival curves by the ‘survival’ R package and the ‘survminer’ R package. The accuracy of the model predictive capacity was analyzed using the time-dependent receiver operating characteristic (ROC) curve. Univariate and multivariate independent prognostic analyses were performed on the clinical feature information and risk scores to determine whether the prognostic model was worthwhile as a prognostic factor independent of other clinical traits. The TARGER-AML and GSE37642 databases were applied for validation, and the risk score calculation, survival analysis, time-ROC curves, and independent prognostic analysis were also conducted in the same way.
PPI network and GO and KEGG functional enrichment analyses
Differentially expressed genes (DEGs) were analyzed between the high-risk and low-risk groups in the TCGA training cohort by using the ‘DESeq2’ R package. The DEGs in the two groups with | log fold change (FC) | > 1.5 and P < 0.05 were considered as screened criterion. Afterward, a protein–protein interaction (PPI) network was constructed for the DEGs by using the STRING database (https://cn.string-db.org/) and displayed perfectly based on the CytoHubba plugin by using Cytoscape software (version v3.8.0) to screen key genes and subtypes of complex networks. Next, the ‘clusterProfiler’ R package was employed to comprehensively explore gene ontology (GO) and the Kyoto Encyclopedia of Genes and Genomes (KEGG) based on the DEGs [Citation15]. The GO analysis results for biological processes (BP), cellular components (CC), and molecular function (MF) terms and the results from the KEGG analysis are shown using bubble plots.
Tumor microenvironment and immune cell infiltration analysis
The ESTIMATE algorithm was performed based on the mRNA expression profile of TCGA-LAML samples using the ‘estimate’ R package to assess the content of infiltrating stromal cells and immune cells in the bone marrow microenvironment for the differences between high-risk and low-risk groups [Citation16].
The ‘GSVA’ R package was used to estimate enrichment scores for infiltration of 28 immune cell types in the bone marrow microenvironment for AML patients. Twenty-eight immune cell type gene sets (CellReports.txt) were retrieved from the TISIDB website (http://cis.hku.hk/TISIDB/)[Citation17]. The differences between the two groups were analyzed and visualized as boxplots using the ‘ggsci’ R package, the ‘tidyr’ R package, and the ‘ggpubr’ R package. P < 0.05 was considered to be statistically significant.
Drug sensitivity analysis
The processed RNA expression data (RNA: RNA-seq) and drug data (Compound activity: DTP NCI-60) were downloaded from the CellMiner database website (https://discover.nci.nih.gov/cellminer/home.do) [Citation18]. To ensure the reliability of the analysis results, we extracted drug data from patients who had undergone clinical trials and obtained FDA approval for drug sensitivity analysis. Cytarabine, daunorubicin, all-trans retinoic acid (ATRA), quizartinib and venetoclax are commonly used in the treatment of AML and were selected for drug sensitivity analysis. The ‘impute’ R package and ‘limma’ R package were used to analyze the correlation between 13 important ER stress-related genes and five drugs using Spearman’s correlation analysis.
Data analysis
Statistical analyses were conducted using R software (version 4.1.3) and SPSS (version 25.0). The rank sum test was performed to compare differences between the two groups. Spearman’s correlation was used to analyze the degree and correlation of the two variables in this study. Cox regression, LASSO regression, time ROC curves and independent prognostic analysis were used to assess the prognostic value of ER stress-related features. In this study, P < 0.05 was regarded as a significant difference.
Results
Patient characteristics in acute myeloid leukemia
As mentioned above, we acquired gene expression data and clinical information for all AML patients from the public databases TCGA, TARGET and GEO. As described in the methods, 117 AML samples from the TCGA-LAML dataset were considered the training cohort, while 119 samples from the TARGET-AML and 136 samples from the GSE37642-GPL570 matrix were regarded as the two validation cohorts. Independent prognostic analyses were based on the TCGA-LAML cohort, TARGET-AML and GSE37642-GPL570. A baseline data sheet with detailed clinical characteristics for all datasets is shown in Supplementary Table S1.
Construction and validation of the ER stress-related signature
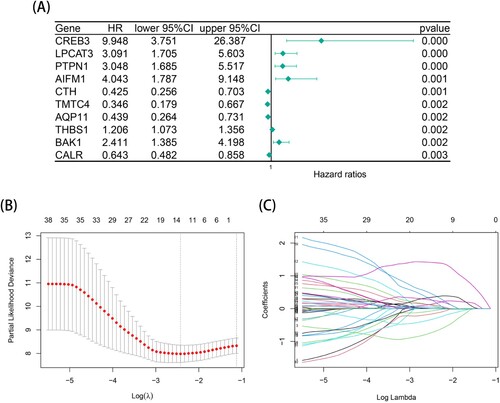
After data processing, univariate Cox regression analysis was performed on the 244 ER stress-related gene expression profiles in the TCGA-LAML training cohort; 42 ER stress-related genes filtered for significant survival (P < 0.05) were obtained. A shows a forest map of the top 10 prognosis-related genes with the smallest P values (complete information on the Cox regression analysis is shown in Supplementary Table S2). Then, to avoid overfitting the prognostic risk signature, LASSO regression was applied to establish a thirteen-gene risk signature in the training cohort for the subsequent analysis (B-C). We calculated the risk score of each AML patient in two cohorts as follows: Risk score = - MBTPS1 * 0.701855759761314 + SESN2 * 0.0781570368077238 + BCAP31 * 0.214480290597798 + CHAC1 * 0.104321138740694 - CALR * 0.0570706700651949 + UBE2G2 * 0.246821002736747 + EIF2AK4 * 0.411175009686761 + CREB3 * 1.4032339636556 + AIFM1 * 0.357587141777597 + WFS1 * 0.0389536211386651 – CTH * 0.306716876124533 + PTPN1 * 0.153167577191088 - TMTC4 * 0.147010435897367.
Figure 1. Construction of a thirteen-gene prognostic risk model in TCGA-LAML cohort. (A) A forest plot of the top 10 endoplasmic reticulum-related genes with prognostic significance using univariate cox regression analysis in TCGA-LAML cohort. (B) The optimal penalty parameter λ associated with the minimum 10-fold cross validation in the LASSO regression model. (C) The optimal coefficient of model gene of the LASSO regression model.
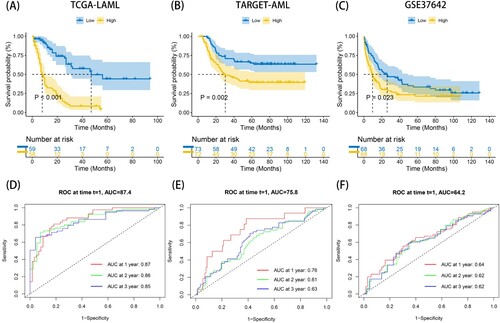
The ERs risk scores of AML patients in the training cohort and two validation cohorts were all calculated according to the above formula and divided into high-risk and low-risk groups by the median value of the risk score. As shown in A-C, the K-M survival curves of the TCGA training set, TARGET validation set and GSE37642 validation set all indicated that the low-risk group had an intuitive advantage of higher OS and lower mortality than the high-risk group (TCGA training set: P < 0.001, TARGET validation set: P = 0.002, GSE37642 validation set: P = 0.023). High-risk and low-risk groups were successfully separated from each other using the risk score curve. The survival state diagrams clearly showed that the number of deaths increased with the risk score. Then, the area under the time-dependent ROC curve (AUC) values were used to assess the predictive value of risk characteristics for survival in different cohorts, and the results indicated the excellent predictive performance of the risk signature (D-F). In the TCGA training set, the AUCs of the 1-year, 2-year, and 3-year AUCs were 0.87, 0.86 and 0.85, respectively. In the TARGET validation set, the AUCs of the 1-year, 2-year, and 3-year AUCs were 0.76, 0.61 and 0.63, respectively. Similarly, in the GSE37642 validation set, the AUCs of the 1-year, 2-year, and 3-year AUCs were 0.64, 0.62 and 0.62, respectively. The results on the two validation sets were not very satisfying, which was probably due to the differences in feature distributions between each dataset, but the two validation sets had good reproducibility.
Figure 2. Prognostic analysis of risk model in the training set (TCGA-LAML) and two validation sets (TARGET-AML and GSE37642). (A-C) The KM survival curves of high- and low- ERs risk score groups in TCGA-LAML, TARGET-AML and GSE37642 databases. (D-F) The time ROC curve analysis of the accuracy of the risk model of TCGA-LAML, TARGET-AML and GSE37642 databases to predict 1-, 2-, and 3-year OS.
ELN 2017 is widely used in risk stratification of AML patients, which can effectively predict the prognosis of patients. We then compared our ERs risk model with ELN 2017 in the TCGA-LAML cohort (Supplementary Figure S2). The results indicated that 88.5% of patients in the ELN-favorable group were reclassified into ERs low-risk group, 63.1% of patients in the ELN-intermediate group were reclassified into ERs high-risk group, and 50.0% of patients in the ELN-poor group were both reclassified into ERs high-risk and ERs low-risk groups. Here we also shown that the survival outcome of patients in the favorable group was better than that in the intermediate and poor groups.
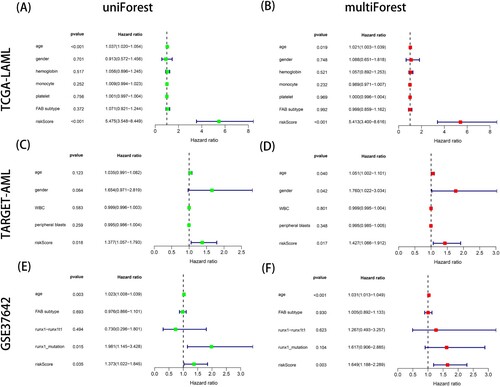
To further explore the clinical predictive capacity of the ERs risk score model, univariate and multivariate independent prognostic analyses were performed on the TCGA dataset, TARGET dataset and GSE37642 dataset. The results showed that the risk scores in the three cohorts were all significantly associated with the prognosis of AML patients in both univariate and multivariate independent prognostic analyses, with P < 0.05 (A-F). Therefore, these results illustrated that the risk score can be used as an independent predictor.
Figure 3. The independent prognostic analyses of combining risk score and clinicopathological characteristics in TCGA-LAML, TARGET-AML and GSE37642 datasets. (A-B) The left is univariate independent prognostic analysis and the right is multivariate independent prognostic analysis in TCGA-LAML dataset. (C-D) The left is univariate independent prognostic analysis and the right is multivariate independent prognostic analysis in TARGET-AML dataset. (E-F) The left is univariate independent prognostic analysis and the right is multivariate independent prognostic analysis in GSE37642 dataset. P < 0.05 indicates that the factor is associated with the overall survival of AML. HR > 1 indicates the factor is a high-risk factor which is negatively correlated with the prognosis of AML patients.
PPI, GO and KEGG analyses
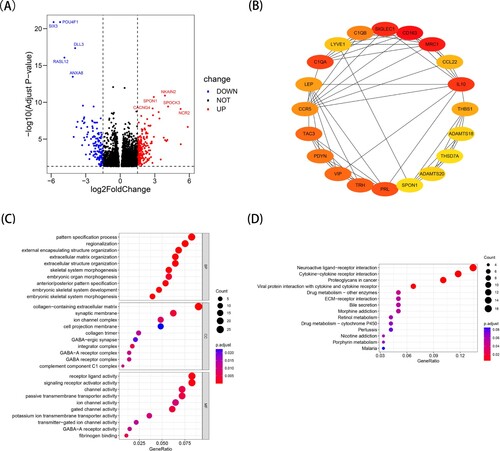
In the TCGA training cohort, a protein–protein interaction (PPI) network and functional enrichment analysis based on differentially expressed genes (DEGs) between the high-risk and low-risk groups were beneficial for screening hub genes and key signaling pathways. Using the ‘DESeq2’ R package, we obtained 332 differentially expressed genes (DEGs) after selecting | log fold change (FC) | > 1.5 and P < 0.05. There were 198 upregulated genes and 134 downregulated genes among the DEGs, and the volcano plot showed the top 5 gene names of the most obvious upregulated and downregulated genes (A). In addition, the top 20 hub genes with key nodes in 332 DEGs were calculated using the CytoHubba plugin of Cytoscape software (B). C-D show the top 10 most important terms in GO and the top 14 most important pathways in KEGG. According to the GO analysis, DEGs were significantly involved in the pattern specification process, regionalization and external encapsulating structure organization of biological processes (BP), including collagen-containing extracellular matrix, synaptic membrane and ion channel complex of cellular components (CC); furthermore, they showed receptor ligand activity, signaling receptor activator activity and channel activity of molecular function (MF) terms. The KEGG analysis showed that DEGs were involved in neuroactive ligand-receptor interactions, cytokine-cytokine receptor interactions and proteoglycans in cancer. The findings suggested that these differentially expressed genes may play a crucial role in tumor progression, biological metabolism and the tumor microenvironment of different subtypes of acute myeloid leukemia.
Figure 4. Identification of differentially expressed genes (DEGs) between the high- and low- ERs risk score groups in TCGA-LAML cohort. (A) The volcano map of DEGs. (B) The protein-protein interaction network analysis of the top 20 DEGs. (C) The results of Gene Ontology (GO) enrichment analysis. (D) The results of Kyoto Encyclopedia of Genes and Genomes (KEGG) enrichment analysis.
Tumor microenvironment and immune cell infiltration in the risk signature
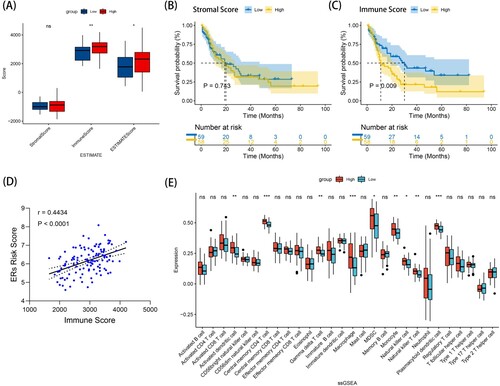
The bone marrow microenvironment profoundly affects the occurrence and development of leukemia. To further investigate the relationship between the ERs risk score model and the bone marrow microenvironment in the TCGA training set, we calculated stromal scores, immune scores, and ESTIMATE scores of each patient using the ESTIMATE algorithm. As shown in A, significant differences in immune scores and ESTIMATE scores were found between the high-risk group and the low-risk group (P < 0.01 and P < 0.05, respectively). To explore the relationship between immune score/stromal score and survival time of AML patients, 117 AML patients in TCGA-LAML were divided into a high immune score/stromal score group and a low immune score/stromal score group based on the median value of immune score and stromal score as the cutoff value. K-M survival analysis was used to compare the survival rates between the two groups. The results showed that the survival time of patients in the high stromal score group was shorter than that in the low stromal score group, but the difference was not significant (P = 0.743) (B). Importantly, the survival time of patients in the high immune score group was shorter than that in the low immune score group, and the difference was significant (P = 0.009) (C). We plotted the correlation curve between immune scores and ERs risk scores, and the results showed a positive correlation between immune scores and ERs risk scores (r = 0.4434, P < 0.0001) (D). Next, we performed a detailed analysis of the degree of infiltration of 28 immune cell types according to the ssGSEA algorithm and obtained 28 types of immune cell enrichment scores in the high- and low- ERs risk score groups. E shows that the immune infiltration scores of 28 types of immune cells in the high ERs risk score group were obviously different from those in the low ERs risk score group, such as central memory CD4 T cells, macrophages, plasmacytoid dendritic cells, activated dendritic cells, gamma delta T cells, natural killer T cells, monocytes, natural killer cells, and MDSCs (all P < 0.05). Moreover, the scores of these 9 immune cells in the high ERs risk score group were all higher than those in the low ERs risk score group. In conclusion, the high ERs risk score group had higher immune scores and a lower survival rate than the low ERs risk score group, suggesting that these ER stress-related genes may have a certain impact on the survival and prognosis of AML patients by mediating immune-related pathways.
Figure 5. The analysis of tumor-immune microenvironment and immune cell infiltration in TCGA-LAML cohort. (A) Stromal score, immune score, and ESTMATE Score were calculated through ‘estimate’ R package in high- and low- ERs risk score groups using wilcox test. (B) The KM survival curves of high-stromal score and low-stromal score groups. (C) The KM survival curves of high-immune score and low-immune score groups. (D) The relationship between immune score and ERs risk score in TCGA-LAML cohort. (E) Single-sample gene set enrichment analysis (ssGSEA) compares 28 immune cells between the high- and low- ERs risk score groups using wilcox test in TCGA-LAML cohort. *p < 0.05, **p < 0.01, ***p < 0.001.
Immune checkpoint analysis
In recent studies, the expression of common immune checkpoint molecules was often significantly upregulated in malignant tumors and was associated with poor prognosis. Therefore, we determined the gene expression levels of five common tumor immune checkpoint molecules (PD1, PD-L1, PD-L2, TIM-3 and CTLA-4) between the high- and low- ERs risk score groups using the Wilcoxon test. A showed that the expression levels of PD-L1, PD-L2 and CTLA4 in the high ERs risk score group were higher than those in the low ERs risk score group (P < 0.05). The reason for the poor prognosis in the high ERs risk score group may be due to the abnormally increased expression of these three immune checkpoint genes, which suppressed immune activation, resulting in the mechanism of immune escape.
Figure 6. Correlation between prognostic risk biomarkers and differential immune cells in TCGA-LAML cohort. (A) Difference between immune checkpoint related genes expression in high- and low- ERs risk score groups using wilcox test. (B) The correlation heatmap of among 13 prognostic model risk genes. (C) The correlation heatmap between the 13 model risk genes and 28 different immune infiltration cell types was calculated based on the Pearson correlation coefficient. *p < 0.05, **p < 0.01, ***p < 0.001.
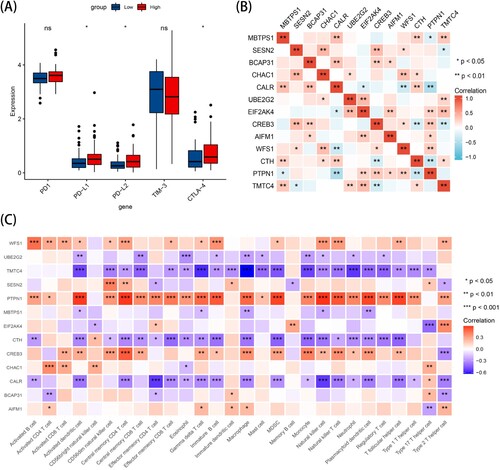
Interaction of 13 prognostic genes and correlation between the 13-gene signature and immune microenvironment
The products of genes, often in the form of proteins, interact with each other to regulate biological processes. To better investigate whether there were correlations among the 13 survival-related genes, we plotted a correlation heatmap to indicate interactions between the 13 survival-related genes using Spearman's correlation. Notably, there were significant positive or negative correlations between several genes (B). To further explore the interactions between the 13-gene signature and the immune infiltration of the microenvironment, we constructed a heatmap of the relationship between 13 prognosis-related genes and 228 immune infiltrating cells. Notably, in C, PTPN1 showed the most meaningful positive correlation with immune infiltration, especially with activated dendritic cells, central memory CD4 T cells and natural killer cells (all P < 0.001, r = 0.578, r = 0.583, r = 0.589, respectively). TMTC4 showed the most meaningfully negative correlation with immune infiltration, especially gamma delta T cells and macrophages (all P < 0.01, r = −0.571, r = −0.632, respectively) (Supplementary Table S3).
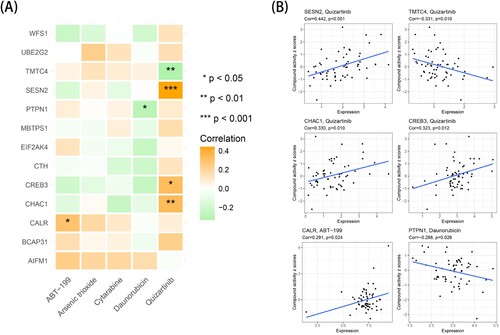
Sensitivity analysis between target genes and related drugs
Cytarabine, daunorubicin, arsenic trioxide, quizartinib and venetoclax, which are often used to treat AML, were selected for a correlation analysis with 13 model genes. As presented in A-B, the activity of quizartinib was positively correlated with the expression of SESN2, CHAC1 and CREB3, and the drug activity increased with the gene expression. In addition, the activity of quizartinib was negatively correlated with the expression of TMTC4, and the drug activity decreased with gene expression.
Figure 7. Drug sensitivity analysis of prognostic model genes in TCGA-LAML cohort. (A) The correlation analysis between the expression of 13 risk model genes and the drug activity of 5 drugs based on the Pearson correlation coefficient. (B) The scatter plot of the statistically significant correlation analysis. *p < 0.05, **p < 0.01, ***p < 0.001.
Discussion
Serving as the most common heterogeneous malignant clonal proliferative disease with the differentiation disorder of hematopoietic stem cells, acute myeloid leukemia (AML) is characterized by the accumulation of immature myeloid progenitor cells in the bone marrow or peripheral blood. High doses of chemotherapy, allogeneic hematopoietic stem cell transplantation, molecularly targeted therapies and immunotherapy improved the overall survival rate in AML patients [Citation19]. The poor prognosis and high mortality of AML patients, however, remain major challenges [Citation19].
The malignant growth and proliferation capacity of tumor cells create an unfavorable microenvironment characterized by hypermetabolic hypoxia nutrient restriction and acidosis, which in turn disrupts the homeostasis of calcium and lipids of the various cell types that inhabit this environment [Citation20]. In these cases, the unfolded protein response (UPR) is then activated in an attempt to restore intracellular endoplasmic reticulum homeostasis and adapt to tumor development [Citation20]. The PERK/ATF4/CHOP, IRE-1/XBP1 and ATF6 signaling pathways are three classic UPR pathways that play a pivotal role in relieving ER stress and maintaining cellular homeostasis [Citation21]. Related studies have demonstrated that sustained activation of PERK and prolonged expression of ATF4 under constant stress could induce cell apoptosis by promoting the transcription of CHOP [Citation6]. The IRE-1-XBP1 signaling pathway can suppress antitumor immune responses and provide opportunities for tumor formation [Citation22]. ATF6 expression is high in cervical cancer cells, and inhibition of ATF6 expression can reduce cell viability and migration and promote cell apoptosis by inhibiting Bcl-2 and increasing caspase-3 [Citation23]. These results suggest that ER stress has an essential role in cell survival and remodeling of the tumor microenvironment, and it is a potential novel target for AML therapy.
In this study, we extracted the expression profile of ER stress-related genes from the TCGA-LAML mRNA expression profile and finally established a prognostic model with 13 genes by univariate Cox regression analysis and LASSO regression analysis to calculate a risk score for each AML patient sample. Then, we divided patients into high-risk and low-risk groups by the median. The K-M survival curve showed a significant difference in survival time between the high- and low-risk groups, and the high-risk group had a shorter survival time and higher mortality than the low-risk group. We used the TARGET dataset and GSE37642 dataset for validation, and the survival analysis results were consistent with the conclusion of TCGA-LAML. In addition, the AUC values of the time-dependent ROC curve of the TCGA training set at 1, 2 years, and 3 years were all greater than 0.8, indicating that the risk signature model has good prediction accuracy. The AUC values of the time-dependent ROC curve of the TARGET and GSE37642 validation sets at 1, 2 years, and 3 years were approximately 0.6. However, the AUC values of the two validation sets were not very satisfactory, which could also show that the risk signature model has a certain prediction accuracy. This difference may be due to the data preprocessing and the background of the TCGA-LAML cohort, TARGET cohort and GSE37642 cohort, resulting in different cutoff values and biased prediction efficacy. What’s more, the ELN 2017 risk classification reminded us to identify ERs high-risk AML patients with poor overall survival compared with ERs low-risk AML patients. In our research, the 13-gene signature can further distinguish the heterogeneous subgroups in ELN-favorable and intermediate AMLs. Furthermore, the univariate and multivariate independent prognostic analyses in the three cohorts all indicated that the risk score was an independent prognostic predictor.
For elderly patients who cannot tolerate intensive chemotherapy, the combination of targeted molecular inhibitors and chemotherapy offers promising therapeutic prospects for these patients. However, we found that the gene expression of PD-L1, PD-L2 and CTLA4 was higher in the high-risk group than in the low-risk group, which may cause patients in the high-risk group have a poor response to targeted inhibitors of PD-L1, PD-L2 and CTLA4. Therefore, ER stress-related features can reflect the immune status of AML patients and highlight potential immunotherapy implications.
The bone marrow microenvironment of leukemia is of great significance to the development and survival of leukemia. In-depth research on the bone marrow microenvironment may reveal the biological processes of leukemia development and the molecular mechanism of drug resistance in leukemia. The composition of stromal cells and immune cells was analyzed to explore the differences in the bone marrow microenvironment of the high- and low- ERs risk score groups. Therefore, we further investigated the differences in the infiltration of 28 types of immune cells in the microenvironment between the two groups and found that the cellular infiltration of dendritic cells, macrophages, T cells, NK cells, monocytes, and MDSCs was significantly different. According to previous studies, reactive lipid peroxidation byproducts induced by the tumor microenvironment, such as 4-HNE, can induce endoplasmic reticulum stress in tumor-associated dendritic cells, in which triglycerides are increased due to sustained IRE1α-XBP1 pathway activation. The accumulation of abnormal lipids in cells inhibited the ability of tumor-associated dendritic cells to present local antigens to antitumor T cells [Citation22]. Endoplasmic reticulum-stressed dendritic cells have also been shown to overproduce the immunosuppressive lipid mediator prostaglandin E2 (PGE2) through the activation of the IRE1α-XBP1 pathway, suggesting that this may be the cause of tumor immune escape [Citation24]. The IRE1α-XBP1 branch has been identified to promote macrophage polarization to a mixed IIS phenotype, PD1 ligand 1 (PD-L1) expression, tumor invasion and immunosuppression of the tumor microenvironment [Citation25]. XBP1 expression is upregulated in T cells isolated from ovarian cancer patient samples, and XBP1 induces the regulation of the abundance of glutamine carriers, limiting the influx and exploitation of glutamine, which is necessary to maintain mitochondrial respiration in T cells under glucose deprivation conditions [Citation26]. Elimination of the activation of IRE1α-XBP1 or forced expression of the glutamine transporter can enhance mitochondrial respiration in human T cells exposed to ovarian cancer ascites [Citation26].
The correlation analysis of 13 key prognostic genes showed that these genes had a comprehensive impact on the prognosis and survival of AML patients with a complex network association. Further in-depth study revealed that the 13-gene signature was closely related to tumor-infiltrating immune cells. The expression of PTPN1 and CREB3 was positively correlated with most immune cell infiltration, whereas the expression of CALR, CTH and TMTC4 was negatively correlated with most immune cell infiltration. Interestingly, the gene expression levels of PTPN1 and CREB3 in the high- risk score group were higher than those in the low- risk score group. Protein tyrosine phosphatase 1B (PTP1B, also known as PTPN1) is a key regulator that controls metabolic homeostasis, cell proliferation, and the immune signaling pathway, and the deficiency of myeloid-specific PTP1B could promote the development of acute myeloid leukemia [Citation27]. CREB3, structurally similar to ATF6, is an endoplasmic reticulum membrane-bound basic leucine zipper transcription factor [Citation28]. CREB3 is upregulated in glioblastoma tissues and cell lines and regulates the proliferation, invasion and apoptosis of glioblastoma [Citation29]. Overexpression of CREB3 promotes the proliferation and invasion of SHG-44 cells, whereas downregulation of CREB3 inhibits cell invasion and induces cell apoptosis in U251MG cells [Citation29]. CALR is a calcium-binding protein in the endoplasmic reticulum that contributes to protein folding and the maintenance of cellular homeostasis implicated in calcium-dependent processes, such as adhesion and integrin signal transduction [Citation30]. Moreover, CALR plays a major role in ensuring normal antigen presentation of MHC class I molecules [Citation30]. The expression of cystathionine γ-lyase (CTH) increases hydrogen sulfide (H2S) levels, and H2S-mediated sulfhydration on cysteine-38 of the NF-κB p65 subunit results in activation of IL-1β signaling and promotion of prostate cancer cell invasion [Citation31]. TMTC4 is enriched in the endoplasmic reticulum and can alter endoplasmic reticulum calcium dynamics, leading to excess activation of the unfolded protein response (UPR) and cell death [Citation32]. Based on the genetic link between the UPR and hearing loss, this study elucidated a direct link between NIHL and the UPR [Citation32]. In addition, according to the drug sensitivity analysis result, the gene expression of SESN2, TMTC4, CHAC1 and CREB3 was correlated with the drug activity of quizartinib, which can be used as potential targets for drug treatment.
Overall, we constructed a reliable risk model to assess ER stress activation status and survival prognosis in AML patients. However, our study has some shortcomings. First, the total number of AML patients in the training cohort in the study was limited, and an in-depth study requires a larger dataset to validate our predictive model. Second, only analyzing target data from public databases through bioinformatics has certain limitations. Finally, biological experiments and clinical trials are needed to verify and support the screened genes and some of the conclusions.
Conclusion
In summary, based on the expression levels of ER stress-related genes in AML, we established an effective risk scoring model by bioinformatics analysis that has been validated as an independent prognostic factor for survival in AML patients. Furthermore, we performed functional enrichment analysis, tumor microenvironment and immune cell infiltration to explore possible pathways and the relationship between endoplasmic reticulum stress and immunity. We further found a connection between the expression levels of some prognostic model genes and drug activity, which may provide new methods for AML treatment.
yhem_a_2221101_sm7683.docx
Download MS Word (23.3 KB)Data availability statement
Publicly available datasets were analyzed in this article. These data can be found here: UCSC Xena website (https://xenabrowser.net/datapages/) and GEO database (https://www.ncbi.nlm.nih.gov/geo/).
Disclosure statement
No potential conflict of interest was reported by the author(s).
Additional information
Funding
References
- Marando L, Huntly BJP. Molecular landscape of acute myeloid leukemia: prognostic and therapeutic implications. Curr Oncol Rep. 2020;22(6).
- Shallis RM, Wang R, Davidoff A, et al. Epidemiology of acute myeloid leukemia: recent progress and enduring challenges. Blood Rev. 2019-07-01;36:70–87.
- Raymundo DP, Doultsinos D, Guillory X, et al. Pharmacological targeting of IRE1 in cancer. Trends Cancer. 2020;6(12):1018–1030.
- Limia C, Sauzay C, Urra H, et al. Emerging roles of the endoplasmic reticulum associated unfolded protein response in cancer cell migration and invasion. Cancers (Basel). 2019-05-06;11(5):631.
- Urra H, Dufey E, Avril T, et al. Endoplasmic reticulum stress and the hallmarks of cancer. Trends Cancer. 2016;2(5):252–262.
- Chen X, Cubillos-Ruiz JR. Endoplasmic reticulum stress signals in the tumour and its microenvironment. Nat Rev Cancer. 2021;21(2):71–88.
- Madden E, Logue SE, Healy SJ, et al. The role of the unfolded protein response in cancer progression: from oncogenesis to chemoresistance. Biol Cell. 2019;111(1):1–17.
- Khateb A, Ronai ZEA. Unfolded protein response in leukemia: from basic understanding to therapeutic opportunities. Trends Cancer. 2020;6(11):960–973.
- Siwecka N, Rozpędek W, Pytel D, et al. Dual role of endoplasmic reticulum stress-mediated unfolded protein response signaling pathway in carcinogenesis. Int J Mol Sci. 2019-09-05;20(18):4354.
- Kharabi Masouleh B, Chevet E, Panse J, et al. Drugging the unfolded protein response in acute leukemias. J Hematol Oncol. 2015;8:87.
- Féral K, Jaud M, Philippe C, et al. ER stress and unfolded protein response in leukemia: friend, Foe, or both? Biomolecules. 2021-01-30;11(2):199.
- Wang M, Kaufman RJ. The impact of the endoplasmic reticulum protein-folding environment on cancer development. Nat Rev Cancer. 2014;14(9):581–597.
- Li Z, Herold T, He C, et al. Identification of a 24-gene prognostic signature that improves the European LeukemiaNet risk classification of acute myeloid leukemia: an international collaborative study. J Clin Oncol. 2013-03-20;31(9):1172–1181.
- Liberzon A, Birger C, Thorvaldsdóttir H, et al. The molecular signatures database hallmark gene Set collection. Cell Syst. 2015;1(6):417–425.
- Yu G, Wang L, Han Y, et al. Clusterprofiler: an R package for comparing biological themes Among gene clusters. Omics: J Integr Biol. 2012;16(5):284–287.
- Yoshihara K, Shahmoradgoli M, Martínez E, et al. Inferring tumour purity and stromal and immune cell admixture from expression data. Nat Commun. 2013;4:2612.
- Ru B, Wong CN, Tong Y, et al. TISIDB: an integrated repository portal for tumor–immune system interactions. Bioinf. 2019-10-15;35(20):4200–4202.
- Reinhold WC, Sunshine M, Liu H, et al. Cellminer: a web-based suite of genomic and pharmacologic tools to explore transcript and drug patterns in the NCI-60 cell line Set. Cancer Res. 2012-07-15;72(14):3499–3511.
- Estey E, Hasserjian RP, Dohner H. Distinguishing AML from MDS: a fixed blast percentage may no longer be optimal. Blood. 2022-01-20;139(3):323–332.
- Cubillos-Ruiz JR, Bettigole SE, Glimcher LH. Tumorigenic and immunosuppressive effects of endoplasmic reticulum stress in cancer. Cell. 2017-02-09;168(4):692–706.
- Luo B, Lee AS. The critical roles of endoplasmic reticulum chaperones and unfolded protein response in tumorigenesis and anticancer therapies. Oncogene. 2013-02-14;32(7):805–818.
- Cubillos-Ruiz JR, Silberman PC, Rutkowski MR, et al. ER stress sensor XBP1 controls anti-tumor immunity by disrupting dendritic cell homeostasis. Cell. 2015;161(7):1527–1538.
- Liu F, Chang L, Hu J. Activating transcription factor 6 regulated cell growth, migration and inhibiteds cell apoptosis and autophagy via MAPK pathway in cervical cancer. J Reprod Immunol. 2020;139:103120.
- Chopra S, Giovanelli P, Alvarado-Vazquez PA, et al. IRE1α–XBP1 signaling in leukocytes controls prostaglandin biosynthesis and pain. Science. 2019-07-19;365(6450):eaau6499.
- Batista A, Rodvold JJ, Xian S, et al. IRE1α regulates macrophage polarization, PD-L1 expression, and tumor survival. Plos Biol. 2020-06-10;18(6):e3000687.
- Song M, Sandoval TA, Chae C, et al. IRE1α–XBP1 controls T cell function in ovarian cancer by regulating mitochondrial activity. Nature. 2018;562(7727):423–428.
- Le Sommer S, Morrice N, Pesaresi M, et al. Deficiency in protein tyrosine phosphatase PTP1B shortens lifespan and leads to development of acute leukemia. Cancer Res. 2018-01-01;78(1):75–87.
- Asada R, Kanemoto S, Kondo S, et al. The signalling from endoplasmic reticulum-resident bZIP transcription factors involved in diverse cellular physiology. J Biochem. 2011-05-01;149(5):507–518.
- Hu Y, Chu L, Liu J, et al. Knockdown of CREB3 activates endoplasmic reticulum stress and induces apoptosis in glioblastoma. Aging (Albany NY). 2019-10-13;11(19):8156–8168.
- Fucikova J, Spisek R, Kroemer G, et al. Calreticulin and cancer. Cell Res. 2021-01-01;31(1):5–16.
- Wang YH, Huang JT, Chen WL, et al. Dysregulation of cystathionine gamma-lyase promotes prostate cancer progression and metastasis. Embo Rep. 2019-10-04;20(10):e45986.
- Li J, Akil O, Rouse SL, et al. Deletion of Tmtc4 activates the unfolded protein response and causes postnatal hearing loss. J Clin Invest. 2018-11-01;128(11):5150–5162.