
ABSTRACT
Objective
Older patients with acute myeloid leukemia (AML) face a higher risk of death. This study analyzed the gene sequencing results of an elderly AML patient to provide new ideas for treatment.
Methods
This study performed single-cell RNA sequencing (scRNA-seq) bioinformatics analysis of blood cells in the peripheral blood and bone marrow of a 64-year-old AML-M5 patient before chemotherapy. The differentially expressed genes (DEGs) were identified, and functional enrichment analyses were performed.
Results
A total of 7990 and 123 DEGs were identified in monocytes and hematopoietic stem cells (HSCs), respectively. Among the top 40 DEGs analyzed, MYB showed high expression in peripheral blood monocytes, while 13 other tumor-related genes exhibited high expression in monocytes in the bone marrow. Peripheral blood and bone marrow HSCs had 6 and 12 highly expressed tumor-related genes respectively, including MCL1, JUN, and JUNB. These genes may form a interconnected network contributing to the progression and heterogeneity of AML, which can have an impact on patient treatment and prognosis.
Conclusions
In conclusion, when treating elderly AML patients, it is important to consider their individual characteristics in order to optimize treatment strategies.
Introduction
Acute myeloid leukemia (AML) is a malignant disease characterized by the abnormal expansion of myeloid hematopoietic stem/progenitor cells and a halt in their differentiation [Citation1]. The reported incidence of AML ranges from 0.91 to 5.4 per 100,000 person-years, though this may be underestimated due to variations in population and diagnostic criteria [Citation1–3]. A large, retrospective study reported that the incidence of AML diagnosis with ICD code was estimated at 29.0 per 100,000 person-year for those ≥65 years-old population [Citation4]. These findings highlight that AML is relatively more common among older adults, with a tenfold higher incidence compared to those under 65 years old [Citation1]. The median age of AML diagnosis is 68 years [Citation5]. Furthermore, the age at diagnosis is a crucial factor influencing the prognosis of AML patients. In the United States, the 2-year overall survival of patients with AML by diagnostic age of 60–64 years and 65–69 years was 32.8% and 24.8%, and 5-year overall survival was 22.0% and 13.5% [Citation1]. One of the key elements impacting AML prognosis is the patient’s ability to receive appropriate anti-leukemic therapy [Citation5]. Elderly patients (≥ 65 years-old) have higher treatment-related mortality (29%) when treated with intensive chemotherapy [Citation6]. However, less intensive therapy is not conducive to patient remission and long-term prognosis [Citation7]. Therefore, precision medicine should be considered for elderly AML patients.
In clinical practice, precision medicine pursues the precise selection and application of appropriate treatment methods for each patient to minimize the medical source of damage, minimize medical costs and maximize patient benefits. To develop a treatment plan suitable for an individual patient, precision medicine approaches analyze patients’ circulating DNA (liquid biopsy), as well as immune markers and other biologic features [Citation8]. The emergency of next-generation single-cell RNA sequencing (scRNA-seq) has revolutionized the field. This technique allows for the identification of complex and rare cell populations, the uncovering of regulatory relationships between genes, and the tracking of distinct cell lineages during development [Citation9, Citation10]. scRNA-seq gives the opportunity of screening a broader set of genes in one comprehensive test, and has brought great inspiration for individualized treatment of patients and maybe improve prognosis [Citation10]. However, few studies related to gene expression comparing peripheral blood and bone marrow samples in AML have been reported in recent years.
Elderly patients with AML tend to have poorer prognoses than younger ones, but evidence-based medicine for precision medicine in this area is still lacking. As a result, it is crucial to explore and investigate genetic characteristics as a potential avenue for advancements. In this study, an scRNA-seq bioinformatics analysis was conducted on blood cells from both the peripheral blood and bone marrow of a 64-year-old patient diagnosed with AML-M5. The investigation revealed several high expression genes associated with malignancy in patient monocytes and hematopoietic stem cells (HSCs) in both peripheral blood and bone marrow. These findings present exciting new possibilities for individualized treatment approaches for these patients.
Materials and methods
Data
The patient data in this study was from the Department of Hematology, Foshan First People’s Hospital. The patient was diagnosed with AML-M5 (acute monocytic leukemia) in September 2021. The patient underwent scRNA-seq bioinformatics analysis of blood cells in peripheral blood and bone marrow prior to treatment.
Data preparation and preprocessing
The BD Rhapsody Analysis pipeline and the BD AbSeq Ab-Oligos Panel were used to quantify fastq data for scRNA-seq analysis of the samples in this study. The quantified data were then compared to the human reference genome hg19 to obtain a matrix of raw counts.
During data preprocessing, the raw count matrix was imported into the scater 1.18.6, and the median absolute deviation (MAD) was used to determine outliers [Citation11]. In this study, we used below/above 3 times MAD as the filter condition, thus filtering out those outliers in the quality control. To eliminate differences in gene expression between cells based on count data, a global scaling normalization method, LogNormalize, was applied to normalize the measurements of characteristic expression per cell as well as the total expression. Then, according to the coefficient of variation, 2000 genes with high variation were extracted by VST method. After multiple samples were integrated using the IntegrateData function, the data were scaled by a linear transformation to ensure that each gene was given the same weight, with a mean of 0 and a variance of 1. In order to reduce the computational burden and noise in the data, principal component analysis (PCA) was used for initial dimensionality reduction. Initial dimensionality reduction of Ab-seq data used ‘apca’. We used the functions of the FindNeighbors and FindClusters in the Seurat 4.1.0 package [Citation12] to perform cluster analysis on cells from samples of peripheral blood and bone marrow, respectively. Visualize the data used two nonlinear dimensionality reduction methods, TSNE and UMAP.
Cell type annotation
After obtaining stable cell subsets, we used Wilcoxon in Seurat’s FindAllMarkers function with avg_log2FC to determine polygenic differences between cell groups and other groups. Find out which cell type marker genes in a subgroup of differential genes (one to others) were consistent with those in PanglaoDB and CellMarker databases. Identified the types of cell subsets based on their expression levels, as well as the expression of marker genes of each predicted cell subset in the literature in the target subset. Additionally, the identified cell types were validated using the SingleR algorithm in the SingleR 1.0.5 package [Citation13].
Differentially expressed gene (DEGs) analysis
We used Wilcoxon’s in the FindMarkers function to identify DEGs between the specified two groups of cells. Genes with the value of p_val_adj less than 0.05 and an absolute value of avg_log2FC greater than 0.25 were screened out for visualization.
Differential gene enrichment analysis
We screened out DEGs with p_val_adj less than 0.05 and the absolute value of avg_log2FC greater than 0.25 and used the clusterProfiler 3.18.1 package [Citation14] to perform enrichment analysis based on GO and KEGG. Searched for the common functions and related pathways of a large number of genes in the DEGs set, and mined the biological significance represented by the gene set.
Results
The characteristics of this elderly patient with AML-M5
The patient was diagnosed with AML-M5 in September 2021. Karyotype presented as 47, XX, t(1;3)(p36;q21), +8[20]. The genetic screening was conducted before the patient underwent chemotherapy. Genetic screening tests reported no mutations in genes associated with genetic susceptibility to myeloid tumors, such as CBL, CEBPA, ETV6, NF1, PTPN11, and RUNX1. The patient received the chemotherapy regimen of ‘venetoclax and azacytidine’. During the period of treatment, the patient presented with agranulocytosis, anemia, etc. Therefore, venetoclax was discontinued and performed treatment such as anti-infectives, blood transfusions, and control infection. Thereafter, the condition of the patient was improved. About 2 months later, the patient was given ‘venetoclax and azacytidine’ chemotherapy regimen again. During the treatment, the patient presented fever (38°C) and oral mucosal blood vesicles. The results of the blood test showed that the white blood cell count was 1.22 × 10⁹/L, the red blood cell count was 2.37 × 10¹²/L, the hemoglobin concentration was 69 g/L, the platelet count was 10 × 109/L, and the absolute value of neutrophils was 0.34 × 10⁹/L. At that time, the patient’s primary diagnosis was AML-M5 (47, XX, t(1;3)(p36;q21), +8[20]), myelosuppression after chemotherapy, and agranulocytosis with fever. Therefore, further treatment of this patient was challenging.
Overview of results based on scRNA-seq analysis
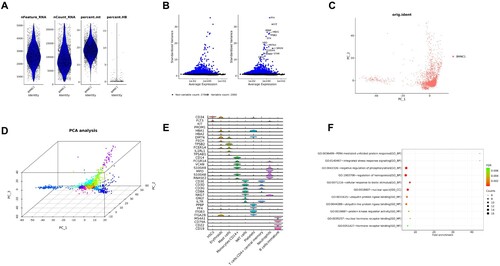
An overview of the results of this study based on scRNA-seq analysis is shown in . In order to reduce downstream analysis errors, we filtered out low-quality cells through cell-level quality control. (A) shows the violin plot of bone marrow samples after quality control. After logarithmic normalization, we extracted genes with a relatively large coefficient of variation among cells, that is, highly variable genes, there were 2,000 ((B)). Next, we used these genes for cluster analysis to reduce the error caused by genes that were not expressed in most cells. In addition, the results of PCA showed that the cells were evenly distributed in the sample, and there were no clumped cells and particularly abnormal cells ((C,D)). We compared the marker genes of the subpopulation with the marker genes of the cell type in the database to determine the type of the cell subpopulation. The common maker genes in blood cells were screened to draw a violin diagram, as shown in (E). Based on the above preliminary analysis results, we further carried out DEGs enrichment analysis ((F)), and the detailed results are shown in the following paragraphs.
Figure 1. Overview of single-cell sequencing-based analysis of monocytes and HSCs in peripheral blood and bone marrow. (A) Violin diagram of bone marrow cells after quality control. (B) Selection of highly variable genes. (C) Principal component analysis. (D) 3D PCA plot after cluster analysis. (E) Cell type identification and annotation. (F) Enrichment analysis of DEGs.
Analysis of monocytes in peripheral blood and bone marrow
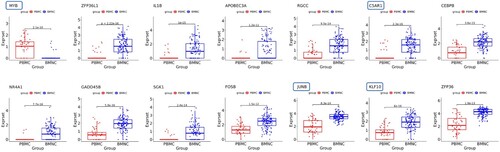
Since the patient was AML-M5, we primarily analyzed the DEGs of monocytes in peripheral blood and bone marrow. A total of 7990 DEGs were identified. (A) shows the heatmap of the top 40 DEGs in monocytes compared to peripheral blood with bone marrow. There were 20 DEGs that presented significantly higher/lower expression in peripheral blood than in bone marrow. Among these 40 DEGs, there were 14 genes that significantly correlated with the occurrence and development of tumors or malignant tumors such as MYB Proto-Oncogene (MYB), Regulator Of Cell Cycle (RGCC), and JunB Proto-Oncogene (JUNB) (). Genes associated with hematological malignancies included Complement C5a Receptor 1 (C5AR1) and Kruppel Like Factor 10 (KLF10) in addition to MYB and JUNB. In addition, several genes are closely linked to each other, such as Elastase (ELANE) is an important paralog of Proteinase 3 (PRTN3), Cathepsin G (CTSG) is an important paralog of Azurocidin 1 (AZU1), and ZFP36 Ring Finger Protein Like 1 (ZFP36L1) and ZFP36 Ring Finger Protein (ZFP36) belong to the same family of RNA-binding proteins involved in messenger RNA (mRNA) metabolism pathways.
Figure 2. (A) Heatmap of the top 40 DEGs in monocytes compared to peripheral blood with bone marrow. (B) Heatmap of the top 40 DEGs in HSCs compared peripheral blood with bone marrow.
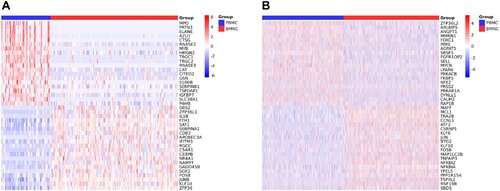
Figure 3. Tumor-associated DEGs in monocytes. Framed genes associated with hematologic malignancies.
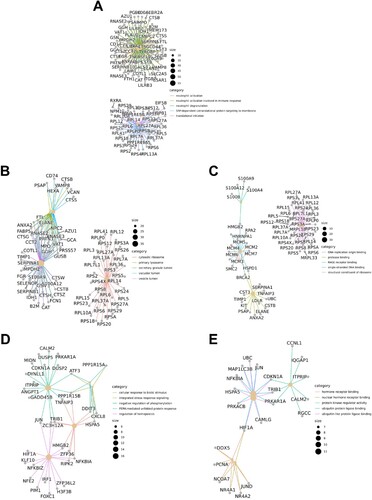
In order to uncover the common functions and related pathways of a large number of genes in the DEG set of monocytes compared peripheral blood with bone marrow, we performed the enrichment analysis subsequently ((A–D)). Results of GO showed that the pathways correlated with biological process were SRP-dependent co-translational protein targeting to membrane, neutrophil activation involved in immune response, translational initiation, neutrophil activation, and neutrophil degranulation. The pathways correlated with cellular components were cytosolic ribosome, secretory granule lumen, vesicle lumen, vacuolar lumen, and primary lysosome. The pathways correlated with molecular functions were structural constituent of ribosome, DNA replication origin binding, RAGE receptor binding, single-stranded DNA binding, and protease binding. These may indicate that the patient’s monocytes continue to develop after migration to the peripheral blood from the bone marrow, and participated in the immune response and immune disorder process, and the cells’ own metabolism and function are vigorous. Further analysis showed that the above-mentioned key signaling pathways were associated or interacted with multiple genes/molecules ((A–C)).
Figure 4. (A)–(D) Enrichment analysis of monocytes. (A) and (B) show bubble and bar charts for enrichment analysis of GO. (C) and (D) show bubble and bar charts for enrichment analysis of KEGG. GO consists of three parts: biological process (BP), molecular functions (MF), cellular components (CC). The length of the bar represents the level of the adjusted P-value (-log10(FDR)), and the longer the bar, the more significant it is. The size of the point represents the number of genes, and the color represents the adjusted P-value (FDR). (E)–(H) Enrichment analysis of HSCs. (E) and (F) show bubble and bar charts for enrichment analysis of GO. (G) and (H) show bubble and bar charts for enrichment analysis of KEGG.
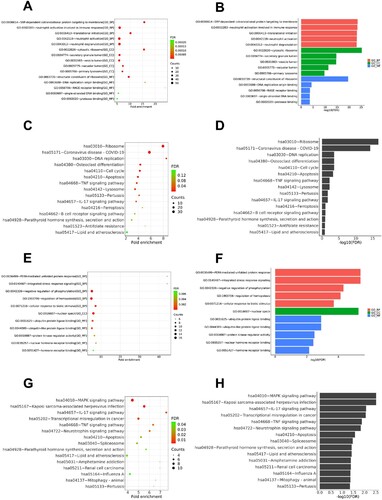
Figure 5. (A)–(C) DEGs network of monocytes after enrichment analysis. (A) Biological process. (B) Cellular components. (C) Molecular functions. (D)–(E) DEGs network of HSCs after enrichment analysis. (D) Biological process. (E) Molecular functions.
Analysis of HSCs in peripheral blood and bone marrow
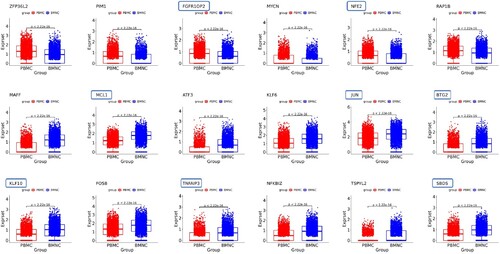
Since most leukemias, especially myeloid leukemia, are directly or indirectly related to HSCs abnormalities, we analyzed the patient data of HSCs in peripheral blood and bone marrow. A total of 123 DEGs were identified. (B) shows the heatmap of top 40 DEGs in HSCs compared peripheral blood with bone marrow. Among them, there were 20 DEGs with significantly higher or lower expression in peripheral blood than in bone marrow, respectively. Eighteen of these 40 DEGs were strongly associated with tumors or malignancies, and 8 genes were strongly associated with hematological malignancies or tumors, including FGFR1 Oncogene Partner 2 (FGFR1OP2), Nuclear Factor Erythroid 2 (NFE2), Myeloid Cell Leukemia-1 (MCL1) Apoptosis Regulator, Jun Proto-Oncogene (JUN), BTG Anti-Proliferation Factor 2 (BTG2), Kruppel Like Factor 10 (KLF10), TNF Alpha Induced Protein 3 (TNFAIP3), and SBDS Ribosome Maturation Factor (SBDS) (). Compared the genes in HSCs in peripheral blood with bone marrow, 12 genes related to malignant tumors were highly expressed in HSCs in bone marrow (6 in peripheral blood), and 6 genes related to hematological malignancies (2 in peripheral blood). This probably suggested that in primitive HSCs (bone marrow), malignant cells developed a more complex molecular network to promote the occurrence and progression of AML.
Figure 6. Tumor-associated DEGs in HSCs. Framed genes associated with hematologic malignancies.
We further analyzed the pathways enrichment of HSCs and compared peripheral blood with bone marrow ((E–H)). Results of GO showed that the pathways correlated with the biological process were PERK-mediated unfolded protein response, integrated stress response signaling, negative regulation of phosphorylation, regulation of hemopoiesis, and cellular response to the biotic stimulus. The pathways correlated with cellular components were nuclear specks. The pathways correlated with molecular functions were ubiquitin protein ligase binding, ubiquitin-like protein ligase binding, protein kinase regulator activity, nuclear hormone receptor binding, and hormone receptor binding. Results of KEGG showed that several pathways related to malignancy were active in peripheral blood HSCs, such as the MAPK signaling pathway, transcriptional mis-regulation in cancer, and TNF signaling pathway. (D) and (E) shows the network of DEGs in pathways of biological processes and molecular functions. Some genes formed key nodes linking various pathways, such as JUN, PPP1R15B, and PRKAR1A.
Discussion
AML treatments, including combination chemotherapy, are commonly selected based on various prognostic factors, such as clinical, hematological, and genetic considerations of the patient [Citation15]. Prognostic criteria, influenced by factors like age and clinical and genetic features, significantly impact the chances of survival for AML patients. Nonetheless, the standard-of-care treatments are unfortunately unable to provide lasting benefits for the majority of patients [Citation16]. However, with the advancement of sequencing technologies, there is a growing emphasis on tailoring AML treatments to the individual characteristics of each patient, allowing for the implementation of precision treatment strategies [Citation15]. Recent study by Galen et al. provided single-cell technologies and an atlas of AML cell states, regulators, and markers with implications for precision medicine and immune therapies [Citation17]. Nevertheless, in the clinical setting, there remains a dearth of ample validation and real-world experience regarding the implementation of precision diagnosis and treatment approaches reliant on sequencing outcomes. The present study analyzed the data of scRNA-seq of a 64-year-old AML-M5 patient. This patient developed severe myelosuppression after 2 chemotherapy sessions, and with the patient being elderly, further treatment strategies need to be considered. Analysis results showed that multiple genes associated with hematological malignancies were highly expressed in peripheral blood and bone marrow monocytes and HSCs. These genes may be involved in a certain link in the progression of AML or may be networked together to promote the progression and variation of AML. The scRNA-seq results have revealed noteworthy disparities in differential gene expression between monocytes and HSCs, both in peripheral blood and bone marrow. These findings strongly indicate the involvement of distinct sets of DEGs in the progression of AML. However, this diversity also presents challenges in terms of accurately targeting and treating patients with precision. Therefore, various factors should be comprehensively considered and develop treatment strategies based on the weighting of targets.
The patient of this study was AML-M5. Therefore, exploring the molecular expression characteristics of monocytes, as well as the evolution and differences of monocytes from the bone marrow to the peripheral blood, may shed light on individualized treatment of the patient. Analysis of monocytes showed a significant increase in the expression of MYB in the peripheral blood compared to the bone marrow. This finding holds promise for advancing our understanding of AML-M5. The MYB gene encodes a protein with three HTH DNA-binding domains that function as a transcription regulator, which plays an essential role in the regulation of hematopoiesis [Citation18]. Importantly, MYB is recognized as an oncogene and may undergo aberrant expression, rearrangement, or translocation in leukemias and lymphomas [Citation18]. Recent studies have highlighted the significant role of MYB in the treatment and prognosis of AML. Wang et al. conducted a study that constructed a lncRNA-miRNA-mRNA competing endogenous (ceRNA) network, consisting of 108 lncRNAs, 10 miRNAs, and 8 mRNAs, which could potentially serve as prognostic biomarkers for AML [Citation19]. Among the network, a survival model with 8 target mRNAs including the MYB was set up for AML prognostic prediction, and the AUC was 0.831 [Citation19]. MYB as a therapeutic target for AML patients has also been reported in recent studies. A study by Xu et al. showed that ectopic expression of the TAF4 histone-fold fragment could efficiently squelch TAF12 in cells, and suppress MYB, leading to AML regression in mice [Citation20]. This provides a potential strategy for effective MYB inhibition in AML by targeting a general coactivator complex to neutralize this oncogenic transcription factor [Citation20]. Furthermore, focusing on MYB as a potential target gene, the therapeutic use of homoharringtonine may be considered, as it has been associated with reduced levels of MYB and various oncogenes [Citation21]. In addition, the natural compound helenalin acetate may inhibit the viability and induce cell death and differentiation of AML cells by disrupting the transcriptional module formed by MYB, CCAAT-box/enhancer binding protein β (C/EBPβ), and p300 [Citation22].
The findings of this study revealed that among the blood cells (monocytes and HSCs) of this AML patient, a total of 31 oncogenes exhibited high expression levels, with 12 of them being linked to hematological malignancies. Therefore, in addition to MYB of monocytes in peripheral blood being the main focused one, other oncogenes associated with hematological malignancies maybe also be analyzed comprehensively.
MCL1 is located on chromosome 1p21.2 and is a member of the B-cell lymphoma 2 (BCL2) family. Its upregulation plays a vital role in the differentiation of myeloblastic leukemia cells into monocytes or macrophages, while its downregulation leads to apoptosis [Citation23]. In human cancer, one of the most prevalent abnormalities is the over-expression of the anti-apoptotic gene MCL1. This aberration is observed across various hematologic malignancies and is associated with a poor prognosis, high tumor grade, and frequently acts as a primary resistance mechanism against treatment with the BCL2 inhibitor venetoclax [Citation24, Citation25]. The recent study showed that venetoclax resistance can arise due to intrinsic molecular/metabolic properties of monocytic AML cells and that such properties can potentially be targeted with alternative strategies [Citation26]. In the present study, it was observed that MCL1 expression was significantly elevated in HSCs within the bone marrow of this AML-M5 patient, indicating its potential role in the underlying pathogenesis. Despite findings suggesting that prolonged exposure to venetoclax can upregulate MCL-1 and BCL-XL, leading to acquired resistance, this protein offers significant therapeutic implications [Citation27]. Thus, it presents a novel consideration for patient treatment strategies. Combining venetoclax with chemotherapeutic agents like daunorubicin or cytarabine has shown promise in partially reversing the sequestration of pro-apoptotic protein BIM (BCL2 like 11) mediated by MCL1, thereby increasing the sensitivity of myeloblasts to venetoclax [Citation28]. In addition, clinical trials have commenced for several MCL1 inhibitors. AZD5991, for instance, exhibited potential efficacy in pre-clinical AML and multiple myeloma models when combined with venetoclax or bortezomib, respectively [Citation29, Citation30]. VU661013, a brand-new, and selective MCL1 inhibitor, is effective in venetoclax-resistant cells and patient-derived xenografts disrupts the BIM/MCL1 interaction and induces apoptosis in AML [Citation24, Citation31]. By combining this novel MCL1 inhibitor with the potent BCL2 inhibitor venetoclax, it may be possible to selectively induce apoptosis either through their combination or by thoughtfully sequencing their administration based on a rational evaluation of AML [Citation24].
Other differentially expressed genes (DEGs) closely associated with hematological malignancies have the potential to impact the development of treatment strategies for patients. The protein-coding genes JUN and JUNB, which are subunits of the AP-1 transcription factor, have been linked to hematological malignancies like primary cutaneous T-cell lymphoma and anaplastic large cell lymphoma [Citation32, Citation33]. Our study revealed significantly higher expression of JUNB in monocytes and JUN in hematopoietic stem cells (HSCs) within the bone marrow compared to peripheral blood. JUN is a protein-coding gene, which can induce oncogenic transformation [Citation34]. JUNB is located in the nucleoplasm and is involved in the positive regulation of transcription by RNA polymerase II [Citation33]. As AML is a heterogeneous cancer, Romine et al.’s investigation delved into the sensitivity of bromodomain and extra-terminal domain inhibitors (BETi) using the Beat AML functional genomic dataset. They conducted genome-wide CRISPR screens on BETi-sensitive and BETi-resistant AML cells, finding that both methods identified SPI1, JUNB, FOS, and aryl-hydrocarbon receptor signaling (AHR/ARNT) as regulators of monocytic differentiation and determinants of the BETi response. Consequently, monocytic AML patients may exhibit greater sensitivity to BETi and venetoclax therapy [Citation35]. Moreover, JUNB was identified as a direct target of microRNA-149*, which is highly expressed in leukemia cells. MicroRNA-149* may act as an oncogenic regulator in T-cell acute lymphoblastic leukemia by negatively regulating JUNB [Citation36]. This focus on JUNB could potentially serve as a promising treatment strategy for AML.
In addition to the genes discussed above, there were several oncogenes in the rank of DEGs, but it was not advisable to enumerate them all. This is also related to the limitations of this study. The specific mechanisms and weights of these genes in affecting AML progression and variation remain to be revealed by a large number of studies. On the other hand, due to the ambiguous level of evidence, the current analysis results still have a long way to go before they can be used clinically. The lack of experimental validation is also one of the limitations of this study. We plan to further explore the genes associated with AML through molecular experiments in our subsequent work.
Conclusion
Treating elderly patients with AML presents unique challenges, as the outcome and prognosis can be uncertain due to factors like age and underlying medical conditions. In light of these complexities, adopting a precision medicine approach may be more suitable in the clinical management of cancer patients. By combining evidence-based treatment with individualized care, we can potentially offer added advantages to patients in their journey towards recovery.
Acknowledgements
XX carried out the experiments and performed the bioinformatics analysis. XM and YH searched the literature. QY confirm the authenticity of all the raw data. ZY designed the study and drafted the manuscript. All authors read and approved the final manuscript. The study protocol was approved by the Ethics Committees. All patients submitted informed consent for tissue use. All participants consented to publish the paper.
Disclosure statement
No potential conflict of interest was reported by the author(s).
Additional information
Funding
References
- Shallis RM, Wang R, Davidoff A, et al. Epidemiology of acute myeloid leukemia: recent progress and enduring challenges. Blood Rev 2019;36:70–87. DOI:10.1016/j.blre.2019.04.005. PubMed PMID: 31101526.
- Ostgard LS, Norgaard JM, Severinsen MT, et al. Data quality in the Danish National Acute Leukemia Registry: a hematological data resource. Clin Epidemiol. 2013;5:335–344. DOI:10.2147/CLEP.S48411. PubMed PMID: 24039451; PubMed Central PMCID: PMC3770716.
- Bekadja MA, Hamladji RM, Belhani M, et al. A population-based study of the epidemiology and clinical features of adults with acute myeloid leukemia in Algeria: report on behalf of the Algerian Acute Leukemia Study Group. Hematol Oncol Stem Cell Ther. 2011;4(4):161–166. DOI:10.5144/1658-3876.2011.161. PubMed PMID: 22198187.
- Turbeville S, Francis KM, Behm I, et al. Prevalence and incidence of acute myeloid leukemia may be higher than currently accepted estimates among the ≥65 year-old population in the United States. Blood. 2014;124(21):958. DOI:10.1182/blood.V124.21.958.958
- Short NJ, Rytting ME, Cortes JE. Acute myeloid leukaemia. Lancet. 2018;392(10147):593–606. DOI:10.1016/S0140-6736(18)31041-9. PubMed PMID: 30078459.
- Kantarjian H, O'Brien S, Cortes J, et al. Results of intensive chemotherapy in 998 patients age 65 years or older with acute myeloid leukemia or high-risk myelodysplastic syndrome: predictive prognostic models for outcome. Cancer. 2006;106(5):1090–1098. DOI:10.1002/cncr.21723. PubMed PMID: 16435386.
- Ossenkoppele G, Lowenberg B. How I treat the older patient with acute myeloid leukemia. Blood. 2015;125(5):767–774. DOI:10.1182/blood-2014-08-551499. PubMed PMID: 25515963.
- Tsimberidou AM, Fountzilas E, Nikanjam M, et al. Review of precision cancer medicine: evolution of the treatment paradigm. Cancer Treat Rev 2020;86:102019. DOI:10.1016/j.ctrv.2020.102019. PubMed PMID: 32251926; PubMed Central PMCID: PMC7272286.
- Hwang B, Lee JH, Bang D. Author correction: single-cell RNA sequencing technologies and bioinformatics pipelines. Exp Mol Med 2021;53(5):1005. DOI:10.1038/s12276-021-00615-w. PubMed PMID: 34045654; PubMed Central PMCID: PMC8178331.
- Morganti S, Tarantino P, Ferraro E, et al. Next generation sequencing (NGS): a revolutionary technology in pharmacogenomics and personalized medicine in cancer. Adv Exp Med Biol 2019;1168:9–30. DOI:10.1007/978-3-030-24100-1_2. PubMed PMID: 31713162.
- McCarthy DJ, Campbell KR, Lun AT, et al. Scater: pre-processing, quality control, normalization and visualization of single-cell RNA-seq data in R. Bioinformatics. 2017;33(8):1179–1186. DOI:10.1093/bioinformatics/btw798. PubMed PMID: 28088763; PubMed Central PMCID: PMC5408845.
- Stuart T, Butler A, Hoffman P, et al. Comprehensive integration of single-cell data. Cell. 2019;177(7):1888–1902. DOI:10.1016/j.cell.2019.05.031. PubMed PMID: 31178118; PubMed Central PMCID: PMC6687398.
- Aran D, Looney AP, Liu L, et al. Reference-based analysis of lung single-cell sequencing reveals a transitional profibrotic macrophage. Nat Immunol 2019;20(2):163–172. DOI:10.1038/s41590-018-0276-y. PubMed PMID: 30643263; PubMed Central PMCID: PMC6340744.
- Yu G, Wang LG, Han Y, et al. clusterProfiler: an R package for comparing biological themes among gene clusters. Omics. 2012;16(5):284–287. DOI:10.1089/omi.2011.0118. PubMed PMID: 22455463; PubMed Central PMCID: PMC3339379.
- Dohner H, Wei AH, Lowenberg B. Towards precision medicine for AML. Nat Rev Clin Oncol. 2021;18(9):577–590. DOI:10.1038/s41571-021-00509-w. PubMed PMID: 34006997.
- Dohner H, Estey E, Grimwade D, et al. Diagnosis and management of AML in adults: 2017 ELN recommendations from an international expert panel. Blood. 2017;129(4):424–447. DOI:10.1182/blood-2016-08-733196. PubMed PMID: 27895058; PubMed Central PMCID: PMC5291965.
- van Galen P, Hovestadt V, Wadsworth Ii MH, et al. Single-cell RNA-Seq reveals AML hierarchies relevant to disease progression and immunity. Cell. 2019;176(6):1265–1281. DOI:10.1016/j.cell.2019.01.031. PubMed PMID: 30827681; PubMed Central PMCID: PMC6515904.
- Information NCfB. MYB proto-oncogene, transcription factor [Homo sapiens (human)] National Library Medicine2022 [updated 5-Aug-2022].
- Wang JD, Zhou HS, Tu XX, et al. Prediction of competing endogenous RNA coexpression network as prognostic markers in AML. Aging. 2019;11(10):3333–3347. DOI:10.18632/aging.101985. PubMed PMID: 31164492; PubMed Central PMCID: PMC6555472.
- Xu Y, Milazzo JP, Somerville TDD, et al. A TFIID-SAGA perturbation that targets MYB and suppresses acute myeloid leukemia. Cancer Cell. 2018;33(1):13–28. DOI:10.1016/j.ccell.2017.12.002. PubMed PMID: 29316427; PubMed Central PMCID: PMC5764110.
- Mill CP, Fiskus W, DiNardo CD, et al. Effective therapy for AML with RUNX1 mutation by cotreatment with inhibitors of protein translation and BCL2. Blood. 2022;139(6):907–921. DOI:10.1182/blood.2021013156. PubMed PMID: 34601571; PubMed Central PMCID: PMC8832475.
- Klempnauer KH. C/EBPbeta sustains the oncogenic program of AML cells by cooperating with MYB and co-activator p300 in a transcriptional module. Exp Hematol 2022;108:8–15. DOI:10.1016/j.exphem.2022.01.003. PubMed PMID: 35032593.
- Sancho M, Leiva D, Lucendo E, et al. Understanding MCL1: from cellular function and regulation to pharmacological inhibition. FEBS J 2021. DOI:10.1111/febs.16136. PubMed PMID: 34310025.
- Ramsey HE, Fischer MA, Lee T, et al. A novel MCL1 inhibitor combined with venetoclax rescues venetoclax-resistant acute myelogenous leukemia. Cancer Discov. 2018;8(12):1566–1581. DOI:10.1158/2159-8290.CD-18-0140. PubMed PMID: 30185627; PubMed Central PMCID: PMC6279595.
- Beroukhim R, Mermel CH, Porter D, et al. The landscape of somatic copy-number alteration across human cancers. Nature. 2010;463(7283):899–905. DOI:10.1038/nature08822. PubMed PMID: 20164920; PubMed Central PMCID: PMC2826709.
- Pei S, Pollyea DA, Gustafson A, et al. Monocytic subclones confer resistance to venetoclax-based therapy in patients with acute myeloid leukemia. Cancer Discov. 2020;10(4):536–551. DOI:10.1158/2159-8290.CD-19-0710. PubMed PMID: 31974170; PubMed Central PMCID: PMC7124979.
- Lasica M, Anderson MA. Review of venetoclax in CLL, AML and multiple myeloma. J Pers Med. 2021;11:6. DOI:10.3390/jpm11060463. PubMed PMID: 34073976; PubMed Central PMCID: PMC8225137.
- Niu X, Zhao J, Ma J, et al. Binding of released Bim to Mcl-1 is a mechanism of intrinsic resistance to ABT-199 which can be overcome by combination with daunorubicin or cytarabine in AML cells. Clin Cancer Res. 2016;22(17):4440–4451. DOI:10.1158/1078-0432.CCR-15-3057. PubMed PMID: 27103402; PubMed Central PMCID: PMC5010519.
- Quinn BA, Dash R, Azab B, et al. Targeting Mcl-1 for the therapy of cancer. Expert Opin Investig Drugs. 2011;20(10):1397–1411. DOI:10.1517/13543784.2011.609167. PubMed PMID: 21851287; PubMed Central PMCID: PMC3205956.
- Tron AE, Belmonte MA, Adam A, et al. Discovery of Mcl-1-specific inhibitor AZD5991 and preclinical activity in multiple myeloma and acute myeloid leukemia. Nat Commun. 2018;9(1):5341. DOI:10.1038/s41467-018-07551-w. PubMed PMID: 30559424; PubMed Central PMCID: PMC6297231.
- Lee T, Bian Z, Zhao B, et al. Discovery and biological characterization of potent myeloid cell leukemia-1 inhibitors. FEBS Lett 2017;591(1):240–251. DOI:10.1002/1873-3468.12497. PubMed PMID: 27878989; PubMed Central PMCID: PMC5381274.
- GeneCards. JUN Gene – Jun Proto-Oncogene, AP-1 Transcription Factor Subunit GeneCardsSuite.
- GeneCards. JUNB Gene – JunB Proto-Oncogene, AP-1 Transcription Factor Subunit GeneCardsSuite. 2022.
- Vogt PK. Jun, the oncoprotein. Oncogene. 2001;20(19):2365–2377. DOI:10.1038/sj.onc.1204443. PubMed PMID: 11402333.
- Romine KA, Nechiporuk T, Bottomly D, et al. Monocytic differentiation and AHR signaling as primary nodes of BET inhibitor response in acute myeloid leukemia. Blood Cancer Discov. 2021;2(5):518–531. DOI:10.1158/2643-3230.BCD-21-0012. PubMed PMID: 34568834; PubMed Central PMCID: PMC8462123.
- Fan SJ, Li HB, Cui G, et al. miRNA-149* promotes cell proliferation and suppresses apoptosis by mediating JunB in T-cell acute lymphoblastic leukemia. Leuk Res 2016;41:62–70. DOI:10.1016/j.leukres.2015.11.016. PubMed PMID: 26725775.