
 ?Mathematical formulae have been encoded as MathML and are displayed in this HTML version using MathJax in order to improve their display. Uncheck the box to turn MathJax off. This feature requires Javascript. Click on a formula to zoom.
ABSTRACT
Objective
This study aims to evaluate the consistency of heterogeneity degree of erythrocyte volume parameters between the blood automated analyzer Sysmex-XN9000 and the advanced red blood cell software CellaVisionDI-60.
Method
500 blood samples of volunteers were analyzed by Sysmex-XN9000 and CellaVision-DI60. The sensitivity, specificity, positive predictive value, negative predictive value, false positive rate, and false negative rate were evaluated. The consistency of all parameters was tested.
Result
Taking the standard RBC group as the control group, the RBC parameters of the macrocytic and the microcytic group were compared. There was a statistical difference between the groups. ROC curve analysis showed that the best cutoff value of microcytic and of macrocytic affecting MCV were 4.1% and 5.7%, respectively. The best cutoff value of anisocytosis was 15.0%. The correlation coefficient between anisocytosis and red blood cell distribution width (RDW-CV) was 0.756. The sensitivity, specificity, positive predictive value and coincidence rate of anisocytosis were high. The false negative rate was 10.0%, and the false positive rate was 7.4%.
Conclusion
All parameters of the degree of heterogeneity have good accuracy and consistency in the two instruments. Anisocytosis is with higher coincidence rate and positive predictive value. MIC and MAC have a good prediction on the increase or decrease of MCV. Although advanced RBC software's false negative and false positive rates are high, the red blood cell image system is more intuitive and time-saving in observing cells. Consequently, CellaVision-DI60 is suggested to combine with XN-9000 for judging the anisocytosis in daily work comprehensively.
1 Introduction
The most common test in the laboratory is complete blood cell count (CBC). An automated hematology analyzer can be used to detect red blood cells, leucocytes, and platelets based on the principle of laser-light scatter and flow cytometry. Erythrocytes analysis consists of count detection and content detection. An automated hematology analyzer measured some erythrocyte indexes, and some indexes were calculated. But morphological information provided by the automated hematology analyzer was limited. For abnormal red blood cells, the blood cell analyzer cannot recognize them [Citation1]. Traditional microscopical examination and cell classification are necessary when quantifying pathological cells. But conventional microscopy is limited by various constraints. This process is time-and labor-consuming; the ability difference of staff and the blood smear fades over time. It is not conducive to the inspection work before reviewing and summarizing [Citation2]. In addition to the abnormal red blood cells mentioned above, which can provide diagnostic clues for laboratory physicians, the uniformity of erythrocyte sizes is also directly related to the development and prognosis of the disease. Under pathological conditions, the cell membrane is damaged, and erythrocyte permeability increases, which eventually leads to different levels of RDW [Citation3]. The increase of RDW-CV represents high anisocytosis. Conversely, the RDW value is not meaningful [Citation4]. Clinically, the RDW value is frequently higher than the conventional reference range. Although the increase of RDW in the above diseases is not specific, the changing trend of RDW has a high negative predictive value for diagnosing clinical diseases. It also provides important information for long-term and short-term prognosis [Citation5–7]. For example, iron-deficiency anemia(IDA) and thalassemia are both small cell hypochromic anemia, but the erythrocyte sizes in IDA are uneven, and the RDW increases, while those in Thalassemia are uniform, and the RDW remains unchanged. Megaloblastic anemia caused by folic acid and Vitamin B12 deficiency and anemia of Myelodysplastic syndrome are both megaloblastic anemia. Megaloblastic anemia has uneven erythrocyte sizes, and the RDW increases, while Myelodysplastic syndrome has even erythrocyte sizes, and the RDW does not change. In terms of IDA, anisocytosis can indirectly prove the effectiveness of iron therapy [Citation8,Citation9]. In Bekir and Zuk's [Citation10,Citation11] research, the best cut-offs of RDW-CV predicting high mortality of diseases vary are 15.0% and 15.2%, respectively. And in Jandaghian’s's research [Citation12], RDW-CV is a predictor of mortality in COVID-19 patients. The CellaVision advanced RBC software (ARS) is an intelligent application for analyzing erythrocyte morphology based on the CellaVision DI/DM system [Citation13]. The software divides erythrocytes into macrocytic cells (MAC), microcytic cells (MIC), and normocrythrocyte according to the diameters of RBCs. It divides RBCs into hypochromatic cells and polychromatic cells according to haemoglobin. Beyond that, the novel application offers 12 abnormal morphological categories of the erythrocyte [Citation14–16].
This study evaluated the consistency of parameters related to erythrocyte sizes in Syxmex-XN9000 and CellaVision-DI60. The ability of ARS to distinguish erythrocyte sizes was evaluated, studying the relationship between MIC, MAC, and MCV.
2 Materials and methods
2.1. Participants and specimen preparation
380 venous blood samples were randomly selected among outpatients’ and inpatients’ specimens from the department of clinical laboratory medicine in XX hospital during August 2021 to April 2022. Ages ranged from 18 yrs to 60 yrs, and the median age was 42 years. Experiment 1. After the complete blood cell count and according to MCV results, all samples were divided into the control group, n = 100 (MCV = 80-100fl), macrocytic cells group, n = 150 (MCV > 100fl), and microcytic cells group, n = 130 (MCV<80fl). Experiment 2. We expanded the specimens to 500 cases and randomly selected specimens from outpatients and inpatients. All specimens were divided into positive and negative groups according to the RDW results detected by XN-9000. In our research, 292 specimens were classified into a positive group (RDW > 15.0%) and 208 specimens were classified into a negative group (RDW<15.0%) for further statistical analysis. All protocols were approved by the Ethics Committee of Xijing Hospital, affiliated with the Fourth Military Medical University (China). The protocol number is XJLL-KY20222089. All of the patients were informed of the experimental plan. Written informed consents were obtained from all participants involved in this study.
2.2. Automated blood cell analyzers and reagent
Sysmex-XN9000 and SP-10 stainer was provided by Sysmex Corporation, Japan. The instruments’ original manufacturer provided the reagent, quality control material, and calibrator, which were used within their respective dates. The instruments were calibrated periodically and passed the performance verification. The blood was processed after passing the quality control every day. Micro Slide MS-101 was provided by Olympus Corporation, Japan. Wright-Giemsa dye liquor was provided by BASO Corporation, China. The DI60 ARS and CellaVision cargille Immersionn Oil (type300) were provided by CellaVision, Lund, Sweden.
2.3. RBC detection by automated blood cell analyzer and cellavision-DI60
2 ml venous blood was collected from whole blood anti-coagulated with EDTA-2 K. Samples were tested within 2 h after collection by XN-9000. RBC related detection indicators were recorded. All Wright-Giemsa stained blood smears were prepared immediately using Sysmex SP-10 stainer. The blood smears must be at least 30 mm in length, terminating 5–15 mm from the edge; blood smears should not be too thin or too thick. The head, body and tail of the blood smears were distinct. An analysis was performed in the erythrocyte tiling layer. Erythrocyte morphology was evaluated by CellaVision-DI60 (ARS). RBCs were classified based on size (anisocytosis, microcytes, and macrocytes), color (polychromasia and hypochromasia), shape (12 morphological types), and the results were recorded.
2.4. Statistical analysis
SPSS version 20.0(USA) was used for statistical analysis. The results were expressed as mean ± standard deviation ( ± SD). The samples were also drawn independently of each other. Normality tests were by Kolmogorov Smirnoff, and the three groups’ data showed normal distributions (P > 0.05). Analysis of variance was performed in the data. The results showed that the variance of the three data groups was consistent(P > 0.05), analysis of variance (ANOVA) can be performed. One-way ANOVA was used for comparison among groups, and the result (P < 0.05) indicated a significant difference. The LSD-t-test was then used to compare between groups. P < 0.05 indicated a significant difference. The intraclass correlation efficient (ICC) was used to evaluate the consistency of erythrocyte size asymmetry between the two instruments. The sensitivity (SEN), specificity (SPE), positive predictive value (PPV), negative predictive value (NPV), false positive rate (FP), false negative rate (FN), and coincidence rate of erythrocyte size in Sysmex- XN-9000 and CellaVision- DI-60 were calculated. MIC and MAC results were compared with the MCV results using receiver operating characteristic (ROC) curves analysis. With the Youden index, the optimal cut-off value was determined.
2.5. Advanced RBC software(ARS)
2.5.1. Version 5.0.1.
Macrocytes (MAC) are enlarged red cells with a diameter greater than 8.5 μm (MCV > 100 fL) while Microcytes (MIC) are small red blood cells with a diameter of less than 7μm (MCV < 80 fL).
3. Results
3.1. Comparison of erythrocyte parameters between groups
shows RBC related parameters of the control group, the microcytic cells group and the macrocytic cells group. Compared with the control group, the microcytic cells group shows statistical differences except for RBC count results. The macrocytic cells group shows significant differences except for MCHC.
Table 1. Comparison of erythrocyte parameters among groups.
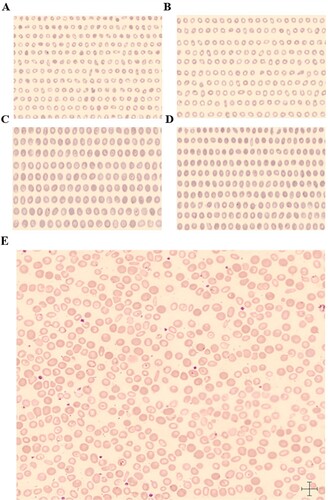
shows red blood cell morphology diagram of CellaVision-DI60 ARS, (AB) Microcytic hypochromic anemia samples, RDW = 21.2%, a total of 2,238 red blood cells were scanned by the ARS. There were 1,036 microcytes(A), MIC = 46.3%(++), 1,187 normocytic(B), and 15 macrocytes, MAC = 0.7%(-). (CD) Macrocytic anemia samples, RDW = 16.4%, a total of 1,538 red blood cells were scanned by the ARS. There were 13 microcytes, MIC = 0.8%(-), 534 macrocytes(C) and 1,001 normocytes(D), MAC = 34.7%(++). (E) After treatment of microcytic hypochromic anemia samples. Two kinds of red blood cells can be seen in the RBC overview image. MAC are polychromatic cells that are large RBCs. MIC are hypochromatic cells which are small RBCs. A few of RBCs are target cells due to a decrease in hemoglobin. The scale's length at the bottom right-hand corner in the image is 7 microns, making it more intuitive to observe anisocytosis of RBCs on the RBC overview image.
Figure 1. AB. The scanning image of microcytic cells (A) and normocytes (B) in a sample of microcytic hypochromic anemia. CD. The scanning image of macrocytic cells and normocytes in a sample of macrocytic anemia. (E) Two kinds of red blood cells can be seen in the RBC overview image. The sample is microcytic hypochromic anemia after treatment. Target red blood cells can be seen in this picture.
3.2. ROC curve analysis
3.2.1 The results show that when the MIC is ≥4.1% in the blood sample, i.e. the optimal cut off value is 4.1%, the MCV is<80fl, and the AUC is 0.889 (95% CI: 0.843-0.934). When the MAC is ≥5.7%, i.e. the optimal cut off value is 5.7%, the MCV is >100fl, and the AUC is 0.908 (95% CI: 0.866-0.950). At the same time, the Youden index, sensitivity, and specificity are shown in and .
Figure 2. (A) The ROC curve of MCV<80fl influenced by MIC. (B) The ROC curve of MCV˃100fl influenced by MAC. (C) ROC curve of anisocytosis, the cut off value is 15.0%, AUC is 0.888, the sensitivity is 81.86%, and the specificity is 82.52%.
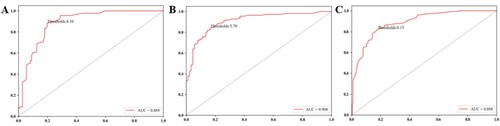
Table 2. The performance evaluation of the best MIC, MAC cut-off value.
3.2.2 ROC curve for RDW and anisocytosis in 500 specimens from 292 positive specimens (RDW ≥ 15.0%) and 208 negative specimens (RDW ≤ 15.0%). Anisocytosis presented high AUC values in the ROC analysis (AUC = 0.888). The best cut-off of anisocytosis is 15.0%. The sensitivity and specificity are all above 80% (, ).
Table 3. The performance evaluation of best anisocytosis cut-off value.
3.3. Consistency evaluation of the erythrocyte parameters of Sysmex-XN9000 and CellaVision-DI60
The consistency evaluation of the CellaVision-DI 60 is shown in . The parameter anisocytosis of CellaVision-DI60 shows a good positive predictive value (86.7%) and a high coincidence rate (83.0%). The negative predictive value is substantial (77.4%), the false positive value is 7.4%, and the false negative value is10.0%.
Table 4. Comparison of Sysmex-XN9000 and CellaVision-DI60.
3.4. The consistency of anisocytosis and RDW-CV
The ICC was 0.756 (ICC = 0 means untrusted, ICC = 1 means creditable). The data shows that the index system has good reliability and validity. The 95% confidence interval is 0.696-0.805, P<0.01.
4. Discussion
CellaVison is a world-leading provider of digital hematology microscopy solutions, CellaVision automates the workflow in blood and body fluids morphology in recent years. Laboratories have widely favored the digital microscope (DM) system. CellaVision-DI60 (Sweden, Lund) is the second product of the digital microscope following DM96, which scans each blood cell and takes high-quality photos. The photos can be scaled for viewing the morphology of cells. The cell pictures can be compared side by side and viewed by multiple staff simultaneously. DI60 can quickly analyze over 1,000 RBCs on each blood smear. However, depending on the number of RBCs and the thickness of blood smears, the count of RBCs scanned by ARS also varies slightly. After pre-classification by the ARS, Clinical laboratory technicians manually correct the RBC classification to reduce the error. It significantly saves the time of artificial microscope inspection and improves detection efficiency. Few performance evaluations of the ARS have been carried out, but they mainly focus on the RBC classification and there is an extremely low number of research on red blood cell size and anisocytosis. Our study evaluates the ARS on the CellaVison-DI60 for erythrocyte size, aiming to evaluate the sensitivity and specificity of this new RBC-related software and the consistency with indicators detected by Sysmex-XN9000.
This experiment studies the relationship between MAC, MIC, and MCV, where conventional microscopy is not used as the gold standard to judge the erythrocyte size because it lacks objectivity when observing only by eyes as it is not as intuitive as the morphological changes. Erythrocyte size may be judged differently due to the different experiences of clinical laboratory technicians. Therefore, the conclusions of several technicians are hardly comparable. Notably, in L. Palmer’s research, the International Council for Standardization in Hematology (ICSH) recommended that MCV generated by the automated hematology analyzer be used to gauge erythrocytes’ size instead the microscopic examination to sure the grading of RBC [Citation17]. In our study, we used the blood automated analyzer (Sysmex-XN9000) covering most laboratories as the benchmark to compare the relevant red blood cell parameters of DI60.
The various forms of anemia are classified as microcytic anemia, normocytic anemia, and macrocytic anemia according to the result of MCV. It is noteworthy that this criterion typically does not apply to premature and newborn babies [Citation18]. P < 0.05 shows that the difference between and within the group has statistical significance (MCV, MCH, MCHC, MIC, MAC). It suggests that MIC and MAC, like MCV, can distinguish normocytes, macrocytes, and microcytes. When the number of microcytes in the blood judged by CellaVision-DI60 exceeds 4.1%, MCV is < 80fL. Similarly, when the number of macrocytes exceeds 5.7%, MCV is > 100fL. However, the current evidence in this regard is inconclusive. The number of cases in our research is not large enough, and the results may be different due to different instrument status and regional differences. Therefore, researchers should choose an appropriate cut-off value that fits their own laboratory setup and project needs.
Unlike XN9000, the ARS calculates anisocytosis by measuring the size and area of RBC in the overview, which produces Anisocytosis (CV) = SD (Area)/Mean value (Area). But reference ranges of anisocytosis are not provided by the company. The erythrocyte indices and additional parameters are supplied by the automated hematology analyzer and finally displayed as the cell distribution. As a result, RDW is automatically generated, expressed by the standard deviation (RDW-SD) and RDW-CV. Due to the different evaluation technologies of different blood automated analyzers, the range of RDW-CV provided by various manufacturers is also different[Citation19].
The standard lab reference range for RDW-CV is 11.0-15.0%. Although RDW-CV is less sensitive than RDW-SD in determining differences in red blood cell size, many studies have shown that RDW-SD values for predicting severe illness and a high mortality risk of diseases vary from 30fl to 50fl [Citation20–22]. Consequently, all patients are divided into positive and negative groups according to whether the RDW-CV is ≥15.0% in our study. The study shows that the best cut off value of anisocytosis is also 15.0%. The consistency between RDW-CV and anisocytosis is good (0.756). The sensitivity, specificity, and PPV of anisocytosis are high (81.9%,82.6%, 86.7%). The NPV (77.4%) is substantial, the false positive rate is 7.4%, and the false negative rate is 10,0%. This maybe due to that RDW-CV is calculated differently from anisocytosis. Since RBC has a three-dimensional structure, when the morphology of RBC changes, the area may change, but the volume may remain unchanged, and vice versa. RDW-CV = (RDW-SD)/MCV*100. It also depends on the MCV of the erythrocytes. This probably explains why the false positive and false negative rates are not ideal.
There are shortcomings and limitations in this study. Due to incomplete preparation in the early stage of the study, the collection of patient blood samples was not smooth. Therefore, in the first experiment, there were a total of 380 specimens, while in the second, the size was expanded to 500. However, it is more convincing if the data from both experiments are from the same patients’ blood samples. Secondly, a microscope with reticle should be used for manual counting of red blood cells, and manual microscopy result should be taken as the gold standard for comparing the consistency, sensitivity, specificity, and other performance indicators of red-blood cell related parameters between Cellvision and Sysmex-9000.
After a comprehensive analysis, the detection parameters of the CellaVision-DI60 ARS, especially the sensitivity, specificity, positive predictive rate, and consistency rate, show good performance instructive significance. Although the ARS has high false negative and false positive rates, the red blood cell image system is more intuitive and time-saving in observation Where cell shape changes, cell size changes of erythrocytes, as well as content changes of hemoglobin could be observed at a glance ( (E)). Consequently, combining the results of XN-9000 with those of CellaVision-DI60 is needed for judging the anisocytosis in daily work comprehensively.
Acknowledgements
We thank all patients who consented to disclose their medical records and provided their blood samples data.
Authors’ contributions
Jing Jing and Jiayun Liu conceived and designed the experiments; Jing Jing was a major contributor in writing the manuscript; Yuan Zhao and Xiang Cheng performed the experiments; Xiaoyan Hao analyzed the data; Enliang Hu, Jingyuan Jia, Jie Lin and Chong Yuan provide the urine samples. Yanjun Diao revised the paper. All authors read and approved the final manuscript.
Availability of data and materials
All data generated or analyzed during this study are included in this published article.
Ethics approval
The study was approved by the Ethics Committee of Xijing Hospital (China), the protocol number is XJLL-KY20222089. All participants provided written informed consent. And all methods were performed in accordance with Declaration of Helsinki.
Consent to participate
All of the patients were informed of the experimental plan. Written informed consent was obtained from all participants involved in this study.
Disclosure statement
No potential conflict of interest was reported by the author(s).
Additional information
Funding
Reference
- Ceelie H, Dinkelaar RB, van Gelder W. Examination of peripheral blood films using automated microscopy; evaluation of Diffmaster Octavia and Cellavision DM96. J Clin Pathol. 2006;60(1):72–79. doi:10.1136/jcp.2005.035402
- Kim HN, Hur M, Kim H, et al. Performance of automated digital cell imaging analyzer sysmex DI-60. Clin Chem Lab Med. 2017;56(1):94–102. doi:10.1515/cclm-2017-0132
- Lippi G, Cervellin G, Sanchis-Gomar F. Red blood cell distribution width and cardiovascular disorders. does it really matter which comes first, the chicken or the egg? Int J Cardiol. 2016;206(206):129–130. doi:10.1016/j.ijcard.2016.01.122
- Li X, Chen Q, Bi X, et al. Preoperatively elevated RDW-SD and RDW-CV predict favorable survival in intrahepatic cholangiocarcinoma patients after curative resection. BMC Surg. 2021;21(1):105–114. doi:10.1186/s12893-021-01094-6
- Ephrem G. Red blood cell distribution width is a predictor of readmission in cardiac patients. Clin Cardio. 2013;36(5):293–299. doi:10.1002/clc.22116
- Salvagno GL, Sanchis-Gomar F, Picanza A, et al. Red blood cell distribution width: A simple parameter with multiple clinical applications. Crit Rev Clin Lab Sci. 2015;52(2):86–105. doi:10.3109/10408363.2014.992064
- Bedel C, Korkut M. Red cell distribution width and Hip fracture. J Bone Miner Res. 2021;36(6):1202), doi:10.1002/jbmr.4201
- Hongying L. An analysis of clinical value of blood morphological tests in the progression of iron deficiency anemia and Its prognostic evaluation. Labeled Immunoassays and Clinical Medicine. 2018;7(25):973–1976. doi:10.11748/bjmy.issn.1006-1703.2018.07.013
- Bessman JD, Feinstein DI. Quantitative anisocytosis as a discriminant between iron deficiency and thalassemia mino. Blood. 1979;53(2):288–293.
- Bekir SA, Tuncay E, Gungor S, et al. Can red blood cell distribution width (RDW) level predict the severity of acute exacerbation of chronic obstructive pulmonary disease (AECOPD)? Int J Clin Prac. 2021;75(11):e14730), doi:10.1111/ijcp.14730
- Zuk M, Migdal A, Dominczak J, et al. Usefulness of Red cell width distribution (RDW) in the assessment of children with pulmonary arterial hypertension (PAH). Pediatr Cardiol. 2019;40(4):820–e14826. doi:10.1007/s00246-019-02077-4
- Atik D, Kay HB. Evaluation of the relationship of MPV, RDW and PVI parameters with disease severity in COVID-19 patients. Acta Clin Croat. 2021;60(1):103–114. doi:10.20471/acc.2021.60.01.15
- Park SJ, Yoon J, Kwon JA, et al. Evaluation of the CellaVision advanced RBC application for detecting Red blood cell morphological abnormalities. Ann Lab Med. 2021;41(1):44–50. doi:10.3343/alm.2021.41.1.44
- Wang F, Wang G, Yang Z, et al. Differential diagnosis of thalassemia and iron deficiency anemia using the CellaVision advanced Red blood cell software. Int Lab Hematol. 2021;43(4):853–858. doi:10.1111/ijlh.13424
- Yoon J, Kwon JA, Yoon SY, et al. Diagnostic performance of CellaVision DM96 for plasmodium vivax and plasmodium falciparum screening in peripheral blood smears. Acta Trop. 2019;193:7–11. doi:10.1016/j.actatropica.2019.02.009
- M.Criel, M.Godefroid, B.Deckers, et al. Evaluation of the Red blood cell advanced software application on the CellaVision DM96. Int J Lab Hematol. 2016;38(4):366–374. doi:10.1111/ijlh.12497
- Palmer L, Briggs C, McFadden S, et al. ICSH recommendations for the standardization of nomenclature and grading of peripheral blood cell morphological features. Int Lab Hematol. 2015;37(3):287–303. doi:10.1111/ijlh.12327
- Dzierzak E, Philipsen S. Erythropoiesis: development and differentiation. Cold Spring Harb Perspect Med. 2013;3(4):a0a011601), doi:10.1101/cshperspect.a011601
- Pedrazzani C, Tripepi M, Turri G, et al. Prognostic value of red cell distribution width (RDW) in colorectal cancer. results from a single-center cohort on 591 patients. Sci Rep. 2020;10(1):1072.
- XJ Xiong, T Li, S Yu, et al. Association between Red blood cell indices and preoperative deep vein thrombosis in patients undergoing total joint arthroplasty: A retrospective study[J]. Clin Appl Thromb Hemost. 2022;12: 28. doi:10.1177/10760296221149029
- Li Ming, Hui-Ling Cao, Qiushu Li, et al. Red blood cell distribution width as a predictive marker for coronary artery lesions in patients with kawasaki disease. Pediatr Cardiol. 2021;42(7):1496–1503. doi:10.1007/s00246-021-02633-x
- T I Petelina, N A Musikhina. K S Avdeeva, et al. Estimation of erythrocyte parameters of general blood analysis in patients with SARS-CoV-2 -associated pneumonia. Klin Lab Diagn. 2022;67(1):24–30.