
ABSTRACT
Background
Multiple myeloma (MM) is a highly heterogeneous disease. Cuproptosis is a novel mode of death that is closely associated with several diseases, such as hepatocellular carcinoma. However, its role in MM is unknown.
Methods
MM transcriptomic and clinical data were obtained from UCSC Xena and gene expression omnibus (GEO) databases. Following MM samples were divided into different subtypes based on the cuproptosis genes, the differentially expressed genes (DEGs) among different subtypes, namely, candidate cuproptosis related genes were analyzed by univariate Cox and least absolute shrinkage and selection operator (LASSO) regression to construct a cuproptosis-related risk model. After the independent prognostic analysis was performed, a nomogram was constructed. Finally, Functional enrichment analysis and immune infiltration analysis were performed in the high- and low-risk groups, potential therapeutic agents were then predicted.
Results
The 784 MM samples in UCSC Xena cohorts were divided into three different subtypes, and 4 out of 346 candidate cuproptosis related genes, namely CDKN2A, BCL3, KCNA3 and TTC14 were used to construct a risk model. Risk score was considered a reliable independent prognostic factor for MM patients. It was investigated that the pathway of cell cycle was significantly enriched in the high-risk group. In addition, immune score, ESTIMATE score and cytolytic activity were significantly different between different risk groups, as well as 13 immune cells such as memory B cells. Nine drugs were predicted in our study.
Conclusion
A cuproptosis-related prognostic model was constructed, which may have a potential guiding role in the treatment of MM.
Abbreviations
| CRGS | = | cuproptosis-related genes |
| GEO | = | gene expression omnibus |
| LASSO | = | least absolute shrinkage and selection operator |
| MDSCs | = | myeloid derived suppressor cells |
| MGUS | = | monoclonal gamma globulin disease |
| MM | = | multiple myeloma |
| OS | = | overall survival |
| SCT | = | stem cell transplantation |
| Tregs | = | tregulatory cells |
1. Introduction
Multiple myeloma (MM) is a hematologic malignancy characterized by abnormal accumulation of myeloma plasma cells and secretion of monoclonal immunoglobulins, and causes osteolytic lesions and extramedullary organ invasion in the advanced stages of the disease [Citation1]. In the past 20 years, application of new drugs such as proteasome inhibitors (e.g. bortezomib and carfifizomib), immunomodulatory drugs (e.g. thalidomide and lenalidomide), hematopoietic stem cell transplantation (SCT) have significantly improved complete remission rate and overall survival of MM patients [Citation2]. Nevertheless, MM is still an incurable malignancy [Citation3]. Response to treatment and survival of MM is heterogeneous and median overall survival (OS) ranges from 2 to 10 years. This apparent difference may be related to the heterogeneity of myeloma cell biology and multiple host factors [Citation4]. Therefore, it is critical to identify disease-related biomarkers and use them to distinguish patients with different prognosis, and which will facilitate the development of individualized treatment to cope with tumor heterogeneity and improve the prognosis of patients.
Copper (Cu) is an essential mineral nutrient for all living organisms and it is fundamental in a huge number of biological processes, including mitochondrial respiration, iron uptake, antioxidant/detoxification processes [Citation5]. In the field of cancer, several studies have reported higher levels of Cu in a variety of malignancies compared to normal tissues. It is evident that the dyshomeostasis of Cu plays a prominent role in cancer [Citation6]. It has been reported that Cu may have anti-myeloma activity in vivo and not facilitate myeloma progress [Citation7]. In recent decades, a growing body of evidence suggests that the Cu-complex might serve as a potential therapeutic target for treating cancer, as Cu has been shown to promote the death of cancer cells via apoptosis and/or an accumulation of free radicals [Citation7,Citation8]. Numerous studies have shown that the combination of DSF and copper (DSF/Cu) greatly enhances its antitumor efficacy [Citation9]. Xu et al. demonstrated that the DSF/Cu complex induced apoptosis of MM cells and MM primary cells [Citation10]. The findings showed that DSF/Cu has potent anti-myeloma activity in vitro and in vivo highlighting valuable clinical potential of DSF/Cu in MM treatment. Anshul Agarwal et al. showed that a combination of resveratrol-copper reduced the transplant related toxicities in patients with MM receiving high dose melphalan [Citation11].
Recently, a novel way of copper-induced cell death that distinct from apoptosis, necroptosis, pyroptosis, and ferroptosis has been discovered and termed ‘cuproptosis’ by a study published on Science. The cuproptosis is a regulated cell death with copper-dependent and mitochondria-dependent, it occurs through direct binding of copper to lipid acylation component of the TCA cycle, resulting in abnormal aggregation of lipid acylation proteins and loss of iron-sulfur tuftin, and also causing cell death due to proteotoxic stress [Citation12]. A lot of studies have suggested that cuproptosis directly related to the progression of several diseases, including Huntington’s disease (Hd), amyotrophic lateral sclerosis (ALS), and Alzheimer’s disease (Ad) [Citation13]. These findings regarding cuproptosis provide new insights into potential applications for treating cancer. However, cuproptosis as a newly discovered form of regulating cell death, its potential in being the target of immunotherapy is far to understand. Besides, the role of cuproptosis in the onset, development and prognosis is still unknown.
In this study, we explored the correlation between cuproptosis-related genes (CRGs) and prognosis of MM through bioinformatics analysis, providing a new thought for the treatment and prognosis evaluation of MM. Moreover, our analysis highlights the importance of CRGs in MM development and lays a foundation for the therapeutic application of cuproptosis regulators in MM.
2. Materials and methods
2.1. Data source
In this study, 860 MM transcriptomic data and clinical data were downloaded from the UCSC Xena database (http://xena.ucsc.edu/), of which 784 MM samples had survival status and survival time. MM transcriptome data and clinical datasets were downloaded from the gene expression omnibus (GEO) databases (https://www.ncbi.nlm.nih.gov/geo/). In addition, GSE47552 contains 5 controls and 41 MM bone marrow donors, its chip detection platform is GPL6244 [HuGene 1 0 st] Affymetrix HumanGene 1.0 ST Array [transcript(gene)version]. GSE16558 contains 5 controls and 60 MM bone marrow donors. GSE4581 contains 414 MM samples with survival time and status, its chip detection platform is GPL570 [HG U133 Plus 2] Affymetrix HumanGenome U133 Plus 2.0 Array. Moreover, 10 cuproptosis genes were obtained [Citation14], namely FDX1, LIAS, LIPT1, DLD, DLAT, PDHA1, PDHB, MTF1, GLS and CDKN2A.
2.2. Identification of candidate cuproptosis related genes
The 784 MM samples from the UCSC Xena database source were classified different subtypes according to K values using the ConsensusClusterPlus package (version 1.54.0) [Citation15], and subtypes were analyzed respectively for survival and clinical differences using the survival package and chi-square test. In addition, spearman correlation analysis was performed for 10 cuproptosis genes. Finally, we performed differential analysis of genes between subclasses to obtain candidate cuproptosis related gene.
2.3. Screening of candidate genes
DEGs were obtained by differential analysis of the GSE47552 and GSE16558 datasets using the limma package with the filter conditions of P < 0.05, | log2foldchange | ≥ 0.5[Citation16]. The candidate cuproptosis related genes were intersected with the DEGs to obtain the intersected genes. Then, the candidate genes were screened by correlation analysis using Pearson setting screening criteria of P < 0.05, |Cor| > 0.5 for the intersecting genes and the 10 cuproptosis genes. Moreover, heat map of cuproptosis related genes was drawn using the pheatmap package.
2.4. Functional enrichment analysis
The study was carried out by enrichment analysis of candidate gene based on gene ontology (GO) and kyoto encyclopedia of genes and genomes (KEGg) databases using the clusterProfiler package, and the screening conditions were P < 0.05 and counts ≥ 2. And the pathway was displayed by drawing a bar graph in the enrichplot package (version 1.10.2) [Citation17].
2.5. Construction of a risk model
The study extracted the expression data of candidate gene in 784 MM samples and combined them with clinical data such as overall survival (OS) to obtain the clinical expression data of MM samples. Then, the survival related cuproptosis genes were obtained by univariate Cox regression analysis using the survival package (P < 0.05) (version 3.2-3). Least absolute shrinkage and selection operator (LASSO) logistic regression was implemented by setting the parameter family to Cox using the glmnet package (version 4.1-1) [Citation18], and the model genes were selected to construct the risk model.
2.6. Evaluation and verification of risk model
Firstly, the risk value of each MM patient was derived from the expression of model genes and LASSO regression, and the patients were divided into high-risk and low-risk groups by the median risk score, the risk score was calculated as follows: risk score = β1×X1+β2×X2+ … +βn × Xn. Survminer package (version0.4.8) was used to draw survival curve to compare the survival status of patients in high and low risk groups [Citation19], and then survival was used to draw Kaplan–Meier (K–M) and receiver operating characteristic (ROC) curves to test the effectiveness of the model. Finally, the model is externally validated using the GSE4581 dataset.
2.7. Correlation analysis between risk score and clinical data
Among the 784 MM samples from UCSC Xena database, the correlation between age, gender, race, stage, sample type, survival status and risk score were analyzed. Chi-square test was used to analyze the differences in the number of patients with different clinical subtypes between high and low risk groups, and rank sum test was used to compare the differences in risk scores under different clinical information.
2.8. Independent prognostic analysis and construction of a nomogram
The age, gender and other clinicopathological factors and risk scores of 784 MM samples from UCSC Xena database were analyzed by univariate and multivariate Cox independent prognostic analysis. We used rms package to build a nomogram to show the prediction effect of risk model and used psm to plot the correction curve to further verify the accuracy [Citation20].
2.9. Functional enrichment analysis of high and low risk groups
This study was performed by using the clusterProfiler (version 3.18.1) and org.Hs.eg.db (version 3.12.0) packages for GSEA in high and low risk groups. Differential analysis of genes was performed between high and low risk groups to obtain logFC of genes and rank them, and then gene set enrichment analysis (GSEA) was performed using the ranking results. The GSEA ridge chart was drawn by enrichplot (version 1.10.2) to visualize the TOP10 of the results of the high and low risk groups (sorted by the default corrected P value).
2.10. Immune infiltration analysis
ESTIMATE analysis was performed on 784 MM samples from the UCSC Xena database. Cell type identification by estimating relative subsets of RNA transcripts (CIBERSORT) algorithm (version 1.03) and LM22 gene set were used to calculate the proportion of 22 immune cells in MM samples, and samples with P > 0.05 were excluded. Moreover, the expression values of GZMA and PRF1 were extracted, and the FPKM value was converted to TPM, and the geometric mean of the two was calculated to obtain the cytolytic activity (CYT) of each sample. Single-sample gene set enrichment analysis (ssGSEA) was used to calculate the antigen presentation mechanism (APM), tumor infiltrating lymphoid cells (TILs) and T cell infiltration relative score (TIS) of each sample. In addition, ggplot2 package and ggpubr package were used to draw box line chart and stacked bar chart to visualize the results [Citation21], and rank sum test was used to compare the results between high and low risk groups.
2.11. Drug sensitivity analysis
In this study, 138 chemotherapeutic drugs commonly used in oncology treatment were obtained from the genomics of drug sensitivity in cancer (GDSc) database (https://www.cancerrxgene.org/). The 50% inhibitory concentration (IC50) of each drug in each sample was first calculated based on MM gene expression data using the pRRophetic (version0.5) package [Citation22], and then a correlation analysis between risk score and drug IC50 was performed using spearman to screen the drugs that met the criteria and compare IC50 between high and low risk groups to predict the potential drugs for treating MM.
3. Results
3.1. Classification of MM subtypes and their survival and clinical differences
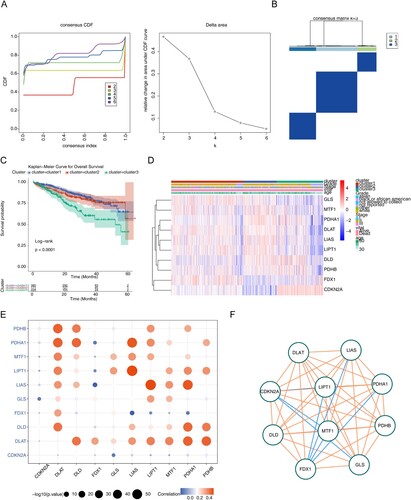
The 784 MM samples were divided into three clusters (cluster 1 = 385, cluster 2 = 171, cluster 3 = 228) by consistent clustering analysis (A,B). Survival analysis yielded significant differences in survival between subtypes, and cluster 3 patients had a worse survival prognosis (P < 0.0001) (C). Analysis of clinical differences between subtypes using chi-square tests yielded significant differences in survival status, stage and race type between subtypes (Supplementary Figure 1). The heat map demonstrated that the differential expression of cuproptosis genes in different subtypes (D). As seen by spearman correlation analysis, there was mainly a positive correlation between cuproptosis genes in MM (E,F), such as LIAS with LIPT1 and PDHA1 were positively correlated.
Figure 1. Exploration for three cuproptosis-related MM subtypes. (A) Cumulative distribution function (CDF) curve, CDF delta area curve as well as the delta area curve of consensus clustering of samples from UCSC Xena exhibiting the relative alterations in the area under the CDF curve for each category number k compared with category number k-−1. (B) Sample clustering heatmap when consensus k = 3. (C) Survival analyzes for the three clusters (P < 0.0001). (D) Heatmap of cuproptosis-related genes expression in MM samples with different clinical data. (E) Correlation bubble diagram among cuproptosis genes. (F) The correlation network among cuproptosis genes.
3.2. Screening and functional enrichment analysis of candidate genes
Because of the significant difference in survival between cluster 3 and cluster 1 patients and the high number of patients in cluster 1, we performed a differential analysis between cluster 3 and cluster 1. The volcano plot (A) showed there were a total of 346 DEGs between Cluster 3 and Cluster 1, of which 101 genes were up-regulated in cluster 3 and 245 genes were down-regulated in cluster 3. The DEGs between cluster 3 and cluster 1 were candidate cuproptosis related genes.
Figure 2. Identification and evaluation of candidate cuproptosis related genes and candidate genes. (A) Volcano plot of 346 DEGs between Cluster 3 and Cluster 1. (B) Volcano plot of 2931 DEGs between MM and normal samples in GSE47552. (C) Volcano plot of 2817 DEGs between MM and normal samples in GSE16558. For a–c, the screening criteria are set to P < 0.05, | log2foldchange | ≥ 0.5. (D) Venn diagrams for up-regulated and down-regulated intersecting genes by overlapping DEGs and candidate cuproptosis related genes. (E) Heatmap for candidate genes expression between MM and normal samples in GSE47552. (F) Heatmap for 33 candidate genes expression between MM and normal samples in GSE16558. (G)The Gene Ontology (GO) analysis for candidate genes, including the enriched biological processes, cellular composition terms. (H) The top 4 enriched Kyoto Encyclopedia of Genes and Genomes (KEGG) terms of candidate genes.
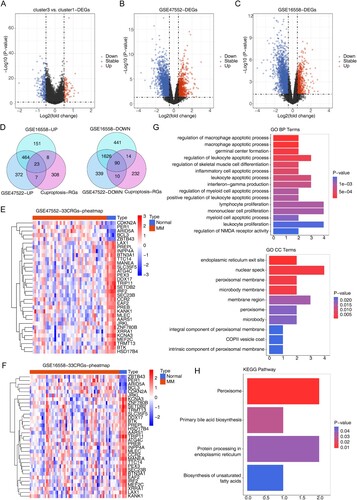
Differential analysis of the datasets GSE47552 and GSE16558 showed that a total of 2931 DEGs existed between MM and normal samples in GSE47552, of which 866 genes were up-regulated in MM samples and 2065 genes were down-regulated in MM samples (B). A total of 2817 DEGs were present between MM and normal samples in GSE16558, of which 646 genes were up-regulated in MM samples and 2171 genes were down-regulated in MM samples (C). Moreover, a total of 113 intersecting genes were obtained by taking the intersection of DEGs and candidate cuproptosis related genes, of which 23 were up-regulated and 90 were down-regulated (D). The 33 genes screened by Pearson correlation analysis between the candidate cuproptosis related genes and the 10 cuproptosis genes were candidate genes (). The results of heat map plotting showed that candidate genes were differentially expressed in MM and normal samples (E,F).
Table 1. Gene expression patterns of candidate genes.
GO functional enrichment results in terms of biological processes showed that candidate genes were associated with the regulation of NMDA receptor activity, leukocyte proliferation, myeloid apoptotic process, monocyte proliferation, lymphocyte proliferation, positive regulation of leukocyte apoptotic process, regulation of myeloid apoptotic process, interferon-gamma production, leukocyte apoptotic process, inflammatory apoptotic process, regulation of skeletal muscle cell differentiation, regulation of leukocyte apoptotic process, germinal center formation, macrophage apoptotic process, and regulation of macrophage apoptotic process were significantly correlated (G). In terms of cellular composition, candidate genes were significantly associated with intrinsic components of peroxisomal membranes, COPII vesicle coat, components of peroxisomal membranes, microsomes, peroxisomes, membrane regions, microsomal membranes, peroxisomal membranes, nuclear spots, and endoplasmic reticulum exit sites (G).
KEGG functional enrichment analysis showed that candidate genes were significantly associated with biosynthesis of unsaturated fatty acids, protein processing in endoplasmic reticulum, primary bile acid biosynthesis, and peroxisome pathways, and bar graphs were drawn to demonstrate the pathways (H).
3.3. Construction and assessment of a prognostic risk model
The expression data of 33 candidate genes were combined with clinical data such as OS to obtain the clinical expression data of MM samples, and the results of univariate Cox analysis showed that a total of 6 survival related cuproptosis genes were obtained (P < 0.05) (A), as shown by the survival curves (B), the median values of all genes except SLC35F5 divided the samples into two subtypes with significant differences in survival. The gene coefficients plotted by LASSO regression analysis and the error plot for 10-fold cross-validation are shown (C) that when the lambda value was taken to be the smallest, the constructed model was the optimal model. When the lambdamin was taken as 0.0081, four genes namely CDKN2A, BCL3, KCNA3 and TTC14 were screened ().
Figure 3. Identification of prognostic genes (A) Forest map for univariate Cox analysis to screen six survival related cuproptosis genes. (B) Kaplan–Meier (K–M) survival curve of 784 MM samples with different expressed patterns of six survival related cuproptosis genes, including CDKN2A (P < 0.0001), BCL3 (P = 0.018), KCNA3 (P = 0.0019), TTC14 (P = 0.0053), XRRA1 (P = 0.00093), and SLC35F5 (P < 0.38). (C) Least absolute and selection operator (LASSO) regression analysis to screen prognostic genes. LASSO coefficient profiles (top) and cross-validation (bottom) to select the optimal tuning parameter.
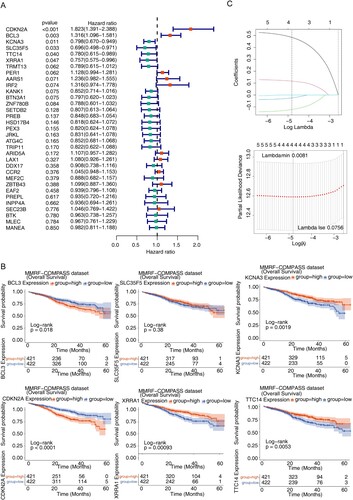
Table 2. Four model genes screened using LASSO COX regression analysis.
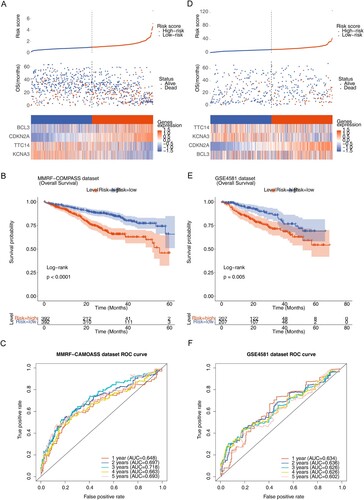
The median risk score (0.6124) was calculated from the expression of the four model genes and the risk coefficient obtained by LASSO regression, and the MM patients were divided into high-risk and low-risk groups. The risk profile plots showed differences in risk scores, survival time and expression of model genes between the high- and low-risk groups (A). Survival curve plots for the high- and low-risk groups showed significant differences in patient survival between the high- and low-risk groups (P < 0.0001), and patients in the high-risk group had a lower survival rate (B). The ROC curves were plotted based on the risk model with a survival time node of 1–5 years (C), and the results yielded that the AUC of the ROC curves were all greater than 0.6, indicating a good efficacy of the risk model. In addition, the risk model was externally validated using the dataset GSE4581, and the same risk score was calculated for each MM patient, and the MedianRiskscore = 9.4291 was calculated as the boundary to classify patients into high and low risk groups. The risk curve, scatter plot, heat map (D), survival curve for high- and low-risk groups (E) and ROC curve (F) showed that the survival prognosis was worse in the high-risk group in the validation set data (P = 0.005), and the AUCs were all greater than 0.6, which was consistent with the results in the training set.
Figure 4. Construction and assessment of the prognostic risk model. (A) Risk score curve, survival status and gene expression of four prognostic genes between high- and low-risk groups in training set. (B) K–M survival curve of high- and low-risk groups in training set (P < 0.0001). (C) Receiver operating characteristic (ROC) curves of training set. (D) Risk score curve, survival status and gene expression of four prognostic genes between high- and low-risk groups in validation set (GSE4581). (E) K–M survival curve of high- and low-risk groups in validation set. (F) ROC curves of validation set (P < 0.005).
3.4. Correlation analysis of risk model and clinical factors and nomogram construction
The number of patients with different clinical subtypes was compared between the high and low risk groups using chi-square test, and the trilinear table of clinical information showed that there were significant differences between patients in the high and low risk groups between the subtypes of survival status, sampletype, Stage and cluster (). We used the rank sum test to compare the risk scores under different clinical information, it is evident from the results that there is a significant difference in the risk scores of stage, sample type, cluster and vital subtypes (P < 0.05) (Supplementary Figure 2).
Table 3. Clinical correlation analysis between the risk score and clinical factors.
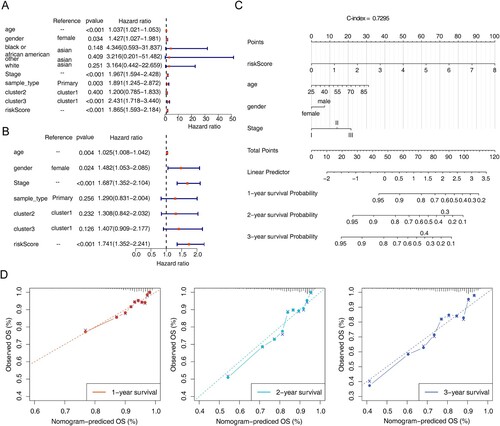
The results of univariate and multivariate Cox independent prognostic analysis of the risk model showed P < 0.05 for riskScore (A,B), it indicated that the risk model constructed is a more reliable independent prognostic factor for MM patients. In addition, the nomogram was plotted and the C-index was calculated to be 0.7295 (C), it indicated that the model was a better predictor. The calibration curve was plotted in this study (D), from which it was known that the risk model has a high accuracy in predicting the survival rate of patients at 1–3 years, it indicated that the constructed prediction model could be used as a valid model.
Figure 5. Independent prognostic analysis and construction of the nomogram. (A) Forest map of univariate Cox independent prognostic analysis. (B) Forest map of multivariate Cox independent prognostic analysis. (C) nomogram was constructed based on the risk model and other independent prognostic factors. (D) Calibration curve of nomogram for survival prediction at 1-, 2-, 3-years. * P < 0.05, ** P < 0.01, *** P < 0.001, **** P < 0.0001.
3.5. Differences in enrichment function between high and low risk groups
In terms of KEGG pathways, cell cycle, complement and coagulation cascades, neutrophil outer trap formation, nitrogen metabolism, p53 signaling pathway, ribosome, and spliceosome pathways were significantly enriched in the high-risk group (A). In contrast, ascorbate and aldehyde metabolism, cofactor biosynthesis, fatty acid degradation, fatty acid metabolism, glycosaminoglycan biosynthesis, lysosomes, interconversion of pentose and glucuronide, peroxisomes, propionate metabolism, valine, leucine and isoleucine degradation were significantly enriched in the low-risk group (B).
Figure 6. Gene set enrichment analysis (GSEA) for the high- and low-risk groups. (A) The activated KEGG terms in the high-risk group. (B) The activated KEGG terms in the low-risk group. (C) The enriched GO terms in the high-risk group. (D) The enriched GO terms in the low-risk group.
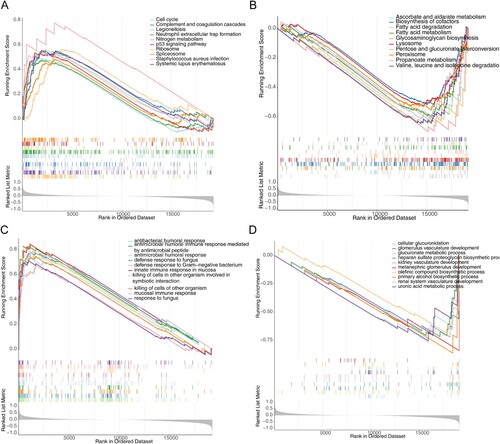
In terms of GO biological processes, antimicrobial humoral responses, antimicrobial peptide-mediated antimicrobial humoral immune responses, fungal defense responses, defense responses against Gram-negative bacteria, mucosal intrinsic immune responses, killing of cells in other organisms involved in symbiotic interactions, killing of cells in other organisms, mucosal immune responses, and responses against fungi were at high risk in the group was significantly enriched (C). In contrast, cellular glucuronidation, glomerular vascular development, glucuronide metabolic processes, acetyl heparan sulfate proteoglycan biosynthetic processes, renal vascular development, posterior renal glomerular development, olefin compound biosynthetic processes, boosterol biosynthetic processes, renal system vasculature development, and glucuronide metabolic processes were significantly enriched in the low-risk group (D).
3.6. Impact of risk model on immune heterogeneity
In this study, the results of ESTIMATE analysis of MM samples could be concluded that there were significant differences in immune scores and ESTIMATE scores between high and low risk groups (P < 0.05) (A). In addition, the proportion of 22 immune cells in the samples was calculated using the CIBERSORT algorithm and the LM22 gene set to obtain the remaining samples high = 392, low = 392. We plotted box line plots and stacked bar graphs based on the proportion of immune cells in the remaining samples (B,C). And meanwhile, the differences in immune cells infiltration were compared in the high and low risk groups using the rank sum test, which was plotted as a box line plot for visualization. As can be seen from D, using the CIBERSORT algorithm, 13 immune cells such as memory B cells, plasma cells, and CD8 T cells differed between high and low risk groups (P < 0.05).
Figure 7. Immune related analyzes. (A) Box plot of stromal score, immune scores and ESTIMATE scores in high- and low-risk groups. (B) Histogram for 22 immune cells proportions in each MM patient. (C) Boxplot of the proportion of immune cells in the remaining samples. (D) Boxplot of 22 immune cells proportions in high- and low-risk groups. (E) Violin plot of cytolytic activity (CYT) levels in high- and low-risk groups. (F) Violin plot of antigen presentation mechanism (APM), tumor infiltrating lymphoid cells (TILs) and T cell infiltration relative score (TIS) in high- and low-risk groups. ns, not significant, * P < 0.05, ** P < 0.01, *** P < 0.001, **** P < 0.0001.
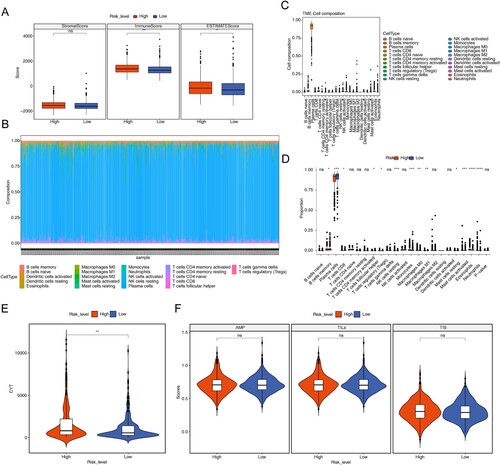
In addition, this study also used ssGSEA to calculate APM, TILs, and TIS for each sample and compared CYT, APM, TILs, and TIS between high- and low-risk groups using the rank sum test. The plotted box plots showed that CYT was significantly higher in the high-risk group than in the low-risk group (E,F).
3.7. Potential chemotherapy drug forecast
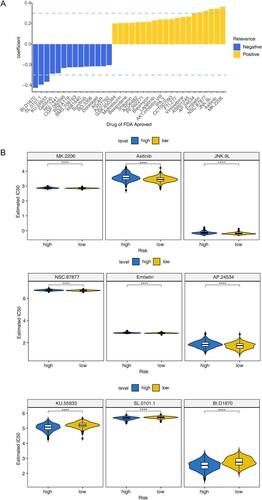
In this study, 9 drugs were obtained through spearman correlation analysis, indicating the IC50 of BI.D1870, SL.0101.1 and KU.55933 was negatively correlated with risk score, the correlation coefficient was less than-0.3. While the IC50 of AP.24534, Embelin, NSC.87877, JNK.9L, Axitinib and MK.2206 was positively correlated with risk score, and the correlation coefficient was more than 0.3 (A). In addition, the IC50 values of 9 drugs were compared between high and low risk score groups. The results showed that there were significant differences among these drugs (P < 0.05). It showed that these drugs may be some potential chemotherapy drugs (B).
Figure 8. Potential drug prediction (A) Spearman correlation analysis between risk score and drugs from drug sensitivity in cancer (GDSc) database. (B) The 50% inhibitory concentration (IC50) of nine drugs in high- and low-risk groups. **** P < 0.0001.
4. Discussion
MM is a malignant hematological disease frequently developed in the elderly [Citation23,Citation24]. The aging of the population has witnessed increasing incidence of MM in China [Citation25]. MM usually develops from monoclonal gamma globulin disease (MGUS) of unknown significance [Citation26]. Although application of new drugs has proved great success in the clinical treatment of MM, they fail to prevent the later development of resistance and the recurrence of the disease [Citation27,Citation28]. Therefore, MM is still considered a fatal disease with no cure. A comprehensive understanding of the genetic backgrounds and tumor microenvironment is ultimate for the prevention, treatment, and prognosis evaluation of MM.
As a kind of PCD, the role of cuproptosis in tumorigenesis remains unknown, so we evaluated the prognostic value of CRGs in MM. In this study, MM patients were divided into three clusters, and it was found that there were significant differences in survival status, stages and ethnic types among different clusters, and the expression of copper death-related genes in different clusters was also different, especially in cluster 1 and cluster 3. After that, DEGs was selected as a candidate copper-related gene based on cluster 1 and cluster 3. After machine learning, four CRGs (CDKN2A, BCL3, KCNA3 and TTC14) were screened out. We explored the expression signature of 4 CRGs (CDKN2A, BCL3, KCNA3 and TTC14) in MM tissues and examined their relationships with OS. Clinical correlation analysis showed that there were significant differences in risk scores for stage, sample type, cluster and vital subtypes. We also verified the risk score was a reliable independent prognostic factor for MM patients. The CDKN2A expression had a function in the cell cycle control and was strongly correlated with the origin of variety tumors (including glioma, pancreatic cancer, clear-cell renal cell carcinoma, etc.) [Citation29–32]. Furthermore, CDKN2A was found to be silenced by methylation in MM [Citation33]. Bcl-3 is an established oncogene in hematologic malignancies, such as B-cell chronic lymphocytic leukemias [Citation34]. In cells, Bcl-3 can regulate cell differentiation, control cell proliferation, promote apoptosis, and participate in the cell cycle and DNA damage response. In the human body, Bcl-3 is closely related to various immune and inflammatory pathologies, and also related to occurrence, development, invasion and prognosis of various blood and solid tumors [Citation35]. Furthermore, Brocke-Heidrich K et al. have demonstrated the upregulation of BCL3 by IL-6 in INA-6 and other MM cell lines. KCNA3 and TTC14 as the newly CRGs we discovered [Citation36], their prognostic mechanism for MM needs to be further studied.
Complex cancer–immune system interactions generate both pro- and anti-tumor effects, and whose balance can be altered in favor of immunosuppressive environment, promoting a tumor progression in MM. These include impairment of antigen processing and presentation, T cell, NK and NKT cell, local recruitment, expansion and activation of immune suppressor cells like T regulatory cells (Tregs) and myeloid derived suppressor cells (MDSCs), differentiation of the protumoral tumor-associated macrophages and Th17 cells [Citation37–40]. In terms of KEGG pathways, cell cycle, complement and coagulation cascades, neutrophil outer trap formation, nitrogen metabolism, p53 signaling pathway, ribosome, and spliceosome pathways were significantly enriched in the high-risk group. In the GO biological processes, antimicrobial humoral responses and responses against fungi were significantly enriched at high-risk group. In addition, immune score, ESTIMATE score and CYT were significantly different between high and low risk groups, while 13 immune cells such as memory B cells, plasma cells, T cells CD8 were also different in the two groups. These results suggest that the prognostic risk model constituted by CRGs may play an important role via GO and KEGG pathways in MM. Through the relationship analysis between risk score and immune score of 4 CRGS, we found that the risk model may affect the immune process of MM.
A total of nine drugs were predicted in our study, namely BI.D1870, SL.0101.1, KU.55933, AP.24534, Embelin, NSC.87877, JNK.9L, Axitinib and MK.2206. Among them, BI.D1870 has been proved to be a potential drug for multiple myeloma [Citation41,Citation42]. In addition, plasma cell leukemia is secondary to multiple myeloma, which is one of the late manifestations of multiple myeloma. AP.24534 has been proved to be a potential therapeutic drug for plasma cell leukemia [Citation43]. Embelin is an inhibitor of X-linked inhibitor of apoptosis protein, which has anti-inflammatory and anticancer activities, and can inhibit the activation of signal transducer and activator of transcription 3 in multiple myeloma, so it is considered as a potential therapeutic drug [Citation44]. Axitinib is a common drug for the treatment of renal cell carcinoma, but its application in multiple myeloma has not been found [Citation45–47]. MK.2206 is a novel allosteric pan-Akt inhibitor, which has good anti-myeloma activity in MM cell lines and patient cells [Citation48,Citation49]. Ataxia Telangiectasia Mutated (ATM) can repair DNA and activate cell cycle checkpoints. Incorrect DNA damage repair will lead to genome instability [Citation50]. ATM inhibition will increase the sensitivity of cancer cells to radiotherapy [Citation51], so ATM inhibitors are one of the development directions of anticancer drugs, and KU-55933 is one of them. Studies have shown that ATM can increase the glucose uptake of cancer cells, and KU-55933 can inhibit tumor growth and metastasis in mice breast tumors by inhibiting GLUT1 translocation and vimentin expression [Citation52]. As for NSC.87877, an effective bispecific protein phosphatase 26 (DUSP26) inhibitor, it has been found that it can inhibit the growth of neuroblastoma cell line and induce apoptosis [Citation53]. Unfortunately, the reports about the potential anticancer effects of JNK.9L and L.0101.1 have not been found.
We develop a prognostic model of CRGs in MM. Cuproptosis is a novel type of cell death, it may bring up new solutions for the treatment of cancer. Moreover, risk score was a reliable independent prognostic factor for MM patients, and the nomogram shows the prediction effect of risk model. Additionally, the prognostic score focusing on CRGs’ expression signature showed a good performance in the prediction of MM survivorship, and other significant factors (stage, sample type, cluster and vital subtypes) with predictive values were considered in this study. Thus, the CDKN2A, BCL3, KCNA3 and TTC14 showed a robust prognostic effect for MM.
Supplemental Material
Download TIFF Image (2.5 MB)Supplemental Material
Download TIFF Image (5 MB)Disclosure statement
No potential conflict of interest was reported by the author(s).
Additional information
Funding
References
- Tai YT, Cho SF, Anderson KC. Osteoclast immunosuppressive effects in multiple myeloma: role of programmed cell death ligand 1. Front Immunol. 2018;9:1822. doi:10.3389/fimmu.2018.01822
- Rajkumar SV, Blood E, Vesole D, et al. Phase Iii clinical trial of thalidomide plus dexamethasone compared with dexamethasone alone in newly diagnosed multiple myeloma: A clinical trial coordinated by the eastern cooperative oncology group. J Clin Oncol. 2006;24(3):431–436. doi:10.1200/JCO.2005.03.0221
- Laubach JP, Voorhees PM, Hassoun H, et al. Current strategies for treatment of relapsed/refractory multiple myeloma. Expert Rev Hematol. 2014;7(1):97–111. doi:10.1586/17474086.2014.882764
- Sonneveld P, Avet-Loiseau H, Lonial S, et al. Treatment of multiple myeloma with high-risk cytogenetics: A consensus of the international myeloma working group. Blood. 2016;127(24):2955–2962. doi:10.1182/blood-2016-01-631200
- Ruiz LM, Libedinsky A, Elorza AA. Role of copper on mitochondrial function and metabolism. Front Mol Biosci. 2021;8:711227. doi:10.3389/fmolb.2021.711227
- Oliveri V. Selective targeting of cancer cells by copper ionophores: An overview. Front Mol Biosci. 2022;9:841814. doi:10.3389/fmolb.2022.841814
- Gupte A, Mumper RJ. Elevated copper and oxidative stress in cancer cells as a target for cancer treatment. Cancer Treat Rev. 2009;35(1):32–46. doi:10.1016/j.ctrv.2008.07.004
- Rezaei A, Khanamani Falahati-Pour S, Mohammadizadeh F, et al. Effect of a copper (Ii) complex on the induction of apoptosis in human hepatocellular carcinoma cells. Asian Pac J Cancer Prev. 2018;19(10):2877–2884. doi:10.22034/apjcp.2018.19.10.2877
- Li H, Wang J, Wu C, et al. The combination of disulfiram and copper for cancer treatment. Drug Discov Today. 2020;25(6):1099–1108. doi:10.1016/j.drudis.2020.04.003
- Xu Y, Zhou Q, Feng X, et al. Disulfiram/copper markedly induced myeloma cell apoptosis through activation of Jnk and intrinsic and extrinsic apoptosis pathways. Biomed Pharmacother Biomed Pharmacotherapie. 2020;126:110048. doi:10.1016/j.biopha.2020.110048
- Agarwal A, Khandelwal A, Pal K, et al. A novel Pro-oxidant combination of resveratrol and copper reduces transplant related toxicities in patients receiving high dose melphalan for multiple myeloma (Rescu 001). PloS one. 2022;17(2):e0262212. doi:10.1371/journal.pone.0262212
- Tsvetkov P, Coy S, Petrova B, et al. Copper induces cell death by targeting lipoylated Tca cycle proteins. Science (New York, NY). 2022;375(6586):1254–1261. doi:10.1126/science.abf0529
- Gaggelli E, Kozlowski H, Valensin D, et al. Copper homeostasis and neurodegenerative disorders (Alzheimer's, prion, and Parkinson's diseases and amyotrophic lateral sclerosis). Chem Rev. 2006;106:1995–2044. doi:10.1021/cr040410w
- Kahlson MA, Dixon SJ. Copper-induced cell death. Science (New York, NY). 2022;375(6586):1231–1232. doi:10.1126/science.abo3959
- Dong C, Dang D, Zhao X, et al. Integrative characterization of the role of Il27 in melanoma using bioinformatics analysis. Front Immunol. 2021;12:713001. doi:10.3389/fimmu.2021.713001
- Wang Y, Wang Z, Sun J, et al. Identification of Hcc subtypes with different prognosis and metabolic patterns based on mitophagy. Front Cell Dev Biol. 2021;9:799507. doi:10.3389/fcell.2021.799507
- Shi H, Hou Y, Su X, et al. Mechanism of action of Tripterygium wilfordii for treatment of idiopathic membranous nephropathy based on network pharmacology. Renal Fail. 2022;44(1):116–125. doi:10.1080/0886022X.2021.2024850
- Zhang M, Zhu K, Pu H, et al. An immune-related signature predicts survival in patients with lung adenocarcinoma. Front Oncol. 2019;9:1314. doi:10.3389/fonc.2019.01314
- Wang S, Su W, Zhong C, et al. An eight-circrna assessment model for predicting biochemical recurrence in prostate cancer. Front Cell Dev Biol. 2020;8:599494. doi:10.3389/fcell.2020.599494
- Liu TT, Li R, Huo C, et al. Identification of Cdk2-related immune forecast model and cerna in lung adenocarcinoma, a Pan-cancer analysis. Front Cell Dev Biol. 2021;9:682002. doi:10.3389/fcell.2021.682002
- Fang Y, Huang S, Han L, et al. Comprehensive analysis of peritoneal metastasis sequencing data to identify Linc00924 as a prognostic biomarker in gastric cancer. Cancer Manag Res. 2021;13:5599–5611. doi:10.2147/CMAR.S318704
- Ding C, Shan Z, Li M, et al. Characterization of the fatty acid metabolism in colorectal cancer to guide clinical therapy. Mol Ther Oncolytics. 2021;20:532–544. doi:10.1016/j.omto.2021.02.010
- Leleu X, Fouquet G, Richez V, et al. Carfilzomib weekly plus melphalan and prednisone in newly diagnosed transplant-ineligible multiple myeloma (Ifm 2012-03): A phase I trial. Clin Cancer Res Official J Am Assoc Cancer Res. 2019;25(14):4224–4230. doi:10.1158/1078-0432.CCR-18-3642
- Späth F, Wibom C, Krop EJM, et al. Immune marker changes and risk of multiple myeloma: A nested case-control study using repeated Pre-diagnostic blood samples. Haematologica. 2019;104(12):2456–2464. doi:10.3324/haematol.2019.216895
- Liu W, Liu J, Song Y, et al. Mortality of lymphoma and myeloma in China, 2004-2017: An observational study. J Hematol Oncol. 2019;12(1):22. doi:10.1186/s13045-019-0706-9
- Kyle RA, Durie BG, Rajkumar SV, et al. Monoclonal gammopathy of undetermined significance (mgus) and smoldering (asymptomatic) multiple myeloma: imwg consensus perspectives risk factors for progression and guidelines for monitoring and management. Leukemia. 2010;24(6):1121–1127. doi:10.1038/leu.2010.60
- Hayes KE, Batsomboon P, Chen WC, et al. Inhibition of the Fad containing Er oxidoreductin 1 (Ero1) protein by En-460 as a strategy for treatment of multiple myeloma. Bioorg Med Chem. 2019;27(8):1479–1488. doi:10.1016/j.bmc.2019.02.016
- Szalat R, Munshi NC. Novel agents in multiple myeloma. Cancer J (Sudbury, Mass). 2019;25(1):45–53. doi:10.1097/PPO.0000000000000355
- Rayess H, Wang MB, Srivatsan ES. Cellular senescence and tumor suppressor gene P16. Int J Cancer. 2012;130(8):1715–1725. doi:10.1002/ijc.27316
- Kimura H, Klein AP, Hruban RH, et al. The role of inherited pathogenic Cdkn2a variants in susceptibility to pancreatic cancer. Pancreas. 2021;50(8):1123–1130. doi:10.1097/MPA.0000000000001888
- Śledzińska P, Bebyn MG, Furtak J, et al. Prognostic and predictive biomarkers in gliomas. Int J Mol Sci. 2021;22(19):10373. doi:10.3390/ijms221910373
- Bui TO, Dao VT, Nguyen VT, et al. Genomics of clear-cell renal cell carcinoma: A systematic review and meta-analysis. Eur Urol. 2022;81(4):349–361. doi:10.1016/j.eururo.2021.12.010
- Smith EM, Boyd K, Davies FE. The potential role of epigenetic therapy in multiple myeloma. Br J Haematol. 2010;148(5):702–713. doi:10.1111/j.1365-2141.2009.07976.x
- Maldonado V, Melendez-Zajgla J. Role of Bcl-3 in solid tumors. Mol Cancer. 2011;10:152. doi:10.1186/1476-4598-10-152
- Wulczyn FG, Naumann M, Scheidereit C. Candidate proto-oncogene Bcl-3 encodes a subunit-specific inhibitor of transcription factor Nf-kappa B. Nature. 1992;358(6387):597–599. doi:10.1038/358597a0
- Brocke-Heidrich K, Ge B, Cvijic H, et al. Bcl3 Is induced by Il-6 Via Stat3 binding to intronic enhancer Hs4 and represses its own transcription. Oncogene. 2006;25(55):7297–7304. doi:10.1038/sj.onc.1209711
- Schreiber RD, Old LJ, Smyth MJ. Cancer immunoediting: integrating immunity's roles in cancer suppression and promotion. Science (New York, NY). 2011;331(6024):1565–1570. doi:10.1126/science.1203486
- Guillerey C, Nakamura K, Vuckovic S, et al. Immune responses in multiple myeloma: role of the natural immune surveillance and potential of immunotherapies. Cell Mol Life Sci: CMLS. 2016;73(8):1569–1589. doi:10.1007/s00018-016-2135-z
- Leone P, Berardi S, Frassanito MA, et al. Dendritic cells accumulate in the bone marrow of myeloma patients where they protect tumor plasma cells from Cd8+ T-cell killing. Blood. 2015;126(12):1443–1451. doi:10.1182/blood-2015-01-623975
- Leone P, Di Lernia G, Solimando AG, et al. Bone marrow endothelial cells sustain a tumor-specific Cd8(+) T cell subset with suppressive function in myeloma patients. Oncoimmunology. 2019;8(1):e1486949. doi:10.1080/2162402X.2018.1486949
- Chae HD, Dutta R, Tiu B, et al. RSK inhibitor BI-D1870 inhibits acute myeloid leukemia cell proliferation by targeting mitotic exit. Oncotarget. 2020;11(25):2387–2403. doi:10.18632/oncotarget.27630
- Shimura Y, Kuroda J, Ri M, et al. RSK2(Ser227) at N-terminal kinase domain is a potential therapeutic target for multiple myeloma. Mol Cancer Ther. 2012;11(12):2600–2609. doi:10.1158/1535-7163.MCT-12-0605
- Chaudhary RK, Patil P, Ananthesh L, et al. Identification of signature genes and drug candidates for primary plasma cell leukemia: An integrated system biology approach. Comput Biol Med. 2023;8(162):107090. doi:10.1016/j.compbiomed.2023.107090
- Heo JY, Kim HJ, Kim SM, et al. Embelin suppresses STAT3 signaling, proliferation, and survival of multiple myeloma via the protein tyrosine phosphatase PTEN. Cancer Lett. 2011;308(1):71–80. doi:10.1016/j.canlet.2011.04.015
- Kelly RJ, Rixe O. Axitinib. (AG-013736). Recent Results Cancer Res. 2010;184:33–44. doi:10.1007/978-3-642-01222-8_3
- Motzer RJ, Robbins PB, Powles T, et al. Avelumab plus axitinib versus sunitinib in advanced renal cell carcinoma: biomarker analysis of the phase 3 JAVELIN renal 101 trial. Nat Med. 2020;26(11):1733–1741. doi:10.1038/s41591-020-1044-8
- Motzer RJ, Penkov K, Haanen J, et al. Avelumab plus axitinib versus sunitinib for advanced renal-cell carcinoma. N Engl J Med. 2019;380(12):1103–1115. doi:10.1056/NEJMoa1816047
- Xiang RF, Wang Y, Zhang N, et al. MK2206 enhances the cytocidal effects of bufalin in multiple myeloma by inhibiting the AKT/mTOR pathway. Cell Death Dis. 2017;8(5):e2776. doi:10.1038/cddis.2017.188
- Ramakrishnan V, Kimlinger T, Haug J, et al. Anti-myeloma activity of Akt inhibition is linked to the activation status of PI3 K/Akt and MEK/ERK pathway. PLoS One. 2012;7(11):e50005. doi:10.1371/journal.pone.0050005
- Dahl ES, Aird KM. Ataxia-Telangiectasia mutated modulation of carbon metabolism in cancer. Front Oncol. 2017;29(7):291. doi:10.3389/fonc.2017.00291
- Jin MH, Oh DY. ATM in DNA repair in cancer. Pharmacol Therap. 2019;203:107391. doi:10.1016/j.pharmthera.2019.07.002
- Harris BRE, Zhang Y, Tao J, et al. ATM inhibitor KU-55933 induces apoptosis and inhibits motility by blocking GLUT1-mediated glucose uptake in aggressive cancer cells with sustained activation of Akt. FASEB J. 2021;35(4):e21264. doi:10.1096/fj.202001415RR
- Shi Y, Ma IT, Patel RH, et al. NSC-87877 inhibits DUSP26 function in neuroblastoma resulting in p53-mediated apoptosis. Cell Death Dis. 2015;6(8):e1841. doi:10.1038/cddis.2015.207