
ABSTRACT
Objectives
We performed a feasibility study of an FDA-approved commercial ddPCR assay to measure BCR::ABL1 in CML patients treated using TKI therapy.
Methods
Assay performance of standard RQ-PCR and commercially available FDA-approved ddPCR were compared to measure BCR::ABL1 p210 transcripts in RNA samples from 100 CML patients who received TKI therapy.
Results
%BCR::ABL1/ABL1IS levels obtained from both methods were not statistically significant difference after normalization with batch-specific conversion factor (p = 0.0651). The correlation and agreement of %BCR::ABL1/ABL1IS between the two assays were high. Molecular response stratification data showed 56% concordance between RQ-PCR and ddPCR, and 37% higher residual disease detection using ddPCR. Furthermore, 21.21% (7/33) of RQ-PCR undetectable samples were detected by ddPCR, representing high sensitivity to quantify the low abundance of BCR::ABL1 transcripts.
Conclusion
ddPCR was proven to be a highly sensitive method with the potential to overcome some limitations of traditional RQ-PCR, and has the potential of being a valuable tool for monitoring BCR::ABL1 transcripts in CML during TKI therapy. (163 words)
Introduction
Chronic myeloid leukemia (CML) is a myeloproliferative neoplasm characterized by the presence of chromosomal translocation, t(9;22)(q34;q11.2), called Philadelphia (Ph) chromosome [Citation1]. The Ph chromosome encodes BCR::ABL1 oncoprotein with high constitutive tyrosine kinase activity that dysregulates several biological pathways including JAK/STAT, PI3K/AKT and RAS/MEK. This activation promotes hematopoietic stem cell transformation and initiation of malignant leukemic cell proliferation [Citation2]. Treatment of CML has been dramatically improved since the discovery of tyrosine kinase inhibitor (TKI), imatinib mesylate (IM) and other generations of TKIs to target BCR::ABL1, yielding a 10-year overall survival rate of 80%–90% CML patients [Citation3,Citation4]. Along with the continuous improvement in TKIs, significant progress has been made in developing CML patient management guidelines, particularly laboratory assays for the detection of BCR::ABL1 mRNA during therapy.
Real-time quantitative polymerase chain reaction (RQ-PCR) for the measurement of BCR::ABL1 mRNA has been introduced for both disease monitoring and detection of measurable residual disease (MRD) in CML during TKI treatment [Citation5]. The assay has become the gold standard for monitoring BCR::ABL1 transcripts in peripheral blood samples and is also used to evaluate the achievement of molecular response (MR) to TKI treatment in laboratories worldwide [Citation6]. RQ-PCR precisely quantifies the ratio of BCR::ABL1 fusion to ABL1 (or other internationally acceptable control genes such as GAPDH and GUSB) and reports as an international scale (IS) after adjusting with center-specific conversion factors (CFs) [Citation7]. From 2010 to 2020, like other centers, our laboratory devoted considerable effort as workforce, time and finance to achieve CFs for IS calculation and, more importantly, maintain laboratory quality standards and proficiencies. However, the establishment and validation of CFs are time-consuming, complex, expensive and difficult for laboratories to access, especially in resource-limited countries [Citation7,Citation8]. This led to the development of International Genetic Reference Panels for the quantitation of BCR::ABL1 mRNA; the first panel was known as the WHO-accredited standard for IS calibration in 2010, while the second panel was established in 2016 for quantification of BCR::ABL1 by reverse-transcription droplet digital PCR (ddPCR) [Citation9,Citation10].
The accuracy, standardization and sensitivity of currently available assays to detect BCR::ABL1 mRNA are essential, particularly in patients with deep molecular response (DMR) and treatment-free remission after discontinuing TKI therapy. RQ-PCR is highly sensitive and recommended for monitoring BCR::ABL1 transcripts but this assay has limitations including the requirement for standard curves of both fusion and internal control genes. Moreover, the lower limit of detection and quantification of particular RQ-PCR platforms affects DMR and discontinuation of therapy [Citation11–13]. MR level determination is dependent on the sensitivity of the monitoring technique; hence, the biased diagnostic performance of BCR::ABL1 detection and quantification may impact the inclusion of CML patients in TKI discontinuation or de-escalation [Citation14,Citation15]. Several assays with higher specificity and sensitivity to detect BCR::ABL1 transcripts have recently been developed such as digital PCR (dPCR), DNA PCR (to amplify BCR::ABL1 DNA instead of RNA) and droplet digital PCR (ddPCR) which was recently approved by the Food and Drug Administration (FDA) for BCR::ABL1 monitoring [Citation16,Citation17].
Digital droplet/Droplet digital PCR (ddPCR) is a third generation of conventional PCR technology based on reaction partitioning (mimicking limiting dilution) into approximately many thousand droplets (each droplet is equivalent to an independent PCR reaction). The compositions of ddPCR are similar to RQ-PCR with target genes monitored by specific primer-Taqman probe technology and quantified by the fluorescence intensities in the reactions. After PCR amplification, copy numbers (CNs) of the target gene are calculated by Poisson distribution as the ratio of positive droplets to negative droplets. Therefore, the ddPCR assay allows direct absolute quantitation of nucleic acid targets without the need for calibration curves [Citation18]. Furthermore, ddPCR has high reliability, reproducibility and sensitivity to measure BCR::ABL1 levels in CML patients [Citation12,Citation13,Citation18,Citation19].
Commercialized ddPCR for BCR::ABL1 monitoring is available and approved by the FDA, resulting in the assay being well-standard, besides the high initial cost. In parallel with continuous improvements in the management of CML, the number of accumulated CML monitoring cases, especially cases with DMR, has gradually increased and reached 3,500 samples in our setting by 2021. Therefore, we decided to install a commercialized ddPCR platform to replace the traditional RQ-PCR for monitoring BCR::ABL1 transcripts in CML during treatment.
This paper describes the assay performances of an FDA-approved ddPCR compared to conventional RQ-PCR for measurement of BCR::ABL1 p210 fusion transcripts in CML patients undergoing TKI therapy.
Material and methods
Samples
RNA samples from 100 CML patients were quantified for BCR::ABL1 p210 fusion transcripts by RQ-PCR analysis in the Human Genetic Laboratory, Department of Pathology, Ramathibodi Hospital. Clinical characteristics of the patients in this study are summarized in Table S1. Total RNA was isolated from EDTA peripheral blood samples using QIAzolTM Lysis Reagent (QIAGEN, Germany) according to the manufacturer’s instructions and the concentration was measured using a Nanodrop 2000 Spectrophotometer (Thermo Scientific, USA). This work was approved by the Ethics Committee on Human Rights related to research involving human subjects, Faculty of Medicine, Ramathibodi Hospital, Mahidol University, Thailand following the principles of the Declaration of Helsinki (ID MURA2020/1357).
Real-time quantitative PCR (RQ-PCR)
Real-time quantitative PCR based on TaqMan technology was performed according to Europe Against Cancer (EAC) Program protocol to measure amounts of BCR::ABL1 fusion transcripts [Citation5]. Briefly, complementary DNA (cDNA) was generated from 1 µg RNA using SuperScript™ VILO™ cDNA Synthesis Kit (Thermo Fisher Scientific, USA) with random oligonucleotide primers. RQ-PCR experiments were performed on ABI ViiA 7 Real-Time PCR System (Thermo Fisher Scientific, USA) using ABL1 as a housekeeping control gene. Data were analyzed using Viia7 Software V. 1.2.2 and reported as BCR::ABL1/ABL1 copy ratio. The %IS was calculated using laboratory-specific conversion factors. RNA isolated from the K562 cell line and nuclease-free water were used as positive and negative controls, respectively. The laboratory has achieved ISO15189 and 15190 accreditations and participated in the College of American Pathology (CAP) External Quality Assurance (EQA)/Proficiency Testing program.
Droplet digital PCR (ddPCR)
Droplet digital PCR was used to analyze the level of BCR::ABL1 transcripts in the same set of RNA samples using a QXDxTM BCR-ABL %IS Kit (Bio-Rad, USA) with QX200TM AutoDGTM Droplet DigitalTM PCR System (Bio-Rad, USA). Briefly, cDNA of one microgram of patients’ RNA samples, 10 µl of kit controls and 10 µl of %IS calibrators were generated using QxDxTM 5x iScriptTM Select Reaction Mix, QxDxTM RT Primers and QxDxTM iScriptTM Advanced Reverse Transcriptase according to the manufacturer instructions. RT condition followed primer binding at 25°C for 10 min, 42°C for 45 min and 85°C for 5 min. The ddPCR mixture was performed and mixed with cDNA samples (2 wells per sample simultaneously) in a 96-well plate using a QXDxTM BCR-ABL %IS Kit according to the manufacturer’s instructions, and the reactions were partitioned by a QX200TM Automated Droplet Generator. The PCR amplification condition was 95°C for 10 min, 5 cycles of 94°C for 30 s, 60°C for 1 min, 35 cycles of 94°C for 30 s and 64°C for 1 min, then 95°C for 10 min for enzyme deactivation, 4°C for 30 min for droplet stabilization and finally held at 4°C. Amplification signals of both BCR::ABL1 and ABL1 in the samples were measured using a QX200TM Droplet Reader. Data were analyzed by QuantaSoftTM 1.7.4 software. Exclusion criteria included samples with less than 10,000 droplets per well and ABL1 copies of less than 10,000. Therefore, we performed a further experiment. The quality of all calibrators and controls was determined and considered acceptable according to the commercial test kit recommendation guidelines. Percentage ratio of BCR::ABL1 was calculated for the IS by multiplying by the lot-specific conversion factor, as indicated in the kit insert.
Statistical analysis
GraphPad Prism version 9.0 software (La Jolla, CA, USA) was used to calculate the statistical parameters. The data were not normally distributed, as determined using the Kolmogorov–Smirnov test, and expressed as median with interquartile range (IQR). The median values of %BCR::ABL1/ABL1IS assessed by ddPCR and RQ-PCR were compared using the Mann–Whitney test. Correlation and agreement between %BCR::ABL1/ABL1IS from both methods were performed by Spearman’s rank correlation coefficient (rs) analysis and Bland–Altman analysis, respectively. All data were classified according to %BCR::ABL1/ABL1IS, with data distribution of MR stratification from both methods compared by the Chi-square test. In all statistical tests, a p-value less than 0.05 was considered statistically significant.
Results
Comparison of RQ-PCR and ddPCR results
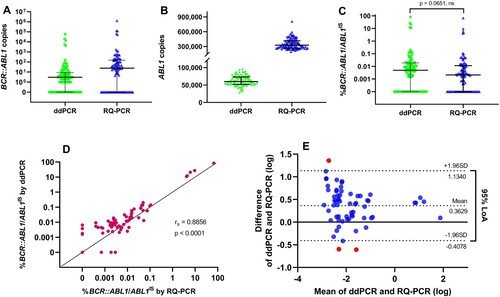
All the CML patients included in this report were reviewed and diagnosed by hematologists. The gold standard RQ-PCR assay was compared to that of a commercially available FDA-approved ddPCR assay to monitor BCR::ABL1 transcriptional levels in CML patients during therapy. The results of the ddPCR showed that all samples had sufficient droplet numbers to pass the minimum acceptance criteria for data analysis. In our experiment, generated droplets ranged between 12,685 to 20,610, median = 17,069. The ddPCR assay detected cDNA levels at a lower range of BCR::ABL1 (IQR, 0 to 8.75; median = 3.00), whereas, RQ-PCR assay (IQR, 0 to 151.50; median = 24.39). Similarly, copy numbers of ABL1 control cDNA detected by ddPCR (IQR, 51,835 to 73,015; median = 60,105), whereas, RQ-PCR (IQR, 266,386 to 415,648; median = 327,635) (A-B). Clinical comparisons of both assays were conducted on %BCR::ABL1/ABL1IS. However, there was no statistically significant difference between %BCR::ABL1/ABL1IS (p = 0.0651) obtained from ddPCR (IQR, 0 to 0.0187; median = 0.0049) and RQ-PCR (IQR, 0 to 0.0113; median = 0.0021) when employing specific CFs of both assays to calculate %BCR::ABL1/ABL1IS (C). The correlation and agreement of %BCR::ABL1/ABL1IS from ddPCR and RQ-PCR were also evaluated. As expected, Spearman’s rank correlation coefficient analysis showed highly correlated results between the two methods with a correlation coefficient of rs = 0.8856, p < 0.0001, and a 95% confidence interval of 0.8325 to 0.9226 (D). The Bland–Altman test was used to analyze the difference between %BCR::ABL1/ABL1IS obtained from ddPCR and RQ-PCR. Results showed the average difference between the two methods as 0.3629, whereas the limit of agreement (LoA) between the two methods ranged from −0.4078 to 1.1340. Concordance analysis showed that more than 95% (95.15%) of the difference of the %BCR::ABL1/ABL1IS results lay within the LoA (E), indicating no systematic difference between the two methods.
Figure 1. The results measured by ddPCR and RQ-PCR. The solid line and bars indicate median and IQR, respectively. (A) BCR::ABL1 transcripts and (B) ABL1 reference gene, while no differences were observed in %BCR::ABL1/ABL1IS between the two assays using the Mann-Whitney test. ns means not significant (C). (D) Correlation between ddPCR and RQ-PCR for %BCR::ABL1/ABL1IS results using Spearman’s test (rs = 0.8856, p < 0.0001). (E) Bland-Altman analysis was used to plot differences between ddPCR and RQ-PCR measurements against the mean sample quantification. The dotted line indicates bias (mean difference) with a 95% LoA (upper and lower limit +/− 1.96SD).
Molecular response stratification
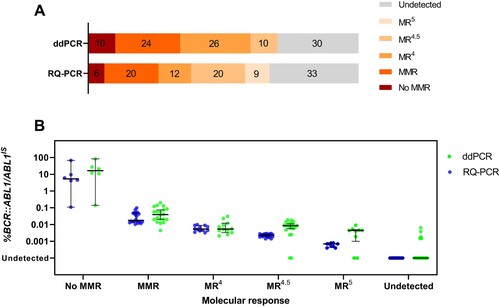
In our data, 67% of samples were BCR::ABL1 detectable by RQ-PCR, whereas 70% were detected by ddPCR. According to the European Leukemia Network (ELN) recommendations, ddPCR showed that 10% of samples did not achieve major molecular response (MMR), 24% in MMR, 26% in MR4 and 10% in MR4.5. By contrast, RQ-PCR showed that 6% of samples did not achieve MMR, 20% in MMR, 12% in MR4, 20% in MR4.5 and 9% in MR5 (A). Globally, 56% of samples were classified in similar MR categories with both methods and 44% were classified into different MR categories: 37% detected a higher level of residual disease by ddPCR, whereas 7% detected more residual diseases by RQ-PCR. The distribution of MR stratification was significantly different between the two methods (p = 0.0019, χ² test). The ddPCR assay detected higher residual disease in samples than the conventional RQ-PCR assay. Among the 33 samples of RQ-PCR that were undetectable, 7 samples (21.21%) were detected as positive using ddPCR. However, in the group of ddPCR undetectable, 4 out of 30 (13.33%) samples were detected by RQ-PCR (Table S2). Cases of deep MR, BCR::ABL1/ABL1IS value were possibly inconsistent with both RQ-PCR and ddPCR methods.
Figure 2. (A) Data distribution performed with ddPCR and RQ-PCR according to molecular response stratification. Chi-square test showed a significant difference in data distribution between the two methods (p = 0.0019). (B) Scatter plots display data distribution when samples were grouped according to molecular response based on RQ-PCR results. Lines and bars indicate median and interquartile ranges, respectively.
Feasibility in clinical samples
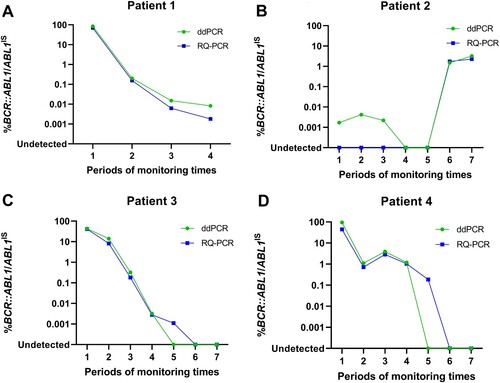
The feasibility of ddPCR for clinical use was investigated as a routine monitoring test for CML patients during therapy. Twenty-five samples derived from four CML patients undergoing TKI therapy were analyzed for %BCR::ABL1/ABL1IS by both RQ-PCR and ddPCR. The trend of %BCR::ABL1/ABL1IS along the timeline of the follow-up period obtained from both methods displayed high concordance. The ddPCR assay showed superior performance in detecting higher residual disease levels in patients 1 and 2 (A-B). Moreover, in patient 2, ddPCR detected residual disease at all three timeline points that were undetectable using RQ-PCR (B). In contrast, TKI responses in patients 3 and 4 were similar; however, some follow-up time points in the timeline were detectable for residual diseases by RQ-PCR but not by ddPCR (C-D).
Figure 3. Feasibility of ddPCR in four clinical patients compared with RQ-PCR (A-D). The Y-axis is %BCR::ABL1/ABL1IS, and the X-axis represents several periods of monitoring times.
Pitfalls of ddPCR
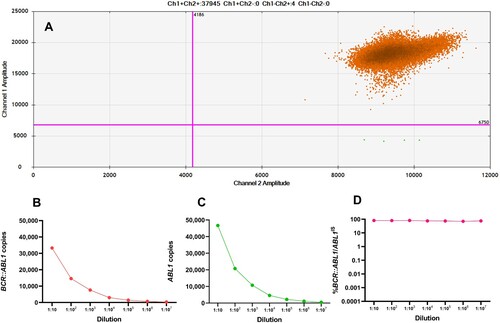
Some samples could not be interpreted using the ddPCR method since they had a very high %BCR::ABL1/AB1LIS. Excess target concentration causes over-saturation of droplets, thereby invalidating the Poisson algorithm and the ability to quantify the actual measurement. Characteristics of the 2D scatter plot obtained from saturated samples are shown in A. To solve the oversaturation of droplets, we performed RQ-PCR to measure the high value of %IS level. RNA sample quantification was performed by 10-fold serial dilutions ranging from 10−1 to 10−7. Expression levels of BCR::ABL1 and ABL1 copies decreased gradually but there were no differences when the values were converted to %BCR::ABL1/ABL1IS (B-D). However, when the sample was diluted to less than 10−4 dilutions, the level of ABL1 was lower than 10,000 copies. This was below the cutoff value recommended by ELN and could not be interpreted.
Figure 4. (A) ddPCR detection of a saturated sample. 2D scatterplot showing saturation of positive droplets without negative droplets. In serial dilutions, expression levels of BCR::ABL1 transcripts (B) and ABL1 transcripts (C) continued to decrease, whereas %BCR::ABL1/ABL1IS (D) remained constant.
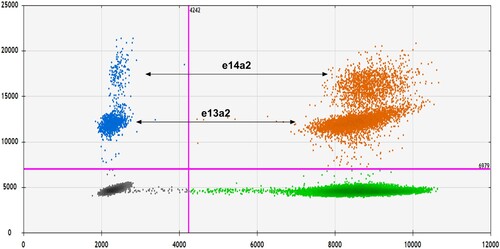
Interestingly, the 2D scatter plot of some samples had separated populations of positive droplets. Visualization of ddPCR results revealed that the positive droplets were arranged into two populations, with one population, having a higher fluorescence amplitude than the other (). Results of BCR::ABL1 transcript types of each sample screening with multiplex RT–PCR showed that the samples with this 2D scatter plot pattern had two types of BCR::ABL1 transcript variants; e13a2 and e14a2. Moreover, we collected data about the amplitude of positive droplets in the group of samples expressing only e13a2 or e14a2 to compare the differences in terms of fluorescent intensities. We found that the population of e14a2 positive droplets was amplified with a higher mean amplitude than the e13a2 transcripts variant (16,005 and 11,849, respectively). These results revealed that the e14a2 transcript population consistently exhibited higher fluorescence intensities than the e13a2 transcripts.
Figure 5. 2D scatter plots of ddPCR results. Droplets containing BCR::ABL1 and ABL1 transcripts are shown as blue and green, respectively. Droplets containing both BCR::ABL1 and ABL1 transcripts are orange, while empty droplets are gray. The two separate droplet populations represent different BCR::ABL1 transcript variants; the e14a2 transcripts exhibited higher fluorescence intensities than the e13a2 transcripts.
Discussion
Currently, most CML patients undergoing TKI therapy enjoy an improved quality of life because of the remarkable efficacy of the treatment and post-treatment monitoring. The expression level of BCR::ABL1 transcripts was a therapeutic target necessary for assessing the treatment, especially in patients with a deep molecular response and those who were candidates for therapy discontinuation. RQ-PCR is the standard method for BCR::ABL1 transcript monitoring according to the recommendations of ELN, with sensitivity to detect a small amount of relative target gene to standard calibrators. However, the technical limitations of traditional RQ-PCR in detecting very low levels of BCR::ABL1 transcripts and the different efficiency of e13a2 and e14a2 amplification have been mentioned. Therefore, more precise and sensitive methods are needed to detect residual disease for a greater molecular response of CML patients to TKIs. The current use of ddPCR is a promising alternative tool for measuring MRD for three reasons including (i) amplification efficiency differences; RQ-PCR detects amplified products in real-time, whereas ddPCR measures the endpoint of amplification, (ii) types of PCR reaction; RQ-PCR is a single bulk reaction, while ddPCR is a partitioning reaction to generate thousands of independent PCR reaction chambers, and (iii) copy number measuring; RQ-PCR needs a calibrated standard curve but ddPCR enables absolute quantification of the target molecules. They demonstrated the capability of ddPCR to overcome those limitations and proved that ddPCR is a robust, sensitive, and accurate tool in MRD monitoring, providing a more successful selection of patients eligible for TKI discontinuation [Citation20,Citation21]. In this study, ddPCR, a third-generation PCR technology that partitions samples into thousands of individual PCR reactions, was evaluated for MRD monitoring in CML patients.
The QXDxTM BCR-ABL %IS by Bio-Rad, the first FDA-approved commercial kit, was performed on 100 CML patients using the ddPCR acquisition platform. Expression levels of %BCR::ABL1/ABL1IS obtained from ddPCR were compared using the traditional standard RQ-PCR to assess the effectiveness of the kit and ddPCR systems before use in routine clinical practice for monitoring CML patients.
The molecular response of TKI treatment in a patient with CML has been defined and expanded on the existing criteria as the measurement of %BCR::ABL1/ABL1IS and calculated by multiplying the percentage value of BCR::ABL1 copies relative to ABL1 copies by the conversion factor. Our results showed that %BCR::ABL1/ABL1IS values obtained from both traditional RQ-PCR and commercialized ddPCR methods were not significantly different, even if expression levels of BCR::ABL1 transcripts and ABL1 differed. Correlation and agreement of %BCR::ABL1/ABL1IS values between ddPCR and RQ-PCR were high, consistent with other studies [Citation11,Citation18,Citation22]. However, a higher %BCR::ABL1/ABL1IS performed by ddPCR was observed than by RQ-PCR. This was evident when the samples were grouped according to MR classification based on the %IS value obtained by RQ-PCR (B). The ddPCR achieved a higher level of %BCR::ABL1/ABL1IS than RQ-PCR, resulting in a shift of samples toward lower MR classes. In addition, the stratification of samples showed the success of ddPCR in detecting residual disease in cases undetectable using RQ-PCR. By contrast, when samples have a profound molecular response level, the efficiency of ddPCR with duplicated reactions may be insufficient, resulting in a few discrepancies, with ddPCR undetectable in a case where RQ-PCR achieved less than MR4.5. This may be caused by tiny numbers of target molecules in the sample leading to variation during sampling for the reaction assay, especially in cases where BCR::ABL1 achieved less than MR4.5 and MR5 [Citation14]. Technically, the ddPCR method, combining multiple wells to increase partitioning may increase sensitivity and improve the measurement efficacy [Citation13,Citation18].
Our results indicated that ddPCR has the potential to overcome some limitations of RQ-PCR. One superior strength of ddPCR is quantification without using the standard curve, while the ready-to-use conversion factor from a commercial kit also allows the laboratory to eliminate complicated standardization processes. Moreover, this automated machine platform enables high-throughput measurement of large sample sizes, reducing laboratory turnaround time. Quantification by ddPCR is based on the number of positive and negative droplets in each sample. This determines the copy number of a target gene by fitting the fractions of positive droplets with the Poisson algorithm. Consequently, saturated samples, especially in the first diagnosis of a patient with high levels of BCR::ABL1 transcripts, are errors that can be encountered with the ddPCR platform, making the Poisson algorithm invalid. An important key to avoiding this problem is to prepare a saturated sample dilution before PCR [Citation23]. Nevertheless, prominent advantages of ddPCR include process simplification and uncomplicated interpretation, as seen from the scatter plot that can clearly distinguish groups of data. From this advantage, we discovered the difference between the amplitude of the e13a2 and e14a2 positive droplets in the 2D plot and could predict the transcript type from the amplified fluorescent intensity. This finding corresponds with a study by Kjaer et al. which also found differences in fluorescent intensity between e13a2 and e14a2 in the ddPCR analysis [Citation24]. However, they discovered that e14a2 had a lower fluorescent intensity than e13a2. Technical differences between the previous report and our current data may be due to many factors such as reagent kits, the reference gene, and the thermal cycler system generating different PCR profiles. Concerning fluorescent intensity, we found that the mean fluorescent amplitudes in e14a2 and e13a2 were 16,005 and 11,849, respectively. By contrast, Bernardi et al. reported no difference in fluorescence intensity in the analysis of e13a2 and e14a2 transcript types using dPCR [Citation25]. Nonetheless, both studies also confirmed that no difference in terms of quantification between the major transcript variants was found by ddCPR [Citation24,Citation25]. Our hands-on time of standard sample preparation and reaction handling during the ddPCR process both reduced, with ddPCR having lower cost than RQ-PCR. Future studies will focus on developing and using commercially available ddPCR assay platforms to assess another type of BCR::ABL1 transcripts, key ABL1 kinase domain mutations in CML and other clinically important genetic alterations in hematological malignancies.
Conclusion
Results showed that ddPCR mitigated some shortcomings of RQ-PCR, with benefits in evaluating the response of patients to TKI therapy. Effective monitoring of BCR::ABL1 increased the chances of adjusting the treatment and preventing disease progression and relapse. This powerful and valuable tool can greatly assist BCR::ABL1 transcript monitoring in TKI-treated CML patients.
Acknowledgement
The authors acknowledge assistance from the Human Genetic Laboratory, Department of Pathology, Faculty of Medicine Ramathibodi Hospital for clinical data interpretation and technical guidance.
Disclosure statement
No potential conflict of interest was reported by the author(s).
References
- Jabbour E, Kantarjian H. Chronic myeloid leukemia: 2018 update on diagnosis, therapy and monitoring. Am J Hematol. 2018;93:442–459. doi:10.1002/ajh.25011
- Laurent E, Talpaz M, Kantarjian H, et al. The BCR gene and Philadelphia chromosome-positive leukemogenesis. Cancer Res. 2001;61:2343–2355.
- Jabbour E, Kantarjian H. Chronic myeloid leukemia: 2020 update on diagnosis, therapy and monitoring. Am J Hematol. 2020;95:691–709. doi:10.1002/ajh.25792
- Hochhaus A, Larson RA, Guilhot F, et al. Long-Term outcomes of Imatinib treatment for chronic myeloid leukemia. N Engl J Med. 2017;376:917–927. doi:10.1056/NEJMoa1609324
- Gabert J, Beillard E, van der Velden VHJ, et al. Standardization and quality control studies of ‘real-time’ quantitative reverse transcriptase polymerase chain reaction of fusion gene transcripts for residual disease detection in leukemia – A Europe against cancer program. Leukemia. 2003;17:2318–2357. doi:10.1038/sj.leu.2403135
- Baccarani M, Saglio G, Goldman J, et al. Evolving concepts in the management of chronic myeloid leukemia: recommendations from an expert panel on behalf of the European LeukemiaNet. Blood. 2006;108:1809–1820. doi:10.1182/blood-2006-02-005686
- White HE, Salmon M, Albano F, et al. Standardization of molecular monitoring of CML: results and recommendations from the European treatment and outcome study. Leukemia. 2022;36:1834–1842. doi:10.1038/s41375-022-01607-z
- Cross NCP, Hochhaus A, Müller MC. Molecular monitoring of chronic myeloid leukemia: principles and interlaboratory standardization. Ann Hematol. 2015;94(Suppl 2):S219–S225. doi:10.1007/s00277-015-2315-1
- White HE, Matejtschuk P, Rigsby P, et al. Establishment of the first world health organization international genetic reference panel for quantitation of BCR-ABL mRNA. Blood. 2010;116:e111–e117. doi:10.1182/blood-2010-06-291641
- Cross NCP, White HE, Ernst T, et al. Development and evaluation of a secondary reference panel for BCR-ABL1 quantification on the international scale. Leukemia. 2016;30:1844–1852. doi:10.1038/leu.2016.90
- Alikian M, Whale AS, Akiki S, et al. RT-qPCR and RT-digital PCR: A comparison of different platforms for the evaluation of residual disease in chronic myeloid leukemia. Clin Chem. 2017;63(2):525–531. doi:10.1373/clinchem.2016.262824
- Maier J, Lange T, Cross M, et al. Optimized digital droplet PCR for BCR-ABL. J Mol Diagn. 2019;21:27–37. doi:10.1016/j.jmoldx.2018.08.012
- Jennings LJ, George D, Czech J, et al. Detection and quantification of BCR-ABL1 fusion transcripts by droplet digital PCR. J Mol Diagn. 2014;16:174–179. doi:10.1016/j.jmoldx.2013.10.007
- Spiess B, Rinaldetti S, Naumann N, et al. Diagnostic performance of the molecular BCR-ABL1 monitoring system may impact on inclusion of CML patients in stopping trials. PLoS One. 2019;14(3):e0214305. doi:10.1371/journal.pone.0214305
- Zanaglio C, Bernardi S, Gandolfi L, et al. RT-qPCR versus digital PCR: how do they impact differently on clinical management of chronic myeloid leukemia patients? Case Rep Oncol. 2020;13(3):1263–1269. doi:10.1159/000510440
- Radich J, Yeung C, Wu D. New approaches to molecular monitoring in CML (and other diseases). Blood. 2019;134:1578–1584. doi:10.1182/blood.2019000838
- Shelton DN, Bhagavatula P, Sepulveda N, et al. Performance characteristics of the first food and drug administration (FDA)-cleared digital droplet PCR (ddPCR) assay for BCR::ABL1 monitoring in chronic myelogenous leukemia. PLoS One. 2022;17(3):e0265278. doi:10.1371/journal.pone.0265278
- Franke GN, Maier J, Wildenberger K, et al. Comparison of real-time quantitative PCR and digital droplet PCR for BCR-ABL1 monitoring in patients with chronic myeloid leukemia. J Mol Diagn. 2020;22:81–89. doi:10.1016/j.jmoldx.2019.08.007
- Petiti J, Lo Iacono M, Dragani M, et al. Novel multiplex droplet digital PCR assays to monitor minimal residual disease in chronic myeloid leukemia patients showing atypical BCR-ABL1 transcripts. J Clin Med. 2020;9:1457. doi:10.3390/jcm9051457
- Kockerols CCB, Valk PJM, Levin MD, et al. Digital PCR for BCR-ABL1 quantification in CML: current applications in clinical practice. Hemasphere. 2020;4(6):e496. doi:10.1097/HS9.0000000000000496
- Soverini S, Bernardi S, Galimberti S. Molecular testing in CML between Old and New methods: Are We at a turning point? J Clin Med. 2020;9(12):3865. doi:10.3390/jcm9123865
- Bochicchio MT, Petiti J, Berchialla P, et al. Droplet digital PCR for BCR–ABL1 monitoring in diagnostic routine: ready to start? Cancers (Basel). 2021;13(21):5470. doi:10.3390/cancers13215470
- dMIQE Group, Huggett JF. The digital MIQE guidelines update: minimum information for publication of quantitative digital PCR experiments for 2020. Clin Chem. 2020;66(8):1012–1029. doi:10.1093/clinchem/hvaa125
- Kjaer L, Skov V, Andersen MT, et al. Variant-specific discrepancy when quantitating BCR-ABL1 e13a2 and e14a2 transcripts using the Europe against cancer qPCR assay. Eur J Haematol. 2019;103(1):26–34. doi:10.1111/ejh.13238
- Bernardi S, Bonifacio M, Iurlo A, et al. “Variant-specific discrepancy when quantitating BCR-ABL1 e13a2 and e14a2 transcripts using the Europe against cancer qPCR assay.” Is dPCR the key? Eur J Haematol. 2019;103(3):272–273. doi:10.1111/ejh.13282