
ABSTRACT
Introduction
The sigma metric offers a quantitative framework for evaluating process performance in clinical laboratories. This study aimed to evaluate the analytical performance of automated analysers in haematology laboratories, using the sigma metric to choose the best analyser as an internal reference analyser.
Materials and Methods
internal quality control (IQC) data were collected for 6 months from SNCS, and the sigma value was calculated for 9 haematology analysers in the laboratory.
Results
For the normal control level, a satisfactory mean sigma value ≥3 was observed for all of the studied parameters of all automated analysers. For the low control level, platelet (PLT) count by Instrument (Inst.) G performed poorly, with a mean sigma value <3. Inst. H, with all parameters’ sigma values >4, performed best and was chosen as the internal reference analyser.
Conclusion
The sigma metric can be used as a guide to choose the QC strategy and plan QC frequency. It can facilitate the comparison of the same assay performed by multiple systems.
Introduction
Quality control is the foundation of monitoring and detecting errors during analysis, ensuring the generation of reliable test results that correctly represent the clinical status of the patients with a satisfactory degree of precision and accuracy [Citation1,Citation2]. ISO15189 dictates that the laboratory should ensure the quality of the analytes while also keeping their agreement that they be obtained from different analysers in one laboratory when they can [Citation3]. In this study, our haematology laboratory participated in the external quality assessment (EQA) activity of the National Center for Clinical Laboratory (NCCL) of China twice a year as an external quality assessment (EQA) to ensure accuracy, while running quality control samples each day for IQC to ensure precision. The haematology laboratory has 9 of the same automated analysers (Inst. A to Inst. I). We wanted to set one of them as the internal reference analyser to participate in the EQA. Then, the other 8 analysers would be calibrated to agree with the internal reference analyser. Therefore, the best analyser was chosen as the internal reference analyser. Anyone of them could be chosen as an internal reference analyser while they were new. With everyday use, their performance has changed. To judge which one is the best, we decided to use the sigma metric, which was a revolutionary measure in the quality management system (QMS) developed in the mid-1980s by Motorola, Inc. for eradicating defects in manufacturing [Citation4,Citation5].
The sigma metric is measured on a scale of 0–6, with 6 being world-class and 3 being the minimum level of acceptable performance [Citation6]. This study aimed to evaluate the analytical performance of automated analysers in the haematology unit by using the sigma-metric approach and use this metric to choose an internal reference analyser. Appropriate IQC procedures were selected for each analyte on the 9 automated analysers using the sigma metric. Quality goal index (QGI) analyses were further performed to identify problems related to the measurement procedures for analytes with a sigma value below 4.
Materials and methods
Materials
The instruments were all of the SYSMEX XN 1000 model (Inst. A-I) manufactured by the Japanese company SYSMEX [Citation7].
The SYSMEX series uses the impedance direct current (DC) detection method for red blood cell (RBC) count and PLT count, while for haematocrit (HCT) % cumulative, the RBC height detection method is used [Citation7,Citation8].
The frequency of IQC was once per day. Two levels for the complete blood count (CBC) for the SYSMEX series were provided by (XN CHECK®): low (level 1; lot 1: 20751101; lot 2: 21311101; lot 3: 21871101), normal (level 2; lot 1: 20751102; lot 2: 21311102; lot 3: 21871102).
TEa
The total allowable error (TEa) includes random error and systematic error. The recommended allowable error values for analytes according to the requirements of the Health Industry Standards of the People’s Republic of China (WS/T 406-2012) are presented in .
Table 1. Sigma metric for the different instruments in this study at two levels of quality control.
Precision
The coefficient of variation (CV) was used as an imprecise representation of precision. The IQC data were collected prospectively by the Sysmex Network Communication System (SNCS), an online QC system connecting the laboratory and Sysmex by a dedicated network that provides services such as ‘online QC’ to support laboratory technicians, [Citation9] from January to September 2022, including 3 different batches (lot 1 to lot 3) ().
The coefficient of variation (CV)[Citation10] was calculated by the following formula: CV(%) = [Standard Deviation (SD) ∕Mean] × 100. The average CV was defined for each automated analyser (CVaverage), which was calculated by the following equation: CVaverage(%) = [ (CVlot12+ CVlot22+ CVlot32)/3]1/2.
Bias
SNCS provides a monthly program, the External Quality Assessment Scheme (EQAS), from which bias was calculated by the following equation:
Bias = (Our EQAS result−per group mean using the same instrument and method)/(per group mean using the same instrument and method). The average bias was defined for each automated analyser (Biasaverage), which was calculated by the following equation: Biasaverage = (︱Biaslot1︱+︱Biaslot2︱+︱Biaslot3︱)/3.
Sigma metric calculation
The sigma metric was calculated by the following formula: Sigma = (TEa−︱Bias︱) ∕CV [Citation10]. Two sets of sigma metrics were calculated, one for each of two control concentrations.
Quality goal index (QGI) ratio
The QGI ratio is a new tool highlighting the reason behind low sigma values <4. A score of <0.8 indicates imprecision, > 1.2 indicates inaccuracy, and (0.8–1.2) indicates both imprecision and inaccuracy. QGI was calculated by the following formula: QGI = Bias∕ (1.5×CV%) [Citation11].
This index can help determine the main reason why the testing performance of an analyte has a lower sigma level and might aid in the selection of the best quality improvement plan [Citation12–14]. A sigma value less than 4 (σ < 4) was used as the benchmark for the QGI analysis of analytes in this study. A QGI value less than 0.8 (QGI < 0.8) indicates that the precision of the corresponding analyte needs to be improved, whereas a value greater than 1.2 (QGI > 1.2) indicates that the trueness of the analyte needs to be improved. A QGI value between 0.8 and 1.2 (0.8 ≤ QGI ≤ 1.2) indicates that the accuracy and precision of the analyte both need to be improved.
Results
Use of the sigma metric for the evaluation of analyte performance
The analytical performance of analytes on the 9 automated analysers is detailed in . For the normal control level, a satisfactory mean sigma value >3 was observed for all of the studied parameters by all automated analysers. RBC count in Inst. A and Inst. D; Hb in all instruments except Inst. F; HCT in Inst. C, Inst. D, and Inst. F; PLT count in Inst. H; and WBC count in all instruments had the maximum mean sigma value of ≥6. Regarding the low control level, the RBC count in Inst. D, and the WBC count in Inst. B, Inst. D, and Inst. F had the highest mean sigma value of ≥6, while the PLT count in Inst. G performed poorly, with a mean sigma value <3.
Inst. H, with all parameters’ sigma values >4, performed best and was chosen as the internal reference analyser.
Quality control method design for continuous quality improvement
In this study, the IQC plans were designed according to the Westgard sigma rules with batch size for two QC levels () using the sigma metric. summarizes the sigma metric analysed in terms of TEa, CV%, and Bias%. For example, for the sigma values for the WBC assay on Inst. B of 6.55 and 9.17 for levels 1 and 2 of the QC materials, respectively, with the single rule of 13s (N = 2, R = 1) with a batch size of 1000 patient samples, was selected. However, the sigma values of the PLT count on Inst. A were 3.19 (level 1) for the QC materials, and the IQC scheme based on the low sigma value (level 1) was used to improve the efficiency of out-of-control detection. Thus, multiple rules of 13s/22s/R4s/41s/6x (N = 6, R = 1) with a batch size of 45 patient samples were recommended ().
Figure 1. Westgard sigma rules with recommended batch sizes and levels of QC (cited from website http://www.clinet.com.cn/sigmapv/#sgm4). Sigma metric = (TEa − |bias|)/CV. The sigma scale is located at the bottom of the diagram. Initially, the sigma metric is defined, and the corresponding sigma scale value is used to identify the control rules, total number of quality control materials (N) and frequency of statistical quality control events (run size). For example, the analytical performance of an analyte of more than 6 sigma corresponds to the single rule of 13s (N = 2, R = 1), with two different quality control materials with a batch size of 1000 patient samples, which is recommended as the IQC program. However, if the analytical performance of An analyte is between 3 and 4 sigma, multiple rules of 13s/22s/R4s/41s (N = 6, R = 1) with six different quality control materials with a batch size of 45 patient samples are recommended as the IQC program. ‘Yes’ means that the rule is violated, necessitating rejection of the results and corrective action; ‘No’ means that the rule is not violated, so accept and report the results.
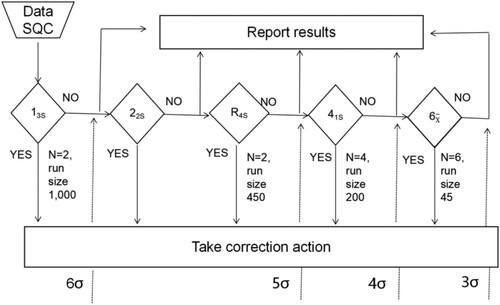
Table 2. QC procedures selected for 5 analytes in different instruments
In addition, if the analytical performance of an analyte was below four sigma, its QGI needed to be calculated for the implementation of quality improvement measures. For example, the calculated estimates of QGI for the RBC count of Inst. B were 0.65 (level 1) and 0.68 (level 2), indicating that imprecision was the main factor hindering its analytical performance. The detailed improvement measures for the analytes in various laboratories are listed in .
Table 3. The QGI and quality improvement measures for 5 analytes with sigma <4.
Discussion
This was the first study that used a six sigma model to evaluate the analytical performance of five analytes in 9 analysers of the same laboratory. Additionally, this is the first study to use quality data collected by an online QC system, while most studies have used EQA [Citation15–18].
Haematology analysers are highly complex automated analysers that use different principles to measure the same parameters [Citation19]. The results obtained from haematology analysers are the cornerstone of numerous medical interventions, as CBC is one of the most frequently requested laboratory tests [Citation20]. The results of our study demonstrated that different levels of QC materials often lead to different sigma values for the same analytes. A study by Zhou et al [Citation1]. demonstrated that different concentrations of the same analyte will yield significantly different sigma values. The data of these studies are consistent with our results and indicate that the concentration of an analyte should be considered when sigma metric are used to evaluate the analytical performance of an assay. Particular attention should be paid to the medical decision levels of the analytes to ensure that the results being returned are reliable.
Despite being acceptable conventional QC tools (EQA and IQC), they cannot be used for assessing the exact number of defects [Citation17]. In this context, this study was conducted to provide insight into our performance and to identify the gaps and need for modification in the strategy of laboratory QC procedures by using the sigma metric as a standard of excellence. Fuadi et al [Citation21]. reported a sigma value for PLT count (L1) as measured in the Abbott Cell Dyne Ruby haematology analyser. Shaikh and Moiz [Citation22] also reported a sigma value of <3 for PLT count (L1) using the SYSMEX XE-5000 haematology analyser. Here, a sigma value of <3 was found for the PLT count in (L1) on one haematology analyser. Although the sigma value is essentially dependent on the TEa value, there is no standardized TEa performance specification for laboratory tests around the world [Citation23,Citation24]. The TEa source selection will significantly affect the sigma value in a way that may obscure the analytical performance [Citation25].
Another limitation in the sigma metric system was discussed by Verma et al [Citation13]. and Nithya et al [Citation25].; despite the acceptable values of CV% and bias% for several analytes, the sigma value was <3. They suggested that CV% and bias % might be more reliable than the sigma metric if the calculated total error (TEa) of an analyte is within allowable error limits specific for that analyte [Citation13]. The same was observed in our study: in spite of acceptable values of CV%, bias %, the calculated total error (TEa) for PLT count (level 1) had a sigma value <3 on Inst. G.
Furthermore, we found that different copies of the same haematology automated analyser in the same environment, using the same reagent, operated by the same persons, had very different performance. The best performance should be chosen as the internal reference analyser, with which agreement can be reached every 6 months or whenever needed. Inst. H, on which all analytes had sigma >4, performed best and was chosen as the internal reference analyser.
Conclusion
The sigma metric can be used as a guide to make a QC strategy and plan the QC frequency, and it can facilitate the comparison of the same assay performed by multiple systems.
Financial support
Weifang Commission of Health (wfwsjk_2019_069).
Disclosure statement
No potential conflict of interest was reported by the author(s).
Additional information
Funding
References
- Zhou B, Wu Y, He H, et al. Practical application of six sigma management in analytical biochemistry processes in clinical settings. J Clin Lab Anal. 2020 Jan;34(1):e23126. doi:10.1002/jcla.23126
- Hollestelle MJ, Ruinemans-Koerts J, Idema RN, et al. Determination of sigma score based on biological variation for haemostasis assays: fit-for-purpose for daily practice? Clin Chem Lab Med. 2019 Jul 26;57(8):1235–1241. doi:10.1515/cclm-2018-0934
- ISO. Medical laboratories – Particular requirements for quality and competence ISO 15189. Geneva: ISO; 2012.
- Coskun A, Unsal I, Serteser M ,Inal T. Six sigma as a quality management tool: evaluation of performance in laboratory medicine.In.Quality management and six sigma: Sciyo; 2010.
- Sawalakhe PV, Lakhe RR, Deshmukh SV. Evaluating performance of testing laboratory using six sigma. Int J Innov Sci Eng Technol. 2016;10(2):77.
- El Sharkawy R, Westgard S, Awad AM, et al. Comparison between sigma metrics in four accredited Egyptian medical laboratories in some biochemical tests: an initiative towards sigma calculation harmonization. Biochem Med (Zagreb). 2018 Jun 15;28(2):020711. doi:10.11613/BM.2018.020711
- Keohane E, Smith L, Walenga J. Rodak’s hematology. London: Saunders; 2016.
- Wang J, Zhao S, Su Z, et al. Analytical comparison between two hematological analyzer systems: mindray BC-5180 vs sysmex XN-1000. J Clin Lab Anal. 2019 Oct;33(8):e22955. doi:10.1002/jcla.22955
- Hiroyuki M, Atsushi S Katsuya W, et al. Introduction of the XE-2100 online QC system. Sysmex Journal International. 2000;10:13–19.
- Nabity MB, Harr KE, Camus MS, et al. ASVCP guidelines: allowable total error hematology. Vet Clin Pathol. 2018 Mar;47(1):9–21. doi:10.1111/vcp.12583
- Qiu HW, Ruan LM, Zhao YG. Normalized MEDx chart coupled with quality goal index for evaluation of analytical quality achievements and quality shortcomings. A novel perspective to its further application. Clin Chim Acta. 2015 Apr15;444:278–279. doi:10.1016/j.cca.2015.02.041
- Kumar BV, Mohan T. Sigma metrics as a tool for evaluating the performance of internal quality control in a clinical chemistry laboratory. J Lab Physicians. 2018 Apr-Jun;10(2):194–199. doi:10.4103/JLP.JLP_102_17
- Verma M, Dahiya K, Ghalaut VS, et al. Assessment of quality control system by sigma metrics and quality goal index ratio: a roadmap towards preparation for NABL. World J Methodol. 2018 Nov 29;8(3):44–50. doi:10.5662/wjm.v8.i3.44
- Zhao HJ, Zhang TJ, Zeng J, et al. Investigation and analysis of hemoglobin A1c measurement systems’ performance for 135 laboratories in China. Chin Med J (Engl). 2017 May 5;130(9):1079–1084. doi:10.4103/0366-6999.204932
- Liu Q, Chen X, Han J, Chen Y, Wang M, Zhao J, Liang W, Yang F. Application of a six sigma model to the evaluation of the analytical performance of serum enzyme assays and the design of a quality control strategy for these assays: a multicentre study. Clin Biochem. 2021 May;91:52–58. doi:10.1016/j.clinbiochem.2021.02.004
- Ahmed El-Neanaey W, Mahmoud AbdEllatif N, Abdel Haleem Abo Elwafa R. Evaluation of sigma metric approach for monitoring the performance of automated analyzers in hematology unit of alexandria main university hospital. Int J Lab Hematol. 2021 Dec;43(6):1388–1393. doi:10.1111/ijlh.13660
- Liu Q, Zhu W, Bian G, et al. Application of the sigma metrics to evaluate the analytical performance of cystatin C and design a quality control strategy. Ann Clin Biochem. 2021 May;58(3):203–210. doi:10.1177/0004563220988032
- Peng S, Zhang J, Zhou W, et al. Practical application of Westgard sigma rules with run size in analytical biochemistry processes in clinical settings. J Clin Lab Anal. 2021 Mar;35(3):e23665. doi:10.1002/jcla.23665
- Ciepiela O, Kotuła I, Kierat S, et al. A comparison of mindray BC-6800, sysmex XN-2000, and beckman coulter LH750 automated hematology analyzers: a pediatric study. J Clin Lab Anal. 2016 Nov;30(6):1128–1134. doi:10.1002/jcla.21992
- Vis JY, Huisman A. Verification and quality control of routine hematology analyzers. Int J Lab Hematol. 2016 May;38(Suppl 1):100–109. doi:10.1111/ijlh.12503
- Fuadi R. Using six sigma to evaluate analytical performance of hematology analyzer. Indonesian J Clin Pathol Med Lab. 2019;25(2):165. doi:10.24293/ijcpml.v25i2.1375
- Shaikh MS, Moiz B. Analytical performance evaluation of a high volume hematology laboratory utilizing sigma metrics as standard of excellence. Int J Lab Hematol. 2016;38(2):193–197. doi:10.1111/ijlh.12468
- Rentapalli BR, Ganji SB, DS Md. Internal reference score of riqas and sigma metrics for evaluating the analytical performance of thyroid function testing on advi-a centaur XPT immunoassay analyser. J Evolut Med Dent Sci. 2019;8(7):447–450. doi:10.14260/jemds/2019/98
- Westgard S, Bayat H, Westgard JO. Analytical sigma metrics: a review of six sigma implementation tools for medical laboratories. Biochem Med (Zagreb). 2018;28(2):020502. doi:10.11613/BM.2018.020101
- Nithya K, Meera S. Sigma metrics-a guide to quality control strategy in clinical biochemistry laboratory. Int J Clin Biochem Res. 2020;7(2):267–271. doi:10.18231/j.ijcbr.2020.058