
ABSTRACT
Objectives
The clinical outcomes of multiple myeloma (MM) patients are highly variable in the real-world setting. Some MM patients may have clinical endings that do not abide by the book. We aim to describe features of MM patients with extreme survivals in real-world practice.
Methods
This retrospective study enrolled 941 patients consecutively visited a national medical center, China, between July 1995 and December 2021. Among patients, we identified two groups of MM patients with extreme survivals, 56 were in the long-term remission (LR) group with progression-free survival (PFS) ≥ 60 months, and 82 were in the rapid progression (RP) group with PFS ≤ 6 months.
Results
CRAB features, of which hypercalcemia, renal insufficiency, and anemia were more common in the RP group, except for bone disease, with a comparable incidence at diagnosis in both groups (88.8 vs 85.7%, P = 0.52). High-risk cytogenetics was detected in 45.7% of patients in the RP group. Of note, 14.3% of MM patients in the LR group harbored del (17p). According to the Revised International Staging System (R-ISS), 9% of patients belonged to stage I in the RP group, and 19% of patients in the LR group were found in stage III. There were 8 (15.7%) patients in the LR group only achieved partial response (PR) as the best response. Median time to best response (TBR) for LR and RP group patients was 4.6 and 1.4 months, respectively.
Conclusions
The disparities in the survivals of MM patients indicated that some unexpected factors have influenced the outcomes in the real-world setting.
Introduction
Multiple myeloma (MM) is a hematological malignancy of plasma cells, which is featured by abnormal clonal proliferation of plasma cells in the bone marrow. The clinical manifestations of MM include hypercalcemia, renal impairment, anemia, and bone destruction [Citation1]. As estimated, 16500 new MM cases and about 10300 disease-related deaths occurred in China in 2016 [Citation2]. The prognosis of MM patients has witnessed significant advancements, primarily due to the introduction of novel therapeutic agents, such as proteasome inhibitors (PIs), immunomodulatory drugs (IMiDs), monoclonal antibodies, along with the extensive utilization of autologous stem cell transplantation (ASCT) over the past decades [Citation3–5]. However, the majority of MM patients would relapse and become drug-resistant, eventually become untreatable and die [Citation6,Citation7].
MM is a disease of notable heterogeneity, manifesting in both clinical and pathological aspects of the disease [Citation8,Citation9]. The heterogeneity is further amplified in the survival outcomes of MM patients. The survival of MM patients varies even when uniformly treated in random clinical trials [Citation10–13]. Survival disparities are more distinct in real-world practice. A real-world study of data from the Swedish Myeloma Registry found that 19% of MM patients died within 1 year from diagnosis, and 5-year overall survival (OS) in MM patients was 38.3% [Citation14]. A single center in Greece reported that 9% of MM patients had progression-free survival (PFS) longer than 7 years. There were also a bunch of exceptional responders to ASCT who had a median PFS of 13.8 years without maintenance therapy [Citation15]. At the same time, a subset of MM patients, which account for 15–20%, have a predicted OS of less than 3 years [Citation16]. Some patients may have more dismal outcomes with early death in 2 years [Citation17]. These data further illustrate the substantial variability in survival outcomes among MM patients in the real-world setting.
What factors contribute to the notable disparities observed in the survival rates of MM patients, particularly when taking into account the presence of comprehensive clinical guidelines that serve as a valuable reference for making treatment decisions. Numerous unanswered questions persist within the realm of real-world clinical practice, necessitating further elucidation. In this study, we sought to comprehensively review information of MM patients derived from a prominent National Medical Center in China. Subsequently, we categorized the patients into two distinct groups characterized by extreme survival outcomes. Our investigation primarily focused on delineating the characteristics of these two MM patient cohorts, with a particular emphasis on highlighting unexpected findings that diverged from prevailing expectations.
Patients and methods
Patients
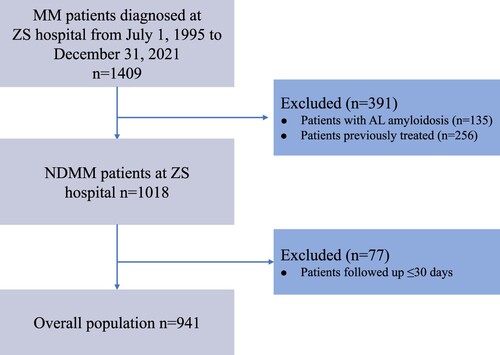
This retrospective study reviewed demographic, clinical and laboratory data of patients with MM seen in Zhongshan Hospital, Fudan University, from July 1995 to December 2021. The definition of MM using the International Myeloma Working Group (IMWG) criteria [Citation18]. Among these 1409 MM patients, 391 were excluded due to the comorbidity of amyloidosis (AL) or pre-treated. There were 77 patients excluded for follow-up time less than 30 days. Eventually, the data of 941 newly diagnosed multiple myeloma (NDMM) patients met the eligibility criteria for inclusion in this study (). The study was approved by the Institutional Review Board of the Zhongshan Hospital, Fudan University.
Figure 1. Flowchart of the study.
Variables
Baseline characteristics of MM patients before the initiation of treatment were collected, including sex, age, M-protein subtype, creatinine (Cr), lactate dehydrogenase (LDH), albumin (ALB), β2-microglobulin (β2-MG), Hemoglobin (Hb), calcium (Ca), Bone lesion, Extramedullary disease (EMD), Eastern Cooperative Oncology Group Performance Status (ECOG PS), and International Staging System (ISS). Cytogenetic abnormalities were determined by fluorescent in situ hybridization (FISH) of the bone marrow of the presence of t(4;14), t(14;16), t(11;14), del(13q), del(17p) and 1q gain/amplification. MM patients with t(4;14), and/or t(14;16), and/or del(17) were considered at high risk. The delineations for double-hit and triple-hit myeloma adhered to the criteria established by the Mayo Clinic's mSMART3 classification system. The response to therapy and progression was determined based on the criteria defined by the IMWG [Citation19]. Frontline therapy was classified by the main drug and into four categories: (1) PI only, (2) IMiDs only, (3) PI/IMiDs combination, and (4) Other. The stringent complete response (sCR) category was integrated into the complete response (CR) part. PFS and OS were used to describe the survival outcomes of MM patients. PFS was measured from the time of diagnosis until disease progression or death from any cause. OS was defined from the date of diagnosis to the date of death or last follow-up. We identified a subset of MM patients into two categories, MM patients in the rapid progression (RP) group have PFS ≤ 6 months, the other is the long-term remission (LR) group incorporating MM patients with PFS ≥ 60 months.
Statistical analysis
The statistical analyses were performed using SPSS 25.0 (IBM Inc., San Francisco, CA, USA). We compared variables between two groups using appropriate statistical tests (chi-square test or Fisher’s exact test for categorical variables; t-test or the Mann–Whitney U-test for continuous variables). Survival plots of PFS and OS were estimated by the Kaplan–Meier method and compared by log-rank tests. All P-values were two-sided and less than 0.05 were considered to be statistically significant.
Results
The baseline characteristics of MM patients
A total of 941 NDMM patients were included in the analysis. The median follow-up time was 35.0 months (range, 1.0–170.5 months). 341 progression events and 261 deaths were recorded. The median PFS and OS were 33.9, 70.7 months respectively (Figure S1). The clinical data and biological characteristics of 941 NDMM patients are shown in . The median age was 64 years (range, 31–89) and 63.1% of patients were male. The M-protein subtypes found were mostly IgG in 486 (51.6%), IgA in 248 (26.4%) and light chain in 128 (13.6%). Of all the patients, 170 (18.2%) patients had renal insufficiency, 15.5% with increased LDH levels, 501 patients (53.4%) had anemia, and 79 patients (8.5%) had hypercalcemia. Among all patients, 83.9% presented with bone lesions and 8.1% had an ECOG PS of >2. A total of 42.6% of patients presented with ISS stage III, 137 patients in the Revised International Staging System (R-ISS) stage III. Among all patients, 489 (52%) received a PI-based regimen and 276 (29.3%) took PI/IMiDs combination therapy as the frontline treatment. The use of ASCT was in 133 patients (14.1%).
Table 1. Baseline characteristics of 941 NDMM patients.
Characteristics of patients with extreme survivals
According to the criteria mentioned above, 56 patients were assigned to the LR group and 82 patients in the RP group. Baseline demographic and laboratory values, separated by survival groups, are presented in . The median age in the RP group was higher than MM patients in the LR group (63 vs. 57.5, P < 0.01). There were more male patients in the RP group (64.6 vs. 46.4%, P < 0.05). Patients in the RP group had a higher percentage of renal insufficiency 34.2 vs. 17.9% (P < 0.05). Consistent differences were shown in anemia and hypercalcemia 68.3 vs. 48.2% and 23.5 vs. 7.4%, respectively (P < 0.05, P < 0.01). The discrepancy in patients with EMD between the two groups also reached statistical significance with 37.8% of patients in the RP group compared to 22.7% of patients in the LR group (P < 0.001). The occurrence of bone lesions at diagnosis was similar between the two groups (88.8 vs 85.7%, P = 0.52). There was a phenomenon showing more poor performance status patients in the RP group compared to the LR group with ECOG PS > 2 (13.4 vs 1.8%, P < 0.05).
Table 2. Demographics and clinical data of NDMM patients in two groups.
The cytogenetic abnormality between groups
Cytogenetic abnormalities of the study group assessed by FISH are outlined in . Among patients who tested for listed items were available, they were detected at a similar frequency in the del(17p) (22.4 vs 14.3%, P = 0.37) and del(13q) (59.6 vs. 48.1%, P = 0.37). However, patients in the RP group were less likely to harbor t(11;14) compared with those in the LR group (17.8 vs. 20%, P < 0.001). In the RP group, 21/46(45.7%) patients had high-risk cytogenetics.
Table 3. FISH results of cytogenetics.
Risk stratification based on the ISS
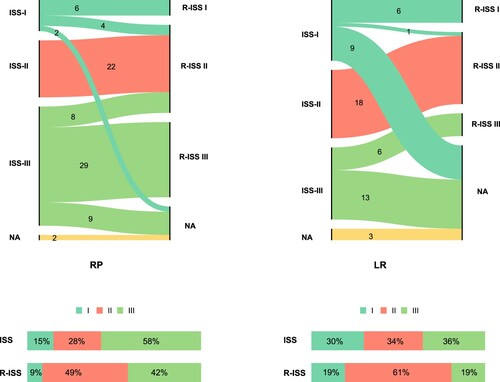
Two versions of ISS were adopted to predict prognosis in MM patients. These details are all illustrated in . In the RP group, among patients who were evaluated for ISS(80/82), based on the definition, 12 (15%), 22 (28%), and 46 (58%) patients had stage I, II, and III disease, respectively. Regarding the R-ISS stage which was available for 69 patients, 42% of patients were stratified as poor prognosis patients (R-ISS > II; n = 29). We can tell that 6 patients stayed in stage I all along between different revisions of ISS. In another way, 29 patients were distributed in an advanced stage of the disease (ISS/R-ISS = III) all the time. Next, we focus on patients in the LR group. Surprisingly, relatively most patients were found in ISS stage III (19/53, 36%), and 19% of patients were stratified in R-ISS III. It was noteworthy that 6 patients were always in stage III between different risk-scoring systems (ISS/R-ISS III = 6).
Figure 2. The migration and distribution of MM patients between ISS and R-ISS in the RP (A) and LR (B) groups. ISS, International Staging System and R-ISS, Revised International Staging System.
Treatment variability in selected patients
depicts the choice of therapy and responses induced in MM patients. The use of novel agents was similar between the two groups (89 vs. 83.9%, P = 0.39). The use of triplet drug combinations that act as first-line therapy was at a similar frequency in the RP (69.5%) and the LR group (69.6%) (P = 0.63). The most frequent first-line regimen administered was PI-based therapy in two groups, 61% in the RP, and 39.3% in the LR group. Patients in the LR group were more likely to receive therapy with PI and IMiD combinations than those in the RP group (33.9 vs 17.1%, P = 0.06). A significantly higher proportion of patients in the LR group versus the RP group were on maintenance therapy (69.6 vs. 7.3%, P < 0.001). The best response to first-line therapy was available for 63 patients in the RP group, and 51 patients in the LR group. Overall response rates (ORR) for patients in the LR group (100%) were superior to those in the RP group patients (58.7%), (P < 0.001). Deep responses were also different, with CR rates of 6.3% versus 68.6%, and very good partial response (VGPR) rates of 11.1% versus 15.7%, in the RP versus LR groups, respectively. This translated into a significantly different rate of ≥ VGPR in the two groups (17.5 vs. 84.3%, P < 0.001). The median time to best response (TBR) was 1.4 months (range 0.7–4.5) in the RP group, while the counterpart in the LR group was 4.6 months (range 1.1–22) (P < 0.001). Duration of best response (DBR) also differed significantly between the two groups (2.3 vs. 64.4 months, P < 0.001). We also depicted the specific TBR and DBR among different responses in 2 groups (). There was a trend showing that patients in the LR group needed more time to reach the best response in all different response depths compared to the RP group (CR, 4 vs. 3 months, P = 0.17; VGPR, 6 vs. 1 month, P = 0 < 0.01; PR, 5 vs. 1 month, P < 0.001). An overwhelmingly extended DBR in the LR group than in the RP group shown was in CR, 64 vs. 1 month; VGPR, 63 vs. 4 months; PR, 83 vs. 2 months, P < 0.001. MM patients in the RP group needed similar time to reach the best response (TBR, 3 vs. 1 vs. 1 month, P = 0.225), survival plots showed that CR patients had inferior OS than patients who got PR or VGPR (P = 0.0013, Figure S2).
Figure 3. The median TBR, DBR, and OS in the two groups classified by responses. Patients in two groups classified by depth of response, and then the median TBR, DBR, an OS was depicted of patients in each response group.
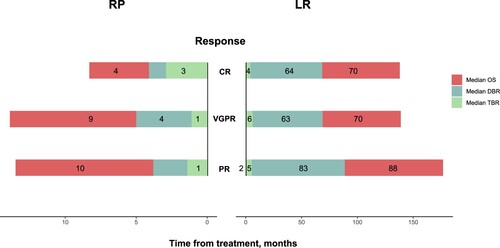
Table 4. Treatment variability of patients in two groups.
Discussion
Our study conducted a retrospective analysis of real-world treatment patterns and outcomes in newly diagnosed MM patients in China. Two distinct groups of MM patients with extreme survivals were comprehensively depicted in clinical characteristics, treatment profiles and outcomes. Notably, this study is the first to specifically investigate MM patients with survival rates that deviate from the median range. As a result, several unexpected observations, which were inconsistent with established guidelines, were discovered. These findings further emphasize the necessity to modify the current management approach for MM and advocate for the implementation of more precise individual treatment paradigms in clinical practice.
This study retrospectively reviewed NDMM patients in a single center across nearly three decades. Then we identified two unique groups of patients. One was named the LR group which had PFS ≥ 60 months including 56 patients, another RP group incorporated 82 patients with PFS ≤ 6 months. The PFS of NDMM patients has prolonged quite a lot over the past years. In patients treated with lenalidomide, bortezomib, and dexamethasone (RVD) induction therapy, a long-term follow-up study showed that the median PFS was 65 months [Citation11]. A meta-analysis showed that NDMM patients received ASCT followed by lenalidomide maintenance with a median PFS of 52.8 months [Citation20]. This excellent PFS was derived from standard clinical interventions and selected populations, so it cannot represent the actual status in real-world settings. Population-based HAematological Registry for Observational Studies (PHAROS), a real-world data research, indicated that NDMM patients had a median PFS of 18 months [Citation21]. In Czech, 16.3 months of median PFS was shown in the analysis of data from the Registry of Monoclonal Gammopathies (RMG) [Citation22]. Analyses of real-world patients in multicenter China demonstrated a median PFS of 26 months [Citation23]. Another study focused on MM patients who were not eligible for transplantation found that median PFS was 15.3 months [Citation24]. As in our cohort, with the diversity of patients and multiple treatment patterns, the median PFS was 33.9 months, so PFS ≥ 60 months seems to be the rationale for identifying some long-term remission patients. As for patients in the RP group, in which PFS ≤ 6 months, 55 deaths and 27 progression events were recorded. The majority of patients in this group underwent early death [Citation25,Citation26]. Across studies, the incidences of MM patients who died within 6 months range from 13 to 22% [Citation25,Citation27,Citation28]. In our cohort, early death was noted in 6.1%. The rest patients in this group had a DBR of less than 6 months, transient remission to first-line therapy predicted inferior survival of MM patients [Citation29,Citation30]. Therefore, these two groups of patients represent special samples in real-world practice.
The presentation and distribution of several demographic and clinical features between the two groups were far more different, which is consistent with current knowledge of MM (). Such high-risk factors including elderly patients, anemia, hypercalcemia, and renal insufficiency were more common in the RP part. However, we found some similar patients had bone lesions at diagnosis in two special groups (88.8 vs. 85.7%, P = 0.52). Nearly 70% to 80% of NDMM patients have bone lesions at the time of diagnosis [Citation31,Citation32]. Patients with bone lesions may be diagnosed as MM earlier than other subtypes and get early intervention, thus obtaining a positive effect on their outcomes [Citation33]. In our cohort, the presence of bone lesions at baseline could not predict the outcomes of MM patients. However, multiple studies indicated more than 3 focal lesions identified by 18F-fluorodeoxyglucose (18F-FDG) PET/CT have an adverse impact on the prognosis of MM patients [Citation34,Citation35]. A risk-stratification model incorporating the number of focal lesions was developed to predict the survival of NDMM patients, which exhibited nice performance [Citation36]. At present time, we should evaluate the degree of bone lesions in patients using a variety of equipment at diagnosis, this might offer more information for deciding on clinical practice.
Compared to the RP group, we found more patients harbor t(11;14) in the LR group (17.8 vs. 20%, P < 0.001). t(11;14) has an estimated prevalence of 15% to 24% in NDMM patients [Citation37–39]. MM patients carrying t(11;14) are considered at standard risk in the current international guidelines [Citation40,Citation41]. Nevertheless, with the evolving treatment paradigm, especially adding novel agents, more studies reclassify patients with t(11;14) into intermediate risk [Citation42–45]. The treatment regimens of 2 patients in the LR group with t(11,14) included PIs or IMiDs, so the impact of t(11,14) on the prognosis of MM patients in the era of novel agents still needs to be clarified. Risk reclassification also occurred in del(13q) when novel agents were given, which had comparable distribution between the two groups, those patients were considered as intermediate risk during old times [Citation46,Citation47]. However, this improvement does not apply to MM patients with del(17p) [Citation46]. As a well-known high-risk factor in the present time, MM patients with del(17p) had a median OS of 3 years [Citation41]. High-risk cytogenetics confer poor survival outcomes in MM patients [Citation48]. We noticed 14.3% patients detected of del(17p) in the LR group; meanwhile, less than half of patients in the RP group had high-risk cytogenetics abnormalities. New therapy might alter the roles of each of the cytogenetics abnormalities, further indicating the limitations of current molecular cytogenetic classification. The definition of high-risk MM patients should be determined on the specific subclones harboring molecular abnormalities instead of imperious risk-stratification groups.
ISS is most widely used in the clinical to stratify MM patients for guiding treatment decision-making [Citation49]. A revision of ISS combined disease biology (cytogenetic abnormalities and elevated lactate dehydrogenase) was introduced in 2015 [Citation50]. Regardless of versions of ISS, 6 patients in the RP group were assigned to the standard risk part. On the other hand, 6 patients were classified as high risk consistently in the LR group, which accounted for 11%. These patients behaved out of predictions. It reminds us that besides counting on the baseline risk stratification, it is urgent to establish dynamic prognostic evaluation according to responses to therapy or the course of disease.
8(15.7%) patients in the LR group achieved PR with frontline therapy. This indicates that the residual diseases were might less malignant or the changed tumor microenvironment hinders the proliferation of myeloma cells [Citation51]. TBR was slower in LR group patients. With the same depth of response, patients in the LR group needed more time to reach the best response. TBR might play a more critical role in predicting the survival outcomes in MM patients than the depth of response. A study showed that TBR with first-line therapy had a significant impact on survival [Citation51]. We also found patients in the RP group, with PFS ≤ 6 months, patients who got PR had better OS than those with CR. This phenomenon further underscores the limited impact of the depth of remission on the prognosis of MM patients.
This is a retrospective study based on data from a National Medical Center in China. Our study has certain limitations, including some missed data such as LDH, due to the extensive data collection period. Additionally, we did not consider ASCT. The utilization of ASCT significantly impacts patients’ outcomes. However, due to the low percentage of ASCT utilization in our cohort and the highly uneven distribution between the two groups, we were unable to assess the role of ASCT on clinical outcomes in both groups. Lastly, as a university-affiliated hospital, the survival outcomes of patients visiting our institute may not fully reflect the survival rates of MM patients in China, and there may be a presence of selection bias. Nevertheless, our study provides valuable insights into the real-world extreme survival of MM patients, serving as a reflection of their condition.
We identified two distinct groups of NDMM patients who experienced extreme survival outcomes in real-world settings. The presence of bone lesions did not have a significant impact on the survival of MM patients. Surprisingly, MM patients initially classified as high-risk or low-risk displayed unexpected clinical outcomes. Those who achieved only a partial response (PR) exhibited prolonged disease control and extended overall survival (OS). Our findings provide unique insights into the management of MM patients in real-world scenarios, challenging conventional expectations. These findings are worthy of careful consideration and could potentially contribute to novel approaches in MM patient care.
Data availability statemant
Data supporting the findings of this study are available from the corresponding author upon reasonable request.
Ethics approval statment
The study was approved by the Institutional Review Board of the Zhongshan Hospital, Fudan University. Written consent was obtained from all patients.
Disclosure statement
No potential conflict of interest was reported by the author(s).
Additional information
Funding
References
- van de Donk N, Pawlyn C, Yong KL. Multiple myeloma. Lancet. 2021;397(10272):410–427. doi:10.1016/S0140-6736(21)00135-5
- Liu J, Liu W, Mi L, et al. Incidence and mortality of multiple myeloma in China, 2006-2016: an analysis of the global burden of disease study 2016. J Hematol Oncol. 2019;12(1):136. doi:10.1186/s13045-019-0807-5
- Sneyd MJ, Gray AR, Morison IM. Trends in survival from myeloma, 1990-2015: a competing risks analysis. BMC Cancer. 2021;21(1):821. doi:10.1186/s12885-021-08544-7
- Sneyd MJ, Cox B, Morison IM. Trends in myeloma incidence, mortality and survival in New Zealand (1985-2016). Cancer Epidemiol. 2019;60:55–59. doi:10.1016/j.canep.2019.03.006
- Fonseca R, Abouzaid S, Bonafede M, et al. Trends in overall survival and costs of multiple myeloma, 2000-2014. Leukemia. 2017;31(9):1915–1921. doi:10.1038/leu.2016.380
- Kumar SK, Therneau TM, Gertz MA, et al. Clinical course of patients with relapsed multiple myeloma. Mayo Clin Proc. 2004;79(7):867–874. doi:10.4065/79.7.867
- Kazandjian D. Multiple myeloma epidemiology and survival: a unique malignancy. Semin Oncol. 2016;43(6):676–681. doi:10.1053/j.seminoncol.2016.11.004
- Brioli A, Melchor L, Cavo M, et al. The impact of intra-clonal heterogeneity on the treatment of multiple myeloma. Br J Haematol. 2014;165(4):441–454. doi:10.1111/bjh.12805
- Corre J, Munshi N, Avet-Loiseau H. Genetics of multiple myeloma: another heterogeneity level? Blood. 2015;125(12):1870–1876. doi:10.1182/blood-2014-10-567370
- Durie BGM, Hoering A, Sexton R, et al. Longer term follow-up of the randomized phase III trial SWOG S0777: bortezomib, lenalidomide and dexamethasone vs. lenalidomide and dexamethasone in patients (Pts) with previously untreated multiple myeloma without an intent for immediate autologous stem cell transplant (ASCT). Blood Cancer J. 2020;10(5):53. doi:10.1038/s41408-020-0311-8
- Joseph NS, Kaufman JL, Dhodapkar MV, et al. Long-term follow-up results of lenalidomide, bortezomib, and dexamethasone induction therapy and risk-adapted maintenance approach in newly diagnosed multiple myeloma. J Clin Oncol: Off J Am Soc Clin Oncol. 2020;38(17):1928–1937. doi:10.1200/JCO.19.02515
- Reeder CB, Reece DE, Kukreti V, et al. Long-term survival with cyclophosphamide, bortezomib and dexamethasone induction therapy in patients with newly diagnosed multiple myeloma. Br J Haematol. 2014;167(4):563–565. doi:10.1111/bjh.13004
- Srivastava G, Rana V, Lacy MQ, et al. Long-term outcome with lenalidomide and dexamethasone therapy for newly diagnosed multiple myeloma. Leukemia. 2013;27(10):2062–2066. doi:10.1038/leu.2013.143
- Blimark CH, Turesson I, Genell A, et al. Outcome and survival of myeloma patients diagnosed 2008-2015. Real-world data on 4904 patients from the Swedish myeloma registry. Haematologica. 2018;103(3):506–513. doi:10.3324/haematol.2017.178103
- Paquin A, Visram A, Kumar SK, et al. Characteristics of exceptional responders to autologous stem cell transplantation in multiple myeloma. Blood Cancer J. 2020;10(8):87. doi:10.1038/s41408-020-00353-8
- Zamagni E, Barbato S, Cavo M. How I treat high-risk multiple myeloma. Blood. 2022;139(19):2889–2903. doi:10.1182/blood.2020008733
- Moreau P, Cavo M, Sonneveld P, et al. Combination of international scoring system 3, high lactate dehydrogenase, and t(4;14) and/or del(17p) identifies patients with multiple myeloma (MM) treated with front-line autologous stem-cell transplantation at high risk of early MM progression-related death. J Clin Oncol: Off J Am Soc Clin Oncol. 2014;32(20):2173–2180. doi:10.1200/JCO.2013.53.0329
- Rajkumar SV, Dimopoulos MA, Palumbo A, et al. International myeloma working group updated criteria for the diagnosis of multiple myeloma. Lancet Oncol. 2014;15(12):e538–e548. doi:10.1016/S1470-2045(14)70442-5
- Kumar S, Paiva B, Anderson KC, et al. International myeloma working group consensus criteria for response and minimal residual disease assessment in multiple myeloma. Lancet Oncol. 2016;17(8):e328–ee46. doi:10.1016/S1470-2045(16)30206-6
- McCarthy PL, Holstein SA, Petrucci MT, et al. Lenalidomide maintenance after autologous stem-cell transplantation in newly diagnosed multiple myeloma: a meta-analysis. J Clin Oncol: Off J Am Soc Clin Oncol. 2017;35(29):3279–3289. doi:10.1200/JCO.2017.72.6679
- Verelst SGR, Blommestein HM, De Groot S, et al. Long-term outcomes in patients with multiple myeloma: a retrospective analysis of the Dutch population-based HAematological registry for observational studies (PHAROS). HemaSphere. 2018;2(4):e45. doi:10.1097/HS9.0000000000000045
- Hájek R, Jarkovsky J, Maisnar V, et al. Real-world outcomes of multiple myeloma: retrospective analysis of the Czech registry of monoclonal gammopathies. Clin Lymphoma Myeloma Leuk. 2018;18(6):e219–ee40. doi:10.1016/j.clml.2018.04.003
- Lu J, Lu J, Chen W, et al. Clinical features and treatment outcome in newly diagnosed Chinese patients with multiple myeloma: results of a multicenter analysis. Blood Cancer J. 2014;4(8):e239. doi:10.1038/bcj.2014.55
- Cejalvo MJ, Bustamante G, González E, et al. Treatment patterns and outcomes in real-world transplant-ineligible patients newly diagnosed with multiple myeloma. Ann Hematol. 2021;100(7):1769–1778. doi:10.1007/s00277-021-04529-5
- Holmström MO, Gimsing P, Abildgaard N, et al. Causes of early death in multiple myeloma patients who are ineligible for high-dose therapy with hematopoietic stem cell support: a study based on the nationwide Danish myeloma database. Am J Hematol. 2015;90(4):E73–E74. doi:10.1002/ajh.23932
- Ríos-Tamayo R, Sáinz J, Martínez-López J, et al. Early mortality in multiple myeloma: the time-dependent impact of comorbidity: a population-based study in 621 real-life patients. Am J Hematol. 2016;91(7):700–704. doi:10.1002/ajh.24389
- Brink M, Groen K, Sonneveld P, et al. Decrease in early mortality for newly diagnosed multiple myeloma patients in the Netherlands: a population-based study. Blood Cancer J. 2021;11(11):178. doi:10.1038/s41408-021-00571-8
- Kumar V, Ailawadhi M, Dutta N, et al. Trends in early mortality from multiple myeloma: a population-based analysis. Clin Lymphoma Myeloma Leuk. 2021;21(5):e449–ee55. doi:10.1016/j.clml.2020.12.023
- Yan Y, Mao X, Liu J, et al. The impact of response kinetics for multiple myeloma in the era of novel agents. Blood Adv. 2019;3(19):2895–2904. doi:10.1182/bloodadvances.2019000432
- Corre J, Montes L, Martin E, et al. Early relapse after autologous transplant for myeloma is associated with poor survival regardless of cytogenetic risk. Haematologica. 2020;105(9):e480–e483. doi:10.3324/haematol.2019.236588
- Kyle RA, Gertz MA, Witzig TE, et al. Review of 1027 patients with newly diagnosed multiple myeloma. Mayo Clin Proc. 2003;78(1):21–33. doi:10.4065/78.1.21
- Terpos E, Zamagni E, Lentzsch S, et al. Treatment of multiple myeloma-related bone disease: recommendations from the bone working group of the international myeloma working group. Lancet Oncol. 2021;22(3):e119–ee30. doi:10.1016/S1470-2045(20)30559-3
- Vu T, Gonsalves W, Kumar S, et al. Characteristics of exceptional responders to lenalidomide-based therapy in multiple myeloma. Blood Cancer J. 2015;5(10):e363. doi:10.1038/bcj.2015.91
- Bartel TB, Haessler J, Brown TL, et al. F18-fluorodeoxyglucose positron emission tomography in the context of other imaging techniques and prognostic factors in multiple myeloma. Blood. 2009;114(10):2068–2076. doi:10.1182/blood-2009-03-213280
- Zamagni E, Patriarca F, Nanni C, et al. Prognostic relevance of 18-F FDG PET/CT in newly diagnosed multiple myeloma patients treated with up-front autologous transplantation. Blood. 2011;118(23):5989–5995. doi:10.1182/blood-2011-06-361386
- Cho HJ, Jung SH, Jo JC, et al. Development of a new risk stratification system for patients with newly diagnosed multiple myeloma using R-ISS and (18)F-FDG PET/CT. Blood Cancer J. 2021;11(12):190. doi:10.1038/s41408-021-00577-2
- Greenberg AJ, Rajkumar SV, Therneau TM, et al. Relationship between initial clinical presentation and the molecular cytogenetic classification of myeloma. Leukemia. 2014;28(2):398–403. doi:10.1038/leu.2013.258
- Swaminathan SK, Roger E, Toti U, et al. CD133-targeted paclitaxel delivery inhibits local tumor recurrence in a mouse model of breast cancer. J Controll Release: Off J Controll Release Soc. 2013;171(3):280–287. doi:10.1016/j.jconrel.2013.07.014
- Avet-Loiseau H, Facon T, Grosbois B, et al. Oncogenesis of multiple myeloma: 14q32 and 13q chromosomal abnormalities are not randomly distributed, but correlate with natural history, immunological features, and clinical presentation. Blood. 2002;99(6):2185–2191. doi:10.1182/blood.V99.6.2185
- Mikhael JR, Dingli D, Roy V, et al. Management of newly diagnosed symptomatic multiple myeloma: updated Mayo Stratification of Myeloma and Risk-Adapted Therapy (mSMART) consensus guidelines 2013. Mayo Clin Proc. 2013;88(4):360–376. doi:10.1016/j.mayocp.2013.01.019
- Rajan AM, Rajkumar SV. Interpretation of cytogenetic results in multiple myeloma for clinical practice. Blood Cancer J. 2015;5(10):e365. doi:10.1038/bcj.2015.92
- Lakshman A, Alhaj Moustafa M, Rajkumar SV, et al. Natural history of t(11;14) multiple myeloma. Leukemia. 2018;32(1):131–138. doi:10.1038/leu.2017.204
- Badar T, Hari P, Dávila O, et al. African Americans with translocation t(11;14) have superior survival after autologous hematopoietic cell transplantation for multiple myeloma in comparison with whites in the United States. Cancer. 2020;127(1):82–92. doi:10.1002/cncr.33208
- Kaufman GP, Gertz MA, Dispenzieri A, et al. Impact of cytogenetic classification on outcomes following early high-dose therapy in multiple myeloma. Leukemia. 2016;30(3):633–639. doi:10.1038/leu.2015.287
- Sasaki K, Lu G, Saliba RM, et al. Impact of t(11;14)(q13;q32) on the outcome of autologous hematopoietic cell transplantation in multiple myeloma. Biol Blood Marrow Transplant: J Am Soc Blood Marrow Transplant. 2013;19(8):1227–1232. doi:10.1016/j.bbmt.2013.05.017
- Avet-Loiseau H, Leleu X, Roussel M, et al. Bortezomib plus dexamethasone induction improves outcome of patients with t(4;14) myeloma but not outcome of patients with del(17p). J Clin Oncol: Off J Am Soc Clin Oncol. 2010;28(30):4630–4634. doi:10.1200/JCO.2010.28.3945
- San Miguel JF, Schlag R, Khuageva NK, et al. Bortezomib plus melphalan and prednisone for initial treatment of multiple myeloma. N Engl J Med. 2008;359(9):906–917. doi:10.1056/NEJMoa0801479
- Fonseca R, Bergsagel PL, Drach J, et al. International myeloma working group molecular classification of multiple myeloma: spotlight review. Leukemia. 2009;23(12):2210–2221. doi:10.1038/leu.2009.174
- Greipp PR, San Miguel J, Durie BG, et al. International staging system for multiple myeloma. J Clin Oncol. 2005;23(15):3412–3420. doi:10.1200/JCO.2005.04.242
- Palumbo A, Avet-Loiseau H, Oliva S, et al. Revised international staging system for multiple myeloma: A report from international Myeloma working group. J Clin Oncol. 2015;33(26):2863–2869. doi:10.1200/JCO.2015.61.2267
- Bryant C, Suen H, Brown R, et al. Long-term survival in multiple myeloma is associated with a distinct immunological profile, which includes proliferative cytotoxic T-cell clones and a favourable treg/Th17 balance. Blood Cancer J. 2013;3(9):e148. doi:10.1038/bcj.2013.34