
ABSTRACT
Objectives
Identifying the specific biomarkers and molecular signatures of MM might provide novel evidence for MM prognosis and targeted therapy.
Methods
Bioinformatic analyses were performed through GEO and TCGA datasets. The differential expression of HIST1H2BH in MM sample was validated by the qRT-PCR. And the CCK-8 assay was performed to detect the proliferation activity of HIST1H2BH on MM cell lines.
Results
A total of 793 DEGs were identified between bone marrow plasma cells from newly diagnosed myeloma and normal donors in GSE6477. Among them, four vital genes (HIST1H2AC, HIST1H2BH, CCND1 and TCF7L2) modeling were constructed. The increased HIST1H2BH expression was correlated with worse survival of MM based on TCGA datasets. The transcriptional expression of HIST1H2BH was significantly up-regulated in primary MM patients. And knockdown HIST1H2BH decreased the proliferation of MM cell lines.
Conclusions
We have identified up-regulated HIST1H2BH in MM patients associated with poor prognosis using integrated bioinformatical methods.
Introduction
As an incurable, biologically heterogeneous disease of the plasma cells, MM is one of the hematologic cancers that account for approximately 10% of all hematologic malignancies and is the second most common hematologic malignancy [Citation1–5]. The incidence of MM in China is 0.9/100,000 per year, much lower than that in the United States (6.56/100,000 per year) [Citation6–10]. Overproduction of immunoglobulins or immunoglobulin chains that are unfunctional due to abnormal monoclonal plasma cell growth in bone marrow. Bone lesions, anemia, hypercalcemia and other symptoms are caused by the accumulation of intact immunoglobulins and aberrant monoclonal plasma cells in the bone marrow [Citation11–16]. Recent studies have found that MM cells induce changes in the bone marrow micro-environment through complex genetic and epigenetic abnormalities, affecting the tumor's clinical course and directly impacting patient prognosis [Citation17]. Therefore, it is crucial to explore the pathogenesis of MM at the molecular level to identify new tumor markers and therapeutic targets and improve early diagnosis, treatment outcomes and prognosis.
There is evidence that changes in histone modifications can specifically activate or suppress the transcriptional activity of specific genes and that histone modification-related proteins are closely associated with MM epigenetic regulation [Citation18, Citation19]. H2B protein plays an essential role in histone modification [Citation20–22]. Previous studies have demonstrated that mutations in H2B may represent a class of oncogenic drivers. HIST1H2BH, as a critical member of the H2B histone family, has also been shown to serve as a predictive factor for cervical cancer prognosis [Citation23].
In the present study, bioinformatics methods were used to investigate the differential gene expression profiles of MM samples in both the Gene Expression Omnibus (GEO, https://www.ncbi.nlm.nih.gov/geo/) database and The Cancer Genome Atlas Program (TCGA, https://portal.gdc.cancer.gov/). A critical hub gene analysis was then conducted and HIST1H2BH level was found to be used as independent prognostic factors for MM. Additionally, higher expression levels of MM patients were more likely to have a reduced survival time. Furthermore, the expression level of HIST1H2BH was then validated in primary MM patients and its’ function was explored in vitro experiments. Our research may be helpful to identify new molecular signature and therapeutic target of MM patients.
Methods
Data collection
GSE6477, related to MM dataset, was downloaded from the GEO database. Moreover, this dataset, with data platform GPL96, has CD138-selected bone marrow plasma cells from 69 new MM and 15 normal samples, consisting of array data corresponding to Homo sapiens.
Differential expression analysis
Differentially expressed genes (DEGs) between 69 new MM and 15 healthy samples of the GSE6477 dataset was identified by the ‘limma’ R package (https://www.bioconductor.org/packages/ release/bioc/html/limma.html) [Citation24] based on the GEO database [Citation25]. The selection criteria for DEGs were: adjusted P-value (adj. P) < 0.05 and |log FC| > 1, indicating that the gene is dis-regulated.
GO and KEGG pathway enrichment analyses
An online website (bioinformatics.com.cn) was used to analyze GO and KEGG pathway enrichment. A total of 793 DEGs genes were analyzed to detect the GO terms that displayed enrichment in three categories (biological processes, cellular components and molecular functions) and the KEGG pathways.
Protein−protein interaction analysis
The online website STRING (https://string-db.org/) was used to analyze PPI [Citation26]. Firstly, Protein IDs were translated into gene symbols, and those PPIs without corresponding gene names were excluded. Then, Cytoscape 3.9.1 was used to construct the PPI network (https://cytoscape.org/). The cytoHubba plugin was used to identify hub genes.
Patients
In this study, from November 2021 to June 2022, the primary diagnosed MM patients with complete data were enrolled, and the patients with greater than 20% MM cells of bone marrow. The institutional ethics committee approved the study with informed consent (The ethics serial number is QYFY WZLL 28115.).
Real-time PCR validation
Real-time PCR was performed to validate the expression of HIST1H2BH in both MM patients and healthy controls. Primer Premier 5.0 software was used to design the HIST1H2BH primer. The primer sequences were as following: Fwd primer: GATCCAGCTAAGTCCGCTC, Rev primer: ATGGCTTTGGAGGAGATGCC.
The PCR reactions were performed in a total volume of 20 µL containing 10 µL of 2X ChamQ Universal SYBR qPCR Master Mix. The amplification program was as follows: initial hot start (30s, 95 °C) and 40 cycles with denaturation (10s, 95 °C), annealing (30s, 60 °C), extension (60s, 72 °C) with a final melting curve (15s, 95 °C) (60s, 60 °C) (15s, 95 °C).
Gene set enrichment analysis and correlation analysis
Gene set enrichment analysis (GSEA) was used as a computational method to determine if a pre-defined set of genes shows statistically significant differences between two biological states. The program multiple GSEA was used to analyze the gene expression data from TCGA. The selected criteria were P < 0.05, and only pathways related to tumors were retained. The differentially expressed genes, up- and down-regulated, were then subjected to a correlation analysis.
Survival curve, independent prognosis analysis and clinical correlation analysis
Differential gene expression analysis, pathway enrichment analysis (GO and KEGG) and protein network analysis were performed on the data from GEO. A critical hub gene analysis was conducted and HIST1H2BH was selected as the target gene for further study. Independent prognostic analysis and clinical correlation analysis were conducted based on the data from the TCGA (https://portal.gdc.cancer.gov).
Cell viability
The proliferation activity of HIST1H2BH was tested on U266 and RPMI8226 cell lines. Stable cell lines were established using the lentivirus system, and puromycin was used to establish the HIST1H2BH knockdown (siHIST1H2BH) stable lines (1.5μg/ml for RPMI-8266 and 2.5μg/ml for U266). These cell lines were seeded in 96-well plates (1 × 10⁴ cells/well), and cell viability was evaluated with CCK-8 assay. The assay was performed according to the manufacturer’s protocol.
Results
Differential genes analysis of MM dataset
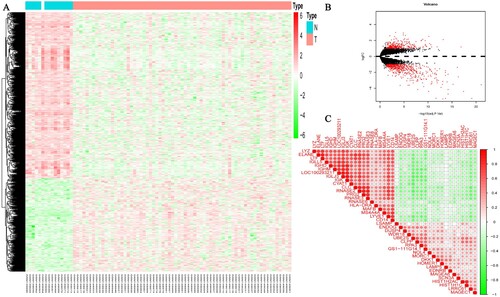
Data downloaded from the GEO database was annotated to convert the gene probe matrix into a gene matrix. DEG analysis was then performed, and a total of 793 DEGs were obtained, including 285 up-regulated genes and 508 down-regulated genes (A). The volcano plot was conducted by the ggplot2 package (B). The X-axis represents the log2-transformed FC and the Y-axis represents the adjusted P-value. The abscissa-above red dots represent up-regulated genes, while the abscissa-below red dots represent down-regulated genes in MM patients. The black dots represent genes with no significant differences. Correlation analysis was performed on the top 40 differentially expressed genes regarding up- and down-regulation. The green circles indicate a negative correlation and red circles indicate positive correlation. The circle size has a direct ratio to the correlation results (C).
Figure 1. The expression of DEGs based on GEO database datasets. (A) Heatmap showed 793 DEGs, including 285 upregulated genes and 508 down-regulated genes and (B) Violin diagrams, the abscissa-above red dots represent upregulated genes in MM patients, the abscissa-below red dots represent down-regulated genes in MM patients and the black dots represent genes with no significant differences. (C) Correlation plot of 40 DEGs. The positive correlation was marked with red and negative correlation was marked with blue. The size of circle represents the absolute value of correlation coefficients.
GO and KEGG analysis
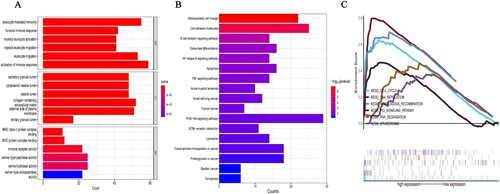
GO analysis was performed on the DEGs. The results of the biological process analysis showed that the differentially expressed genes associated with tumor were mainly enriched in subsets such as leukocyte-mediated immunity, leukocyte migration and activation of the immune response etc. Cellular component analysis showed that the differentially expressed genes were mainly enriched in subsets such as collagen-containing extracellular matrix and the external side of the plasma membrane etc. Molecular function analysis showed that the differentially expressed genes were mainly enriched in subsets such as serine-type peptidase activity and serine hydrolase activity (A) etc. KEGG pathway enrichment analysis of the DEGs showed enrichment in pathways such as the PI3K-Akt signaling pathway, hematopoietic cell lineage and cell adhesion molecules (B) etc. GSEA analysis of the entire gene sets in the dataset showed enrichment of pathways mainly related to cell cycle, DNA replication, homologous recombination, P53 signal pathway, RNA degradation and spliceosome (C).
Figure 2. The GO, KEGG enrichment and GSEA analyses using the 793 DEGs. (A) GO functional analysis shows enriched items in the DEGs. (B) KEGG analysis shows the enriched items in the DEGs. BP, biological process; CC, cellular component; MF, molecular function. (C) GSEA plot of genes involved in cell cycle, DNA replication, homologous recombination, P53 signaling pathway, RNA degradation, and spliceosome signaling pathway.
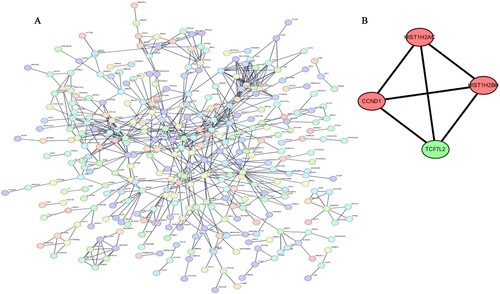
The DEGs obtained from the screening were analyzed on the String website to generate a protein interaction network. The interaction score with the highest confidence (0.9) was chosen as the minimum required interaction score (A). Cytoscape was used to select hub genes, and the cytoHubba plugin was used to screen for functional modules in the PPI network to identify sub-networks. The sub-net scored four and showed interactions between HIST1H2AC, HIST1H2BH, CCND1 and TCF7L2 (B).
Figure 3. The protein–protein interaction (PPI) network and 4 hub gene interaction network analyzed using Cytoscape software (A) PPI network. The interaction score with the highest confidence (0.9) was chosen as the minimum required interaction score. (B) The sub-net scored four and showed interactions between HIST1H2AC, HIST1H2BH, CCND1 and TCF7L2.
Survival curves, independent prognosis analysis and clinical correlation analysis
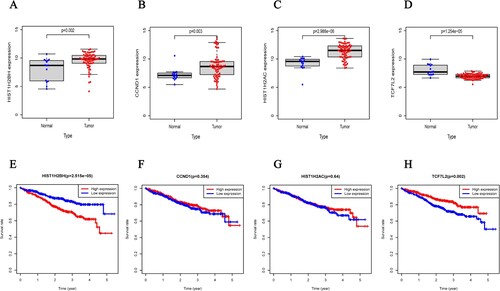
The survival package was used to perform multivariate Cox regression analysis according to patient HIST1H2BH expression levels, age, disease stage and gender in the TCGA datasets (A). The results showed that HIST1H2BH levels, age and stage could be used as independent prognostic factors for MM, while gender was not an independent factor associated with patient survival. The expression of HIST1H2BH showed an increasing trend with the disease progression, although it was not statistically significant (B). The expression of the HIST1H2BH (A, P < 0.05), CCND1 (B, P < 0.05), and HIST1H2AC (C, P < 0.001) genes in MM patients was up-regulated compared to normal individuals. While the expression of the TCF7L2 gene in MM patients was down-regulated compared with normal individuals (D, P < 0.001). The HIST1H2BH gene of MM patients in the high-risk group was more likely to have a reduced survival time compared with those in the low-risk group (E, P < 0.001), while TCF7L2 gene was direct opposite (H, P < 0.05). There were no significant difference on HIST1H2AC and CCND1 (F and G, P > 0.05).
Figure 4. (A) Multivariate Cox regression analysis according to HIST1H2BH expression levels, patient age, gender and disease stage based on DEGs in the TCGA dataset. (B) HIST1H2BH expression levels on different clinical stage based on TCGA dataset.
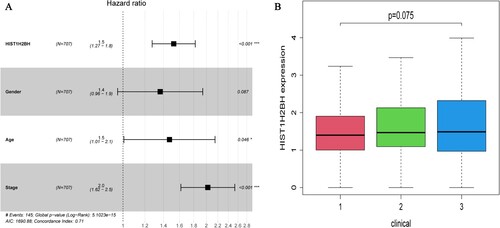
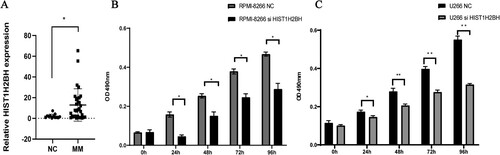
Figure 5. The expression of HIST1H2BH increased in MM samples and siHIST1H2BH can decrease the proliforation of MM cell lines. Relative HIST1H2BH expression was determined in MM samples and healthy people by quantitative real-time PCR analysis. (B and C) Cell growth of siHIST1H2BH and siControl transfected U266 and RPMI8226 cell lines was analyzed by CCK-8 assays.
The expression of HIST1H2BH in MM patients and HIST1H2BH effects on MM cells proliferation
Sample clinical features have been shown in . Real-time PCR was used to detect the expression of HIST1H2BH in MM primary patients and the healthy controls. And the correlation between HIST1H2BH expression and clinical characteristics of MM patients was shown in , it was found that there was a statistically significant difference in bone lesion and renal impairment groups. Additionally, RT–PCR result showed that the significant increased expression of HIST1H2BH in MM patients compared to that of the healthy controls (A, P < 0.05).
Table 1. Sample clinical features of MM.
Table 2. Correlation between HIST1H2BH expression and clinical characteristics of MM patients.
Proliferation activity of MM cell lines was measured by CCK-8 assay to assess short-term cell viability of siHIST1H2BH transfected MM cells. Absorbance values were measured every 24 h. After 96 h of continuous incubation, the proliferation curve showed that the HIST1H2BH-knockdown cells (defined as the siHIST1H2BH group) exhibited significantly slower proliferation when compared with the control group at 24, 48, 72 and 96 h for both U266 and RPMI8226 cell lines (p < 0.05, B and C). Our results suggested that down-regulation of HIST1H2BH decreased MM cell proliferation.
Discussion
Until now, MM still remains incurable because novel treatments and plenty of biomarkers that reflect host- or tumor-related factors have failed to explain the heterogeneity in clinical outcomes [Citation27–31]. Recently, evaluation systems based on prognostic parameters have been established for stratifying risk [Citation32–35]. Therefore, it is crucial to identify novel clinical marker to predict prognosis and tailor treatment plans for MM patients.
An epigenetic trait is information beyond DNA sequence that can be inherited from one generation to the next. Extensive research over the years has revealed that histone modifications, DNA methylation and RNA-mediated mechanisms are the primary methods of regulating epigenetics. During transcription, histone modifications like ubiquitination, acetylation and methylation happen simultaneously and are crucial for successful transcription [Citation20]. Evidence suggests that epigenetic regulation of MM is closely linked to histone modification-related proteins [Citation18, Citation19]. Post-translational modification of histones refers to the addition of different acylation modifications to the amino acid residues at the tail of histones, which can regulate gene transcription and expression by altering chromatin structure without altering DNA sequence [Citation36, Citation37].
In histone modification, the H2B protein plays an important role [Citation20–22], Tathe et al. found that SHP-1-mediated dephosphorylation of Y121 may be a prerequisite for efficient ubiquitination of H2B in the absence of Y121 phosphorylation. SHP-1-mediated H2B dephosphorylation contributes to maintaining basal autophagic flux in cells through the efficient transcription of genes associated with autophagy and lysosomes [Citation20]. H2B is an essential post-translational modification, Wang’s study provides new mechanistic insights into chromatin remodeling in reprogrammable cells by showing that RNF20-mediated H2B ubiquitination promotes chromatin relaxation [Citation21]. In addition, H2B involved in differentiation [Citation38, Citation39], transcription initiation and elongation [Citation40, Citation41], meiotic recombination [Citation42] and other fundamental physiological processes. Monoubiquitination occurs at Lysine 120 (K120) at which histone H2B (H2Bub1) is monoubiquitinated, causing chromatin strands to be physically disrupted, leading to open and accessible fibers [Citation43]. Studies have demonstrated that mutations in H2B may play an important role in the development of cancer. As a key member of the H2B histone family, HIST1H2BH also serves as a predictor of cervical cancer outcomes [Citation23]. At present, only a few publications focus on the role of HIST1H2BH in tunors, such as head and neck squamous cell carcinoma [Citation44] and endometrial cancers [Citation45]. However, there is no literature about the effect of HIST1H2BH on MM ().
Figure 6. The expression of four different genes in tumor and normal tissue from TCGA cohort (A.HIST1H2BH gene, B.CCND1 gene, C.HIST1H2AC gene, D.TCF7L2 gene) and Kaplan-Meier curves for the OS of patients in the high-risk group and low-risk group in the TCGA cohort for four genes (E.HIST1H2BH gene, F.CCND1 gene, G.HIST1H2AC gene, H.TCF7L2 gene).
In the present work, we compared HIST1H2BH gene expression datasets from the GEO database with MM samples and identified 793 DEGs. Among them, the expression level of 285 was up-regulated, while the expression level of 508 was down-regulated. According to GO analysis, the results of the biological process analysis showed that the differentially expressed genes associated with tumor were mainly enriched in subsets such as leukocyte-mediated immunity, leukocyte migration and activation of the immune response etc. Cellular component analysis showed that the differentially expressed genes were mainly enriched in subsets such as collagen-containing extracellular matrix and the external side of the plasma membrane etc. Molecular function analysis showed that the differentially expressed genes were mainly enriched in subsets such as serine-type peptidase activity and serine hydrolase activity etc. KEGG pathway enrichment analysis of the DEGs showed enrichment in pathways such as the PI3K-Akt signaling pathway, hematopoietic cell lineage and cell adhesion molecules etc. Additionally, we built a PPI network containing 127 nodes and 413 edges. This PPI network's top module was then screened with the cytoHubba plugin. In the meantime, 4 DEGs were discovered from the as-built PPI network. Furthermore, survival analysis revealed that the selected hub gene HIST1H2BH was strongly associated with poor OS in MM patients. Finally, we confirmed that HIST1H2BH was up-regulated in MM primary samples via qPCR. And CCK-8 assay showed knockdown HIST1H2BH could decrease the proliferation of MM cells. In conclusion, the present study had identified HIST1H2BH as the hub gene associated with multiple myeloma using integrated bioinformatics analysis and validated by in vitro experiments. According to the present research, HIST1H2BH level was expressed significant higher in the MM patients group compared to the healthy donors, and the survival curve results showed a negative correlation between HIST1H2BH expression and MM prognosis. Our results suggested that HIST1H2BH may functioned as an oncogene in MM, that could be therapeutic target for personalized and precision treatment of MM patients. As a key member of the H2B histone family, HIST1H2BH may function as a regulator through epigenetic regulation. Its’ biological function requires further exploration in the future.
Authors’ contributions
Conceived and designed the experiments: W.X.Z., X.C. and Y.Y.Z. Performed the experiments: W.X.Z., X.C., Y.Y.Z., Q.W., J.F., Z.W., D.X.W., Z.C.W. Analyzed the data: J.X.T., S.Y.Q. Contributed reagents/materials/analysis tools: W.X.Z., X.C. and Y.Y.Z. Wrote the paper: W.X.Z., X.C. and Y.Y.Z. The authors read and approved the final manuscript.
Limitation of the present study
The major limitation of the present study is the small sample size. The results would be more reliable with more enrolled MM patients.
Ethics approval and consent to participate
The present study was approved by the Ethics Committee of the Affiliated Hospital of Qingdao University. The ethics serial number is QYFY WZLL 28115.
Availability of data and materials
The datasets used and/or analyzed during the current study are available from the corresponding author on reasonable request.
Disclosure statement
No potential conflict of interest was reported by the author(s).
Additional information
Funding
References
- Kyle RA, Rajkumar SV. Multiple myeloma. N Engl J Med. 2004;351(18):1860–1873.
- Rajkumar SV, Kyle RA Plasma cell disorders. In: Goldman L, Ausiello D, editors. Cecil textbook of medicine, 23rd ed. Philadelphia, PA: Saunders; 2007; 1426–1437.
- Rajkumar SV. Multiple myeloma: 2022 update on diagnosis, risk stratification, and management. Am J Hematol. 2022;97(8):1086–1107.
- Kekre N, Connors JM. Venous thromboembolism incidence in hematologic malignancies. Blood Rev. 2019;33:24–32.
- Laubach J, Richardson P, Anderson K. Multiple myeloma. Annu Rev Med. 2011;62:249–264.
- International Agency for Research on Cancer. (2018). Estimated number of incident cases, both sexes, multiple myeloma, worldwide in 2013. Accessed August 31, 2018. http://gco.iarc.fr/today.
- Surveillance epidemiology and end results Fast Stats: an interactive tool for access to SEER cancer statistics, Surveillance Research Program, National Cancer Institute. Updated 2018 Accessed August 31, 2018. https://seercancergov/statfacts/.
- Liu J, Liu W, Mi L, et al. Incidence and mortality of multiple myeloma in China, 2006–2016: an analysis of the global burden of disease study 2016. J Hematol Oncol. 2019;12(1):136–142.
- Gao W, Zheng Y, Zhang R, et al. Incidence of multiple myeloma in Kailuan cohort: a prospective community-based study in China. Cancer Epidemiol. 2022;78:102168–102174.
- Wang S, Xu L, Feng J, et al. Prevalence and incidence of multiple myeloma in urban area in China: a national population-based analysis. Front Oncol. 2019;9:1513–1521.
- Kumar SK, Rajkumar V, Kyle RA, et al. Multiple myeloma. Nat Rev Dis Primers. 2017;3:17046–17065.
- Rajkumar SV. Multiple myeloma: every year a new standard? Hematol Oncol. 2019;37(Suppl 1):62–65.
- Padala SA, Barsouk A, Barsouk A, et al. Epidemiology, staging, and management of multiple myeloma. Med Sci (Basel). 2021;9(1):3–16.
- Eslick R, Talaulikar D. Multiple myeloma: from diagnosis to treatment. Aust Fam Physician. 2013;42(10):684–688.
- Barlogie B, Beck T. Recombinant human erythropoietin and the anemia of multiple myeloma. Stem Cells. 1993;11(2):88–94.
- Caceres W, Santiago K, Paulo L, et al. Anemia and infections in multiple myeloma: supportive therapy. Bol Asoc Med P R. 2009;101(2):50–52.
- Brigle K, Rogers B. Pathobiology and diagnosis of multiple myeloma. Semin Oncol Nurs. 2017;33(3):225–236.
- Yu J, Chai P, Xie M, et al. Histone lactylation drives oncogenesis by facilitating m(6)A reader protein YTHDF2 expression in ocular melanoma. Genome Biol. 2021;22(1):85–106.
- Bachmann C, Noreen F, Voermans NC, et al. Aberrant regulation of epigenetic modifiers contributes to the pathogenesis in patients with selenoprotein N-related myopathies. Hum Mutat. 2019;40(7):962–974.
- Tathe P, Chowdary K, Murmu KC, et al. SHP-1 dephosphorylates histone H2B to facilitate its ubiquitination during transcription. EMBO J. 2022;41(19):e109720–109740.
- Wang L, Xu Z, Wang L, et al. Histone H2B ubiquitination mediated chromatin relaxation is essential for the induction of somatic cell reprogramming. Cell Prolif. 2021;54(8):e13080–13093.
- Cole AJ, Clifton-Bligh R, Marsh DJ. Histone H2B monoubiquitination: roles to play in human malignancy. Endocr Relat Cancer. 2015;22(1):T19–T33.
- Li X, Tian R, Gao H, et al. Identification of a histone family gene signature for predicting the prognosis of cervical cancer patients. Sci Rep. 2017;7(1):16495–16507.
- Wang Y, Wang Z, Sun J, et al. Identification of HCC subtypes with different prognosis and metabolic patterns based on mitophagy. Front Cell Dev Biol. 2021;9:799507–799522.
- Seong BK, Fathers KE, Hallett R, et al. A metastatic mouse model identifies genes that regulate neuroblastoma metastasis. Cancer Res. 2017;77(3):696–706.
- Shannon P, Markiel A, Ozier O, et al. Cytoscape: a software environment for integrated models of biomolecular interaction networks. Genome Res. 2003;13(11):2498–2504.
- Shah UA, Mailankody S. Emerging immunotherapies in multiple myeloma. Br Med J. 2020;370:m3176–3194.
- Minnie SA, Hill GR. Immunotherapy of multiple myeloma. J Clin Invest. 2020;130(4):1565–1575.
- Heider M, Nickel K, Hogner M, et al. Multiple myeloma: molecular pathogenesis and disease evolution. Oncol Res Treat. 2021;44(12):672–681.
- Kastritis E, Terpos E, Dimopoulos MA. How I treat relapsed multiple myeloma. Blood. 2022;139(19):2904–2917.
- Jadoon Y, Siddiqui MA. Immunotherapy in multiple myeloma. Cancer Treat Res Commun. 2021;29:100468–100478.
- Li D, Wang L, Cai W, et al. Prognostic stratification in patients with pancreatic ductal adenocarcinoma after curative resection based on preoperative pancreatic contrast-enhanced CT findings. Eur J Radiol. 2022;151:110313–110325.
- Wu F, Sun H, Shi Z, et al. Estimating microvascular invasion in patients with resectable multinodular hepatocellular carcinoma by using preoperative contrast-enhanced MRI: establishment and validation of a risk score. J Hepatocell Carcinoma. 2023;10:1143–1156.
- Qu L, Wang ZL, Chen Q, et al. Prognostic value of a long non-coding RNA signature in localized clear cell renal cell carcinoma. Eur Urol. 2018;74(6):756–763.
- Ye J, Liao B, Jiang X, et al. Prognosis value of platelet counts, albumin and neutrophil-lymphocyte ratio of locoregional recurrence in patients with operable head and neck squamous cell carcinoma. Cancer Manag Res. 2020;12:731–741.
- Skvortsova K, Iovino N, Bogdanovic O. Functions and mechanisms of epigenetic inheritance in animals. Nat Rev Mol Cell Biol. 2018;19(12):774–790.
- Xu Q, Xie W. Epigenome in early mammalian development: inheritance, reprogramming and establishment. Trends Cell Biol. 2018;28(3):237–253.
- Fuchs G, Shema E, Vesterman R, et al. RNF20 and USP44 regulate stem cell differentiation by modulating H2B monoubiquitylation. Mol Cell. 2012;46(5):662–673.
- Chen S, Li J, Wang DL, et al. Histone H2B lysine 120 monoubiquitination is required for embryonic stem cell differentiation. Cell Res. 2012;22(9):1402–1405.
- Shema E, Kim J, Roeder RG, et al. RNF20 inhibits TFIIS-facilitated transcriptional elongation to suppress pro-oncogenic gene expression. Mol Cell. 2011;42(4):477–488.
- Lai CY, Hsieh MC, Ho YC, et al. Spinal RNF20-mediated histone H2B monoubiquitylation regulates mGluR5 transcription for neuropathic allodynia. J Neurosci. 2018;38(43):9160–9174.
- Xu Z, Song Z, Li G, et al. H2b ubiquitination regulates meiotic recombination by promoting chromatin relaxation. Nucleic Acids Res 2016;44(20):9681–9697.
- Minsky N, Shema E, Field Y, et al. Monoubiquitinated H2B is associated with the transcribed region of highly expressed genes in human cells. Nat Cell Biol. 2008;10(4):483–488.
- Wang SP, Ding ZX, Meng J, et al. Expression and clinical significance of HIST1H2BH in head and neck squamous cell carcinoma. Shanghai Kou Qiang Yi Xue. 2021;30(6):599–605.
- Takenaka K, Curry-Hyde A, Olzomer EM, et al. Investigation of transcriptome patterns in endometrial cancers from obese and lean women. Int J Mol Sci. 2022;23(19):11471–11484.