
ABSTRACT
Background:
This study aims to investigate the correlation between NK and NKT cell proportion disparities and prognosis in patients with acute myeloid leukemia (AML).
Methods:
Forty-four cases of acute myeloid leukemia patients were selected, and flow cytometry was utilized to evaluate the expression of bone marrow NK and NKT cells. Next-generation sequencing technology was employed to detect genetic mutations in these 44 AML patients, and the rates of first induction remission and overall survival were recorded. Comparisons were made to analyze the respective differences in NK and NKT cell proportions among AML patients with various genetic mutations and risk stratifications.
Results:
The FLT-3-ITD+ group exhibited a significant increase in the proportion of NK cells compared to the normal control group and FLT3-ITD+/NPM1+ group, whereas the proportion of NKT cells was significantly decreased. Additionally, the CEBPA+ group showed an increased proportion of NKT cells compared to the TP53+ group and ASXL1+ group. The high-risk group had a higher proportion of NK cells than the intermediate-risk group, while the proportion of NKT cells was lower in the high-risk group compared to the intermediate-risk group.Patients achieving first induction remission displayed a higher proportion of NKT cells at initial diagnosis compared to those who did not achieve remission. The distribution of NK cells show significant differences among AML patients in different survival periods.
Conclusion:
This results implies that distinct genetic mutations may play a role not only in tumor initiation but also in shaping the tumor microenvironment, consequently impacting prognosis.
Introduction
Acute myeloid leukaemia (AML) is a condition that hinders the differentiation of bone marrow haematopoietic stem/progenitor cells. This is caused by mutations in stem cells, leading to the accumulation of abnormal cells that disrupt normal blood cell production. Consequently, it results in various complications such as infection, haemorrhage, anaemia, infiltration, and hypermetabolism [Citation1]. AML is becoming more prevalent among adults and the elderly due to population aging [Citation2]. Among the components of the innate immune system, natural killer (NK) cells, which are large granular lymphocytes, play a crucial role in the early defense against allogeneic and malignant autologous cells [Citation3]. NK cells are a unique subset of lymphocytes that directly eliminate target cells, including tumor cells, virus-infected cells, bacterially infected cells, and certain healthy cells, without requiring antigen pre-sensitization. They act as the frontline of the body's immune defense system [Citation4]. There are two distinct subtypes of NK cells based on the expression of CD56 and CD16 molecules: CD56highCD16-NK cells and CD56dimCD16+ NK cells [Citation5]. Additionally, NKT-like cells,characterized by CD3 + CD56 + expression, exhibit superior proliferative capacity and lysis compared to CD3-CD56+ NK cells [Citation6].
The advent of second-generation sequencing technology has revolutionized the genetic classification of acute myeloid leukaemia. In 2016, the WHO Classification of Tumors of Haematopoietic and Lymphoid Tissues was updated to include genetic mutations that can impact prognosis, such as FLT3-ITD, NPM1, and ASXL1 [Citation7].
In this study, we utilized Next-generation sequencing technology to categorize different gene mutation types of acute myeloid leukemia. We also employed flow cytometry technology to assess the difference in the proportion of NK and NKT cells in AML among different gene mutation types. Following the European Leukemia Network (ELN) 2022 AML recommended guidance update, the gene mutation types were classified into risk stratitypes. We calculated the first induced remission rate and survival time, and analyzed the difference in the distribution of NK and NKT cells at first diagnosis between patients with the first induced remission and those without remission as a control. Additionally, we calculated the difference in the distribution of NK and NKT cells at first diagnosis for patients with different survival times.
Distinct genetic mutations exhibit varying clinical features and prognoses. The objective of this study is to investigate the expression characteristics of NK and NKT cells at the molecular level in AML patients with different gene mutations. Furthermore, we aim to explore the correlation between these characteristics and prognosis. Ultimately, our findings will serve as a reference for modulating the immune microenvironment and exploring novel approaches to acute leukaemia treatment.
Materials and methods
Case data
The clinical data and examination results of 44 hospitalized patients were reviewed in this study. The group consisted of 24 males and 20 females and they were admitted to the First Affiliated Hospital of Bengbu Medical University between January 2019 and December 2021. The median age of the patients was 55 years (range: 22-87). Detailed examinations and diagnoses of the bone marrow were conducted. Additionally, peripheral blood samples from 10 healthy patients were selected as the normal control group. Genetic mutations were detected using EDTA anticoagulation as a backup method, while flow cytometry was used for immunophenotyping analysis with heparin as an alternate anticoagulant. All samples were collected after initial diagnosis and before treatment. The research protocol was approved by the ethics committee (ethics number: Lunke Approval No. [2023] No. 406).
Flow cytometric examination
All antibodies used were purchased from Beckman Coulter, USA, and specific immunophenotypic markers including CD56-ECD, CD16-PE, CD45-KrO, CD3-PB, etc, were employed to analyze the ratios of NK and NKT cells between the normal control and acute myeloid leukemia groups. Heparin-anticoagulated bone marrow blood samples (50 μl) were collected, counted, and spiked to a standard cell count of 106 cells/ml per tube.
Sample Preparation and Staining Methods in Flow Cytometry.
Prepare the corresponding flow cytometry tubes, number them according to the specimen number, and label the injected fluorescent antibodies on each tube.
Inject the corresponding fluorescent McAb combinations into each tube, and replace the pipette head when adding antibodies to avoid cross-contamination between different antibodies.
Thoroughly mix the specimens (at least 10 times upside down), and add a certain amount of anticoagulated specimens to each tube, mixing well. Place them in a dark area, and incubate at room temperature for 20 minutes. When pipetting, avoid contacting the antibody in the tube.Otherwise, replace the pipette head and draw blood into the next tube. Do not leave blood stains on the tube wall.
Add 2 ml of lysis buffer, mix well, and incubate in the dark at room temperature for 5-10 minutes to allow red blood cells to lyse. Centrifuge at 1000-1200r/min for 5 minutes and discard the supernatant.
Resuspend the cells, add 2 ml of PBS, and mix well. Centrifuge at 800-1000r/min for 5 minutes, and discard the supernatant.
Resuspend the cells, add 300 ul of fixative solution, mix well, and incubate in a dark area at 2-8℃. Analyze the samples within 24 hours. Note that no additional antibodies should be added after the fixative solution is added.
Analyze using Kaluza software, set the gate using CD45/SSC, and select the CD45 + lymphocyte population. Choose the CD56 + cell population to analyze the proportion of NK and NKT cells.
Next generation sequencing of gene mutations
The gene libraries encompassed 34 common AML gene mutations.
Next-generation sequencing employs the Illumina sequencing platform, consisting of several crucial steps: Genome fragmentation→Terminal repair; 3 ‘end plus A→Joint connection and purification→PCR amplification and purification→Hybridization of library and probe to catch lipophilia→Capture and elution after hybridization→The library was amplified and purified again→Computer sequencing.
Sample preparation:Library preparation involves initially fragmenting the genomic DNA using enzymatic digestion or sonication methods, breaking down the complex DNA molecules into short fragments of 200-300 bp. A series of reactions are then performed to add sequencing adapter complementary to the sequencing instrument at both ends of the short fragments, enabling them to be retained on the sequencing instrument for completion of the sequencing process.
Computer sequencing:After library preparation, the samples were subjected to sequencing on an illumina sequencer, which employs the ‘sequencing by synthesis’ and ‘reversible terminator technology.’ Four types of dNTPs with different fluorescent labels were used in the sequencing reaction. Each round of sequencing added only one dNTP. When the dNTP matched the template, the corresponding fluorescent signal was emitted, and the CCD camera could capture the color of each round's reaction. The base sequence was read according to the color change. After the sequencing reaction was completed, the sequencing data were analyzed bioinformatically. Bioinformatic analysis requires quality control, sequence alignment, mutation site identification, and mutation site annotation. The mutation site annotation database includes tumor databases, population databases, and protein function prediction databases. After database modification of the sequencing files, the interpretation of the report begins.
Bioinformatics analysis process: The original BAM file is analyzed using IGV software. Prior to load the BAM file into IGV, sorting and indexing are necessary. The indexing process generates an auxiliary file with a ‘.fai’ extension, which associates the sequence alignment data (.bam) with the file name automatically. To import the sequence alignment data into IGV, the file must have a ‘.bam’ extension. During indexing, the file names must be identical, and the index files must be in the same folder. For instance, if the test file is named ‘test_xyz.bam’, the index file can be named ‘test_xyz.bam.bai’ or ‘test_xyz.bai’. These two steps can be performed using samtools or Picard software.
After loading the BAM file, three related tracks are generated: Alignment track, which displays the alignment of each read; Coverage track, which shows coverage and sequencing depth; and Splice Junction Track, which provides an optional view of reads spanning splice junctions. Generally, the first two tracks appear automatically, but their settings can be modified by right-clicking. By default, IGV dynamically calculates and displays the coverage and sequencing depth of the alignment file. When the IGV window is zoomed in to a size where reads are visible (default is 30KB), the track displays the sequencing depth at each site as a gray bar graph. If a nucleotide differs from the reference sequence by more than 20% of the reads, IGV will mark the difference in a different color.
Detection gene pool:
ASXL1、BCOR、BCORL1、CALR、CBL、CEBPA、CSF3R、DNMT3A、ETV6、EZH2、FLT3、GATA2、IDH1、IDH2、JAK2、KIT、KRAS、KMT2A、MPL、NPM1、NRAS、PDGFRA、PHF6、PIGA、RUNX1、SETBP1、SF3B1、SH2B3、SRSF2、TET2、TP53、U2AF1、WT1、ZRSR2.
Statistical analysis
The statistical analysis was performed using SPSS 22.0 software. Descriptive statistics, such as mean ± standard deviation (SD), were used to represent normally distributed measures. The one-way ANOVA test was used to compare multiple groups. Scatter plots and box plots were created using Prism 8.0 software. Statistical significance was determined at a p-value < 0.05.
Results
Flow cytometry diagram for NK and NKT cells
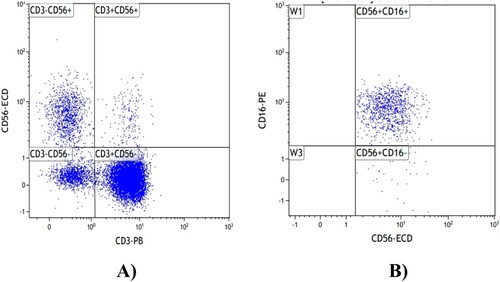
The flow cytometry gating logic for NK and NKT cells is described as follows: CD45/SSC gating was used to select the CD45 + lymphocyte population, followed by gating on CD3 and CD56. The population of CD3 + CD56 + cells was identified as NKT cells, while the population of CD3-CD56 + cells was designated as NK cells. Subsequently, gating based on CD56 and CD16 was performed, with CD56 + CD16 + representing the CD16+ NK cell population. The percentages of NK, NKT, and CD16+ NK cells among lymphocytes were then calculated. ().
Figure 1. Flow diagram of NK and NKT cells.(A)NKT cells.(B):CD16 + NK cells.
Frequency of mutation combinations in acute myeloid leukemia genes
Different molecular subtypes in acute myeloid leukemia (AML): The main difference among these subtypes is their gene mutation frequency VAFs. In the diagnostic criteria, a threshold of 10% is used for the mutation frequency of TP53. Therefore, we selected genotypes with a mutation rate of over 10% to eliminate the influence of minor mutations. Additionally, there are currently no literature reports confirming that unequal VAFs of single mutations affect different gene mutations. Given the small sample size in this study, we did not differentiate between different VAFs into separate groups. In this study, gene mutation groups with VAFs mutation frequency greater than 10% were selected.
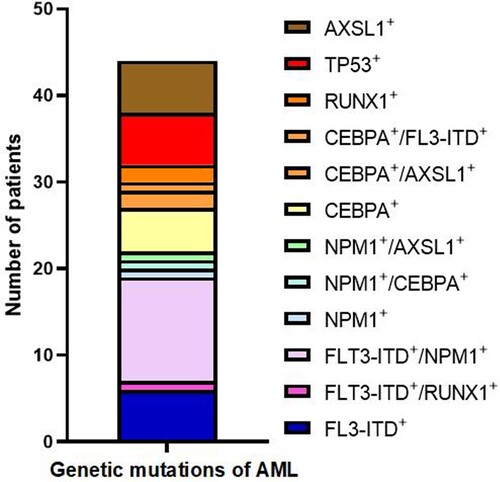
Frequency of mutation combinations in 44 patients with acute myeloid leukemia was as follows: FLT3-ITD + in 6 cases (13.6%), FLT3-ITD+/RUNX1 + in 1 case (2.2%), FLT3-ITD+/NPM1 + in 12 cases (27.2%), NPM1 + in 1 case (2.2%), NPM1+/CEBPA + in 1 case (2.2%), NPM1+/ASXL1 + in 1 case (2.2%), CEBPA + in 5 cases (11.4%), CEBPA+/ASXL1 + in 2 cases (4.5%), CEBPA+/FLT3-ITD + in 1 case (2.2%), RUNX1 + in 2 cases (4.5%), TP53 + in 6 cases (13.6%), and ASXL1 + in 6 cases (13.6%) ().
Figure 2. Frequency of mutation combinations in the acute myeloid leukaemia gene.
Multiparameter analysis
The proportion of NK and NKT cells was numerical, so multi-factor analysis was used for linear regression analysis. Multifactor linear regression analysis showed that hemoglobin was the factor affecting the proportion of CD16 + NK cells and NKT cells (P < 0.05) .
Table 1. Multiparameter analysis of NK/NKT cell ratio.
Differential distribution of NK and NKT cell proportions in AML patients with different gene mutation types
The distribution of NK and NKT cells varied among AML patients with different mutation types. Due to the small number of cases in certain mutation groups (FLT3-ITD+/RUNX1+,NPM1+,NPM1+/CEBPA+,NPM1+/ASXL1+, CEBPA+/ASXL1+, CEBPA+/FLT3-ITD+, RUNX1+), they were not included in the comparison of different mutations.
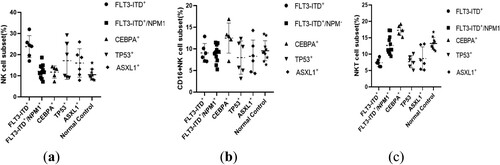
The percentage of NK lymphocytes was significantly higher in the FLT3-ITD + group (23.79 ± 5.21%) compared to the normal control group (10.51 ± 2.53%) (P = 0.0093). Additionally, a statistically significant difference was observed between the FLT3-ITD + group and the FLT3-ITD+/NPM1 + group (12.12 ± 3.15%) (P = 0.0034).
The proportion of NKT cells in the FLT3-ITD + group was (7.37 ± 1.15)%, which significantly differed from the normal control group (13.24 ± 1.83%) (P = 0.0047), as well as the FLT3-ITD+/NPM1 + group (12.64 ± 2.73%) (P = 0.0215). Furthermore, it exhibited a significant reduction compared to the CEBPA + group (17.27 ± 1.62%) (P = 0.0053). The proportion of NKT cells in the CEBPA + group was significantly higher than that in the TP53 + group (7.67 ± 1.87%)(P = 0.0018),and the ASXL1 + group (8.65 ± 3.55%)(P = 0.006).
No significant differences were found in the distribution of CD16+ NK cells among the groups ().
Figure 3. Differences in the distribution of NK and NKT cell proportions by mutation type.(a):NK cell;(b):CD16 + NKcell;(c):NKT cell.
Differences in the distribution of NK and NKT cell proportions in AML by genetic risk stratification
According to the European Leukemia Network (ELN) 2022 edition of the AML Recommendations Guidance Update, genetic mutations are classified into three risk strata:
- High-risk group: FLT3-ITD mutation, RUNX1 mutation, ASXL1 mutation, TP53 mutation.
- Intermediate-risk group: Other mutations that do not fall into the high-risk or low-risk categories.
- Low-risk group: NPM1 mutations without FLT3-ITD, CEBPA mutations.
Regarding the CEBPA mutations, it is important to note that only in-frame mutations in the leucine zipper domain of CEBPA are associated with favorable outcomes, regardless of whether they are monoallelic or biallelic. In this study, 4 out of 5 CEBPA mutations were found to have mutations in the bZIP domain, and these mutations were classified as belonging to a low-risk group.
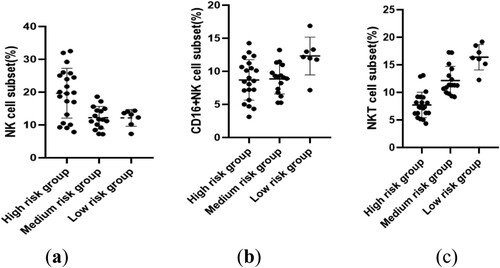
The proportions of NK and NKT cells significantly varied among AML patients in different risk strata. Notably, the high-risk group exhibited a statistically significant increase in the proportion of NK cells (19.66 ± 7.59%) compared to the intermediate-risk group (12.22 ± 3.41%) (P = 0.0026).
In terms of NKT cells, the high-risk group had a percentage of (7.71 ± 2.33)%, which significantly differed from the intermediate-risk group (12.14 ± 2.59%) (P = 0.0002). Additionally, the intermediate-risk group presented a statistically significant decrease compared to the low-risk group (16.38 ± 2.30%) (P = 0.0019). Furthermore, the high-risk group showed a statistically significant increase relative to the low-risk group (P = 0.0001). No significant differences were observed in the distribution of CD16+ NK cells between the risk stratification groups ().
Figure 4. Differential distribution of NK and NKT cell proportions in AML with different genetic risk stratification.(a):NK cell;(b):CD16 + NKcell;(c):NKT cell.
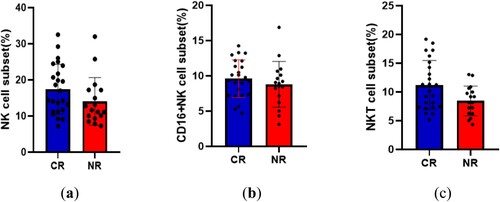
Comparison of differences in the distribution of NK and NKT cells at first diagnosis between the first induction of complete remission group and the incomplete remission group
The criteria for first induction of complete remission were as follows: 1) Bone marrow morphology: primitive and naive leukemia cells ≤ 5%; 2) Peripheral hemogram: Hb ≥ 100 g/L (female ≥ 90 g/L); absolute value of neutrophils ≥ 1.5 × 10⁹/L, classified without leukemia cells; PLT ≥ 100 × 109/L; 3) Clinical: No anemia, bleeding, infection, or leukemia cell infiltration.
Among the 44 patients, 41 had statistical data, of which 24 had the first induced response (CR), that is, the proportion of leukemia cells after chemotherapy was less than 5%, and 17 had the first induced non-response (NR).
At the time of initial diagnosis, the proportion of NK and NKT cells in the CR group was (17.42 ± 6.91)% and (11.20 ± 4.27)%, respectively, while in the NR group, it was (14.03 ± 6.6)% and (8.45 ± 2.59)%. The difference in the proportion of NK cells was not statistically significant (P = 0.1232), whereas a statistically significant difference was found for NKT cells (P = 0.0232). No significant difference was observed in the distribution of CD16+ NK cells between the two groups (P = 0.3809) ().
Figure 5. Comparison of the differences in the distribution of NK and NKT cells at the first diagnosis between the first induction of complete remission group and the incomplete remission group.(a):NK cell;(b):CD16 + NKcell;(c):NKT cell.
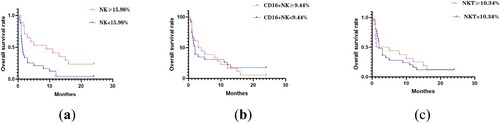
Differences in the distribution of NK and NKT cells overall survival rate
Tracking 41 AML patients, divided into two groups based on the average proportion of NK cells (15.98%), 17 patients with a proportion below 15.98% had a median survival of 1.35 months, while 24 patients with a proportion of NK ≥ 15.98% had a median survival of 9 months. There was a significant difference in overall survival (P = 0.0039 < 0.05).
Dividing patients by the average proportion of CD16 + NK cells (9.44%), 18 patients with a proportion below 9.44% had a median survival of 2 months, while 23 patients with CD16 + NK ≥ 9.44% had a median survival of 3.5 months. There was no significant difference in overall survival (P = 0.8278).
Patients were also divided by the average proportion of NKT cells (10.34%). There were 16 patients with a proportion below 10.34%, who had a median survival of 2 months, and 25 patients with NK ≥ 10.34%, who had a median survival of 3.1 months. There was no significant difference in overall survival (P = 0.0672) ().
Figure 6. Survival curves of AML patients with different NK/NKT cell ratios.(a):NK cell;(b):CD16 + NKcell;(c):NKT cell.
Discussion
NK cells,which are large granular lymphocytes,play a significant role in immune defense against viral infections and monitoring malignant cells. Numerous studies have demonstrated the potent anti-tumor effects of NK cells in various cancers, including chronic myeloid leukemia (CML), acute myeloid leukemia (AML), and myelodysplastic syndromes (MDS) [Citation8]. The involvement of NK cells in tumor immune surveillance has attracted considerable interest [Citation9]. Evidence suggests that individuals with impaired early NK cell function are more prone to developing cancer compared to healthy controls [Citation10]. Unlike T cells, NK cells are essential components of innate immunity due to their nonspecific recognition of tumor cells and ability to exert rapid and extensive anti-tumor effects [Citation11].
Studies have reported that patients with a high proportion of NK cells at the initial phase of AML tend to have a poorer prognosis. However, even among individuals with a high proportion of NK cells, the number of mature NK cells decreases [Citation12]. NK cells can be classified into mature (CD56dim) or immature (CD56bright) subsets based on the intensity of CD56 expression on their cell surface. Only mature NK cells possess potent cytotoxicity [Citation13]. It is believed that mature CD56dim NK cells may have originated from immature CD56high NK cells. Among the numerous NK cell receptors, CD16 plays a crucial role and exhibits substantial specificity. Although the exact contribution of CD16 to NK cell-mediated tumor surveillance in tumor models remains unclear, it is known to stimulate antibody-dependent cell-mediated cytotoxicity (ADCC) and target cell killing by NK cells [Citation14]. In patients with myeloid malignancies and leukemia mouse models, disturbances in NK cell maturation have been associated with selective loss of immature NK cell populations [Citation15].
NKT-like cells, also known as cytokine-induced killer (CIK) cells, are a type of immune effector cell that is induced by multiple cytokines. These cells express both T-cell receptors and NK-cell receptors, hence the term NKT-like cells [Citation16]. Pattern recognition receptors play a crucial role in innate immune cells by recognizing cancer-related danger signals and triggering rapid responses. They also contribute to enhancing components of the adaptive immune system [Citation17]. Natural killer T (NKT) cells serve as a link between the innate and adaptive immune systems, playing a key role in immune response activation [Citation18]. These innate T lymphocytes can rapidly respond to antigenic stimuli and produce cytokines and chemokines [Citation19].
Previous studies have shown that patients with high-risk myelodysplastic syndromes (MDS) have an elevated proportion of immature NK cells, likely compensating for functional deficits and poorer NK cell function [Citation20]. However, there are differing views on changes in NK cell numbers in AML patients. Some studies have reported no significant changes in NK cell numbers, while others have observed a lower proportion of circulating NK cells in AML patients compared to healthy individuals [Citation21,Citation22]. In AML patients, the number and proportion of NK cells, as well as the proportion of CD56dimNK cells, were found to be decreased compared to healthy individuals. Conversely, the proportion of CD56highNK cells was relatively increased. This may suggest that NK cell development in AML patients is hindered at the early developmental stage of CD56highNK cells, resulting in a relative decrease in mature NK cells with cytotoxic functions, thereby diminishing the anti-tumor effects of normal NK cells [Citation23]. AML arise from pre-cancerous clone cells originating from damaged genomes of normal hematopoietic stem cells. Next-generation sequencing has greatly improved the precision of AML typing. In this study, different mutation frequencies were observed in AML patients, with FLT3-ITD+/NPM1 + being the most frequent at 12 cases (27.2%), followed by FLT3-ITD + at 6 cases (13.6%), TP53 + at 6 cases (13.6%), and ASXL1 + at 6 cases (13.6%).
Leukaemia cells can achieve immune evasion by down-regulating the expression of self-activating receptor ligands through gene mutations, gene fusions, and epigenetic modifications. Increasing research has confirmed that oncogenic fusion genes such as PML/RARA and AML-ETO, as well as TP53 gene mutations, not only lead to abnormal growth, proliferation, and differentiation of AML cells but also confer immune evasion characteristics. For instance, mutations in the PML-RARA and AML1-ETO fusion genes can result in decreased expression of CD48. CD48 is a ligand for the NK cell activating receptor 2B4. The reduction in CD48 expression leads to a decrease in NK cell-mediated killing.
The correlation between other gene mutations in AML and the proportion of NK cells has also been reported. FLT3 is a cell surface protein that promotes the proliferation and survival of hematopoietic stem/progenitor cells [Citation24]. In AML, acquired functional mutations in the FLT3 receptor are the most common genetic variation [Citation25]. Internal tandem repeat mutations (ITD) occur in the proximal membrane structural domain of FLT3 receptor in approximately 25% of patients, leading to an imbalance in tumor cell growth and survival. This results in constitutive activation of the receptor independent of ligand binding and is associated with poor prognosis [Citation26]. It was found that AML patients with FLT3-ITD mutations exhibited a significant increase in the proportion of NK cells among peripheral blood leukocytes. Furthermore, the number, length, and proportion of FLT3-ITD mutations were significantly and positively correlated with the proportion of NK cells [Citation27].
In our investigation, noteworthy disparities were observed in the proportions of NK and NKT cells among AML patients with FLT3-ITD mutations compared to those with other genetic variations. The proportion of NK cells exhibited a significant elevation in the FLT3-ITD + group relative to the normal control group (23.79 ± 5.21% vs 10.51 ± 2.53%, P = 0.0093). Furthermore, the proportion of NK cells was significantly higher in the FLT3-ITD + group when compared to the FLT3-ITD+/NPM1 + group (23.79 ± 5.21% vs 12.12 ± 3.15%, P = 0.0034). Additionally, the FLT3-ITD + group demonstrated a marked decrease in the proportion of NKT cells in comparison to both the FLT3-ITD+/NPM1 + group (7.37 ± 1.15% vs 12.64 ± 2.73%, P = 0.0215) and the CEBPA + group (7.37 ± 1.15% vs 17.27 ± 1.62%, P = 0.0053). Notably, the proportion of NKT cells in the CEBPA + group was significantly higher than that in the TP53 + group (17.27 ± 1.62% vs 7.67 ± 1.87%, P = 0.0018) and the ASXL1 + group (17.27 ± 1.62% vs 8.62 ± 3.55%, P = 0.006). However, no substantial differences were observed in the distribution of CD16+ NK cells among these aforementioned groups. It is suggested that AML may change the immune surveillance function of NK and NKT cells through gene mutation to achieve the purpose of immune escape.
Furthermore, notable disparities were observed in the distribution of NK and NKT cells across different risk strata within acute myeloid leukemia (AML). The high-risk category exhibited a substantially higher proportion of NK cells compared to the intermediate-risk group (19.66 ± 7.59% vs 12.22 ± 3.41%, P = 0.0026). In contrast, the intermediate-risk group demonstrated a significantly lower proportion of NKT cells compared to the low-risk group (12.14 ± 2.59% vs 16.38 ± 2.30%, P = 0.0019), while the high-risk group experienced a pronounced decrease in NKT cell proportion relative to both the intermediate-risk group (7.71 ± 2.33% vs 12.14 ± 2.59%, P = 0.0002) and the low-risk group (7.71 ± 2.33% vs 16.38 ± 2.30%, P = 0.0001). However, no noteworthy distinctions were noted in the distribution of CD16+ NK cells amongst the various risk stratification cohorts. Predicting that AML may alter the immune surveillance functions of NK and NKT cells through gene mutations to achieve immune evasion. The escape of malignant transformed cells or leukemia cells from the body's immune killing plays a crucial role in the occurrence and development of leukemia. Innate immunity is the first line of defense in the human immune system, playing a vital role in recognizing and clearing tumor cells. Natural killer (NK) cells are the most important component cells of innate immunity, playing a pivotal role in anti-infection and tumor immune surveillance. This study found that the high-risk group means worse innate immune function, and weakened immune function may be one of the reasons for the high-risk development of the disease.
Our study examined the correlation between the proportions of NK and NKT cells at the initial diagnosis and the rate of first induction of remission in AML patients. We observed that the proportion of NK cells was higher in patients who achieved first induction remission, although this difference was not statistically significant. However, the percentage of NKT cells was significantly higher in patients who achieved remission compared to those who did not. We did not find any notable differences in the distribution of CD16+ NK cells between these groups. Furthermore, we found a statistically significant difference in the survival time of AML patients with different proportions of NK cells. However, there was no significant difference in the survival of AML patients with different proportions of NKT cells and CD16+ NK cells. This study suggests that AML can impair the patient's immune system through various mechanisms, including altering the ratios of NK and NKT cells, which may hinder the killing of tumor cells by innate immune cells and ultimately affect prognosis.
The escape of leukemia cells from the body's immune killing is a crucial factor in the development and progression of leukemia. Extensive research has shown that fusion genes or gene mutations not only lead to abnormal growth, proliferation, and differentiation of leukemia cells, but also confer immune evasion characteristics to these cells. Despite the advancements in modern chemotherapy and targeted therapies, which has enabled most AML patients to achieve complete remission, the high recurrence rate remains a significant challenge. Leukemia recurrence after allogeneic hematopoietic stem cell transplantation is the primary cause of death in AML patients. One of the key factors in leukemia recurrence is the immune surveillance escape of leukemia cells. NK cells, which play a vital role in tumor immune surveillance, facilitate the recognition and elimination of tumor cells. AML cells evade NK cell killing through various mechanisms, such as influencing NK cell maturation, altering the expression of NK cell surface receptors, reducing levels of self-activating ligands, increasing levels of immune checkpoint molecules, secreting soluble factors, or affecting other immune cells. Understanding these mechanisms provides a solid foundation for developing new treatment strategies that enhance NK cell recognition and elimination of AML cells. These findings encourage further exploration of leukemia treatment approaches based on NK cells to improve patient prognosis.
Our findings confirm that acute myeloid leukemia(AML) is characterized by a general decrease in natural killer T(NKT) cells but an elevated proportion of natural killer (NK) cells, particularly immature NK cells. Furthermore, we identified differences in the subtypes of NK and NKT cells based on different genetic mutations and risk stratification. Additionally, the downregulation of NKT cell levels was associated with lower rates of first induction remission in AML patients. These observations suggest that both NK and NKT cells could serve as potential therapeutic targets to improve treatment outcomes for AML patients. Targeted interventions aimed at increasing the levels of NK and NKT cells may be beneficial in inhibiting the growth and spread of leukemic cells and could have implications for the treatment of AML. However,it is important to note that this study represents a preliminary attempt, and further research is needed to expand the sample size and gain a more comprehensive understanding of the mechanisms underlying the role of NK and NKT cells in the pathogenesis of AML and their therapeutic prospects.
The limitations of this study: The limitations of this study are acknowledged. We recognize that the small number of cases selected may impact the generalizability of our research. While a larger sample size would improve consistency, reliability, and representativeness, resource limitations and ethical considerations constrained the number of cases. To mitigate potential biases, we ensured high homogeneity in case selection and excluded cases with severe complications or other diseases. Despite these efforts, we acknowledge that the limited number of cases may still affect the generalizability of our research. Future studies can validate our findings by increasing sample sizes, expanding research scope, and adopting multi-center study designs. Collaborating and communicating with other fields will enhance the reliability and generalizability of our study. Although this study provides clinical guidance, validation in larger cohorts is necessary. As a single-center investigation, the conclusions may be influenced by specific medical environments and patient populations. Therefore, it is essential to validate our study results in other medical institutions and patient populations to confirm their generalizability.
Conclusions
The prognostic role of NK and NKT cells in acute myeloid leukemia (AML) is an area of ongoing research. It is increasingly evident that the immune environment plays a vital role in determining the prognosis of AML, and genetic mutations can influence the immune landscape. To develop innovative therapeutic strategies that leverage the immune response and enhance outcomes for AML patients, it is essential to comprehend the intricate interaction between genetic mutations and the immune system. These findings support the potential of NK-cell-based anti-leukemia therapy to enhance patient prognosis by augmenting the immune surveillance and killing capabilities of NK cells.
Author contributions
Conceptualization,ZhongLi Hu;Methodology,ZhongLi Hu;Investigation, ZhongLi Hu; Resources,Yanli Yang and Jiajia Li; Data curation,ZhongLi Hu; Writing – original draft preparation, ZhongLi Hu;Writing – review and editing, ZhongTing Hu; Supervision, ZhongTing Hu.; Project administration, ZhongTing Hu.
All authors have read and agreed to the published version of the manuscript.
Informed consent
This study employs retrospectively collected clinical specimens for research purposes, and seeks exemption from obtaining informed consent.
Patient consent
This study employs retrospectively collected clinical specimens for research purposes, and seeks exemption from obtaining informed consent.
Research involving human participants and/or animals
This study protocol was reviewed and approved by The Bengbu Medical University Ethics Committee, approval number:. [Lunke Approval No. [2023] No. 406].
Data availability
The datasets used and/or analyzed during the current study are available from the corresponding author on reasonable reques.
Disclosure statement
No potential conflict of interest was reported by the author(s).
Additional information
Funding
References
- Dozzo A, Galvin A, Shin JW, et al. Modelling acute myeloid leukemia (AML): what's new? a transition from the classical to the modern. Drug Deliv Transl Res. 2023;13(8):2110–2141. doi:10.1007/s13346-022-01189-4
- Kaplan ZL, Van Leeuwen N, Posthuma EF. Improved relative survival in older patients with acute myeloid leukemia over a 30-year period in The Netherlands: a long haul is needed to change nothing into something. Leukemia. 2022;36(2), doi:10.1038/S41375-021-01503-Y
- Pozanski SM, Ashkar AA. What defines NK cell functional fate: phenotype or Metabolism? Front Immunol. 2019;10:1414, doi:10.3389/fimmu.2019.01414
- Terren I, Orrantia A, Vitalle J, et al. NK cell metabolism and tumor microenvironment. Front Immunol. 2019;10:2278, doi:10.3389/fimmu.2019.02278
- Prabhala R, Pierceall WE, Samur M, et al. Immunomodulation of NK, NKT and B/T cell subtypes in relapsed/refractory multiple myeloma patients treated with pomalidomide along with velcade and dexamethasone and its association with improved progression-free survival. Front Oncol. 2023;13:1271807, doi:10.3389/fonc.2023.1271807
- Heuser-Loy C, Baumgart AK, Hackstein CP, et al. Conditional NKT cell depletion. in mice reveals a negative feedback loop that regulates CTL cross-priming. J Immunol. 2024;212(1):35–42. doi:10.4049/jimmunol.2300662
- Arber DA, Orazi A, Hasserjian R, et al. The 2016 revision to the World Health Organization classification of myeloid neoplasms and acute leukemia. Blood. 2016;127(20):2391–2405. doi:10.1182/blood-2016-03-643544
- Cianga VA, Campos Catafal L, Cianga P, et al. Natural killer cell subpopulations and inhibitory receptor dynamics in myelodysplastic syndromes and acute myeloid leukemia. Front Immunol. 2021;12:665541, doi:10.3389/fimmu.2021.665541
- Cao G, Yue J, Yetian R, et al. Single-cell dissection of cervical cancer reveals key subsets of the tumor immune microenvironment. EMBO J. 2023: e110757, doi:10.15252/embj.2022110757
- Amankulov J, Kaidarova D, Zholdybay Z, et al. Natural killer cell activity level in colorectal cancer screening in an average risk population. Arch Med Sci. 2021;19(6):1747–1752. doi:10.5114/aoms/142101
- Shin E, Bak SH, Park T, et al. Understanding NK cell biology for harnessing NK cell therapies: targeting cancer and beyond. Front Immunol. 2023;14:1192907, doi:10.3389/fimmu.2023.1192907
- Park SH, Bae MH, Park CJ, et al. Effect of changes in lymphocyte subsets at diagnosis in acute myeloid leukemia on prognosis: association with complete remission rates and relapse free survivals. J Hematop. 2023;16(2):73–84. doi:10.1007/s12308-023-00536-9
- Dogra P, Rancan C, Ma W, et al. Tissue Determinants of Human NK Cell Development, Function, and Residence. Cell. 2020;180(4):749–763.e13. doi:10.1016/j.cell.2020.01.022
- Behnaz V, Ali A, Naderali E, et al. Cord blood stem cell derived CD16 + NK cells eradicated acute lymphoblastic leukemia cells using with anti-CD47 antibody. Life Sci. 2020;242(C). doi:10.1016/j.lfs.2019.117223
- Kim S, Choi J. Restoring NK cell functions in AML relapse. Blood. 2022;140(26):2765–2766. doi:10.1182/blood.2022018079
- Bayatipoo H, Mehdizadeh S, Jafarpour R, et al. Role of NKT cells in cancer immunotherapy—from bench to bed. Med Oncol. 2022;40(1). doi:10.1007/S12032-022-01888-5
- Li MO, Wolf N, Raulet DH, et al. Innate immune cells in the tumor microenvironment. Cancer Cell. 2021;39(6), doi:10.1016/J.CCELL.2021.05.016
- Tiwary S, Berzofsky JA, Terabe M. Altered lipid tumor environment and its potential effects on NKT cell function in tumor immunity. Front Immunol. 2019;10:2187, doi:10.3389/fimmu.2019.02187
- Zhou L, Adrianto I, Wang J, et al. Single-Cell RNA-Seq analysis uncovers distinct functional human NKT cell Sub-populations in peripheral blood. Front Cell Dev Bio. 2020: 8, doi:10.3389/fcell.2020.00384
- Arellano-Ballestero H, Sabry M, Lowdell MW. A Killer Disarmed: natural Killer Cell Impairment in Myelodysplastic Syndrome. Cells. 2023;12(4):633, doi:10.3390/cells12040633
- Stringaris K, Sekine T, Khoder A, et al. Leukemia-induced phenotypic and functional defects in natural killer cells predict failuretoachieve remission in acute myeloid leukemia. Haematologica. 2014;99(5):836–847. doi:10.3324/haematol.2013.087536
- Szczepanski MJ, Szajnik M, Welsh A, et al. Interleukin-15 enhances natural killer cell cytotoxicity in patients with acute myeloid leukemia by upregulating the activating NK cell receptors. Cancer Immunol Immun. 2010;59:73–79. doi:10.1007/s00262-009-0724-5
- Costello RT, Sivori S, Marcenaro E, et al. Defective expression and function of natural killer cell-triggering receptors in patients with acute myeloid leukemia. Blood. 2002;99(10):3661–3667. doi:10.1182/blood.V99.10.3661
- Hamidreza Z, Maryam B, Abdullatif A, et al. Potential role of autophagy induced by FLT3-ITD and acid ceramidase in acute myeloid leukemia chemo-resistance: new insights. Cell Commun Signal. 2022;20(1), doi:10.1186/S12964-022-00956-7
- Niparuck P, Limsuwanachot N, Pukiat S, et al. Cytogenetics and FLT3-ITD mutation predict clinical outcomes in non transplant patients with acute myeloid leukemia. Exp Hematol Oncol. 2019;8:3, doi:10.1186/s40164-019-0127-z
- Liu SB, Dong HJ, Bao XB, et al. ImPact of FLT3-ITD length on Prognosis of acute myeloid leukemia. Haematologica. 2019;104(1):e9–e12. doi:10.3324/haematol.2018.191809
- Alexandra J, Ulrike B, Mueller BU, et al. Adverse outcome of AML with aberrant CD16 and CD56 NK cell marker expression. Hematol Oncol. 2018;36(3), doi:10.1002/hon.2516