
ABSTRACT
Objective
Examine Bach1 protein expression in bone marrow biopsy specimens obtained from newly diagnosed multiple myeloma (NDMM) and iron deficiency anemia (IDA) patients. Conduct a thorough analysis to explore the potential connection between Bach1 and the onset as well as treatment response of NDMM.
Methods
This study investigated Bach1 expression in bone marrow biopsy tissues from NDMM and IDA patients. Immunohistochemical staining and Image-pro Plus software were utilized for quantitatively obtaining the expression level of Bach1 protein. Arrange Bach1 expression levels from high to low, and use its median expression level as the threshold. Samples with Bach1 expression level above the median are categorized as the high-expression group, while those below the median are categorized as the low-expression group. Under this grouping, a detailed discussion was conducted to explore relationship of the Bach1 expression level with the patients’ gender, ISS stage, and survival rate based on the Bortezomib (Btz) therapy.
Results
Our experiment indicates that the expression level of Bach1 in NDMM patients is significantly higher than in IDA patients. Furthermore, we discovered that patients in the high-expression group exhibit better prognosis compared to those in the low-expression group after Btz-treatment. Bioinformatics analysis further confirms this conclusion.
Conclusion
By categorizing Bach1 expression level as high and low, our study offers a unique perspective on understanding the relationship between Bach1 and NDMM.
1. Introduction
Multiple myeloma (MM) poses a big challenge in cancer care. It's marked by abnormal growth of plasma cells, causing high levels of monoclonal immunoglobulin and constant stress on the endoplasmic reticulum (ER) due to too much protein secretion [Citation1, Citation2]. Although drugs like bortezomib (Btz) help, resistance and relapse are still major problems [Citation3]. So, it's crucial to understand MM's complex molecular mechanisms and find new treatment targets.
In the intricate landscape of cancer biology, the BACH1 gene, located on chromosome 21q21.3, plays a crucial role as a transcription regulator within the small Maf protein family [Citation4,Citation5]. While recent research has illuminated its significance in various cancers like lung cancer [Citation5,Citation6], its involvement in MM remains less understood. Our study aims to fill this gap by investigating the role of Bach1 protein in MM. Through thorough analysis of Bach1 expression in MM patients’ bone marrow tissues, we seek to uncover its associations with disease stage, clinical features, and overall progression. Additionally, utilizing advanced bioinformatics tools, we explore databases to gain deeper insights into Bach1's relevance in MM pathogenesis.
Amidst the challenges posed by MM, our research pioneers in elucidating its molecular intricacies. Combining clinical analyses with computational methodologies, we endeavor to enhance our understanding of MM biology and pave the way for novel therapeutic strategies and predictive biomarkers.
2. Research object and methods
2.1. Research object
Bone marrow biopsy specimens were collected from newly diagnosed multiple myeloma (NDMM) patients at the Hematology Department of The First Affiliated Hospital of Fujian Medical University between January 2018 and December 2019. The diagnostic criteria adhered to the ‘The Guidelines for the Diagnosis and Management of Multiple Myeloma in China’ (revised in 2020) [Citation7]. Bone marrow biopsies from contemporaneous hospitalized patients diagnosed with iron deficiency anemia (IDA) were used as control samples. The collection of patient clinical data and bone marrow tissue samples was conducted ethically, with approval from the hospital's ethics committee and informed consent obtained from the patients.
2.2. Methods
2.2.1. Clinical data collection
Basic clinical information of patients was collected, including disease staging, age, gender, bone tissue immunohistochemical results, proportion of plasma cells in bone marrow, fluorescence in situ hybridization results, flow cytometry results, and laboratory tests (serum calcium, erythrocyte sedimentation rate (ESR), C-reactive protein (CRP), lactate dehydrogenase (LDH), hemoglobin (HGB), serum creatinine (sCr), beta 2-microglobulin (β2-MG), and glomerular filtration rate (GFR)). Patient’s chemotherapy regimen, response level, and survival time were also recorded. The follow-up continued until December 2021, spanning a total duration of four years.
2.2.2. Immunohistochemistry to detect Bach1 expression
Processing Steps: In this study, bone marrow biopsy specimens were prepared from paraffin-embedded blocks, and thin slices of 3 μm were cut and submitted to immunohistochemistry (IHC) of anti-Bach1 (Cat. No. sc-271211, Santa Cruz Biotechnology, U.S.A.) at 4 °C overnight. Bach1 was detected with goat anti-mouse secondary antibody (1:200; maxim, China) and visualized by diaminobenzidine (DAB). Negative controls contain secondary antibody only. Microscopic observation was performed after counterstaining with Harris hematoxylin (Meilunbio, China) for 30 min. Image-Pro Plus was used to measure the optical density sum of the yellow area.
Result Analysis: For each slide, three different locations were randomly selected, and IHC staining images were captured at 100×, 200×, and 400× magnification. Images taken at 200× magnification were used to calculate the optical density values at the three positions via Image-Pro Plus software. The average density value across the three positions was then defined as the Bach1 density value for that particular slide.
2.2.3. Correlation analysis between Bach1 expression and NDMM patients’ baseline data
GraphPad was utilized for correlation analysis. Spearman correlation coefficients were obtained for Bach1 expression levels. Heat maps were generated to display the correlations of Bach1 expression levels with corresponding factors. We categorized MM patients into high and low expression groups based on their levels of Bach1 expression, with the median Bach1 expression serving as the threshold. Patients with Bach1 expression above the median value are designated as the high-expression group, while those with expression below the median value are designated as the low-expression group. Correlation analysis between high and low expression groups was performed.
2.2.4. Relationship between Bach1 expression level, survival time and Btz-treatment efficacy in NDMM patients
Patients are divided into high and low expression groups based on their expression levels of Bach1. After Btz-treatment, we assessed the therapeutic efficacy according to ‘Chinese Multiple Myeloma Diagnosis and Treatment Guidelines, 2020’ [Citation7]. Subsequently, we tracked the survival outcomes of 29 NDMM patients over the course of four years. Based on whether the patients belonged to the low or high Bach1 expression group, we plotted their survival curves.
2.2.5. Bioinformatics analysis
Considering the limitations of our sample data, we sought to ascertain the general significance of the conclusion that prognosis differs between the high and low Bach1 expression groups following treatment with Btz. Therefore, we conducted bioinformatics analysis based on GSE9782 dataset [Citation8], gathering data from nearly 200 MM patients. These patients were divided into high-expression and low-expression groups based on whether their Bach1 expression exceeded the median value obtained in our experiment. Subsequently, we plotted their survival curves for further analysis.
2.2.6. Statistical methods
SPSS 26.0 and GraphPad Prism 8.0 software were used for statistical analysis. Measurement data were expressed as mean ± standard deviation (`X ± S). T-test and Fisher's test were used for intergroup comparisons. Spearman correlation analysis was performed to enhance the robustness of the results. Statistical significance was defined as p < 0.05.
3. Results
3.1. Basic case information
29 bone marrow histopathological specimens were collected from NDMM patients according to the revised ‘Chinese Multiple Myeloma Diagnosis and Treatment Guidelines’ (revised in 2020) [Citation7]. Among these patients, there were 15 males and 14 females, with a median age of 66 years. The distribution based on ISS stages was 7 cases in Stage I, 10 cases in Stage II, and 12 cases in Stage III. The median follow-up time for these patients was 10.5 months.
8 bone marrow histopathological specimens were collected from IDA patients, excluding the possibility of tumor disease. Among these patients, there were 2 males and 6 females, with a median age of 46 years.
3.2. Bach1 protein expression level in bone marrow of NDMM and IDA patients
Immunohistochemical analysis was conducted on bone marrow tissue slices from 29 NDMM patients and 8 IDA patients. For each slide, three different locations were randomly selected, and IHC staining images were captured at 100×, 200×, and 400× magnification. Images taken at 200× magnification were used to calculate the optical density values at the three positions via Image-Pro Plus software. The average density value across the three positions was then defined as the Bach1 density value for that particular slide. The results revealed that Bach1 protein expression level was significantly higher in NDMM patients in comparison to IDA patients. Specifically, the mean density ( = total density of slices/total number of slices) in NDMM patients was 0.005206 ± 0.004583, whereas in IDA patients, it was 0.002100 ± 0.002122. This difference was statistically significant, with a p-value of 0.0110 as shown in and .
Figure 1. Bath1 is highly expressed in newly diagnosed multiple myeloma (NDMM) patients in comparison to iron deficiency anemia (IDA) patients. (a) Representative image of immunohistochemical staining on Bach1 protein levels in bone marrow samples from IDA (n = 8) and NDMM patients (n = 29) (Scale bar = 100 μm). (b) Mean density (= Total density of slices / Total number of slices) of Bach1 protein of IDA and NDMM patients (p < 0.05).
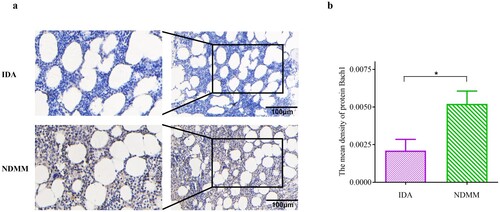
Table 1. Clinical characteristics of patients with NDMM and IDA.
3.3. Correlation between Bach1 expression levels of NDMM patients and clinical indicators
As shown in and , we conducted correlation analysis, initially calculating correlations of Bach1 with most possibly related variables. We found a significant positive correlation between Bach1 density and C-reactive protein (CRP) levels (p < 0.05) as shown in (b and c). Further investigation revealed that some factors, which had no significant correlation with Bach1 expression levels in the entire group, however, were noticeably correlated with high or low Bach1 expression levels. Therefore, we arrange Bach1 expression levels from high to low, and use its median expression level as the threshold. Samples with Bach1 expression level above the median are categorized as the high-expression group, while those below the median are categorized as the low-expression group. Then we analyzed the correlations of variables with Bach1 expression levels in the high or low-expression groups. We found that in high-expression group, Bach1 density is negatively correlated with lactate dehydrogenase (LDH) (r = −0.6321, p < 0.05) and CKS1B (r = −0.7606, p < 0.01) as shown in (d and e). However, in the low-expression group, the Bach1 density showed significant correlations only with age (r = −0.5579, p < 0.05) and Ki-67 percentage (r = −0.6635, p < 0.05) as shown in (g and h).
Figure 2. Correlation analysis of Bach1 expression level with most possibly related variables (n = 29). (a) Correlation of Bach1 with most possibly related variables (n = 29). (b) C-reactive protein (CRP) were positively correlated with Bach1 expression level (p < 0.05). (c) Spearmen correlation analysis showed that CRP were indeed positively correlated with Bach1 expression level (p < 0.01). (d) In the Bach1 high-expression group, lactate dehydrogenase (LDH) and CKS1B were negatively correlated with the Bach1 expression level (p < 0.05). (e) Spearmen correlation analysis showed that CKS1B were indeed negatively correlated with Bach1 expression level (p < 0.01) in high-expression group. (f) Composition of CKS1B had no significant correlation with Bach1expression level in the entire group. (g) In the Bach1 low-expression group, Ki-67 and Age were negatively correlated with the Bach1 expression level (p < 0.05). (h) Spearmen correlation analysis showed that Ki-67 were indeed negatively correlated with Bach1 expression level (p < 0.01) in low-expression group. (i) Ki-67 had no significant correlation with Bach1expression level in the entire group.
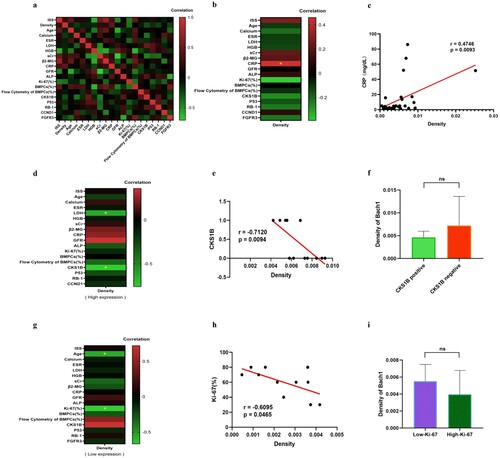
Table 2. Comparison of clinical features in NDMM patients with high/low Bach1 expression.
This finding strongly indicates that when assessing the relationship between the Bach1 and related variables, the high or low expression levels of Bach1 may indeed serve as a crucial indicator. To validate our findings, we selected respectively one related variable from both the high-expression (CKS1B) and low-expression (Ki-67) groups, then recalculated the correlation of its composition with Bach1 expression level within entire groups. As shown in (f and i), results showed no significant correlation, indicating that these variables are indeed only correlated with the grouping based on Bach1 expression levels.
3.4. Comprehensive analysis of NDMM patients’ clinical data
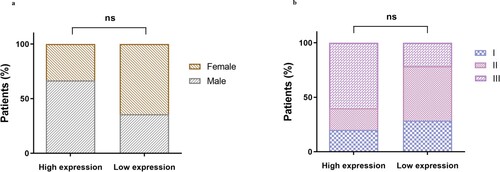
As shown in , gender and International Staging System (ISS) stage seem to be associated with Bach1 expression levels. The reason for not conducting correlation analysis in is that gender and ISS are compositional variables, allowing only compositional correlation analysis. Hence, we conducted compositional correlation analysis to rule out their correlation. Results are shown in .
Figure 3. Correlation analysis of Bach1 expression levels with gender and ISS (n = 29).
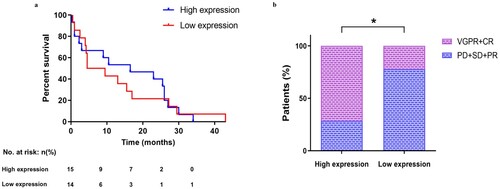
After tracking 29 patients continuously for four years, we plotted the survival curve for these patients in (a). From the (a), we found that the median survival time for patients in the high Bach1 expression group was 16.5 months, while for those in the low Bach1 expression group, it was only 7 months. Unfortunately, there was no significant difference in survival probability between patients with high and low Bach1 expression levels. This is likely due to not all patients undergoing Btz treatment. To further investigate the relationship between Btz treatment efficacy and Bach1 expression levels, we tracked 16 MM patients who received Btz treatment (7 with high Bach1 expression and 9 with low expression), assessing their recovery according to the ‘Chinese Multiple Myeloma Diagnosis and Treatment Guidelines’. We grouped complete remission (CR) and very good partial remission (VGPR) together and partial remission (PR), stable disease (SD), and progressive disease (PD) together. Correlation analysis revealed that patients in the high Bach1 expression group had significantly better treatment outcomes (CR + VGPR) compared to those in the low Bach1 expression group. This finding suggests that patients in the high Bach1 expression group have a higher median survival time, possibly due to better treatment outcomes from Btz.
Figure 4. Relationship between Bach1 expression, survival, and the efficacy of Btz treatment. (a). Survival curve of NDMM patients in the high-expression and low-expression Bach1 groups (n = 29, p = 0.695). (b). The therapeutic efficacy of Btz in 16 patients with varying levels of Bach1 (n = 16, p < 0.05).
3.5. Bioinformatics analysis and signaling pathways
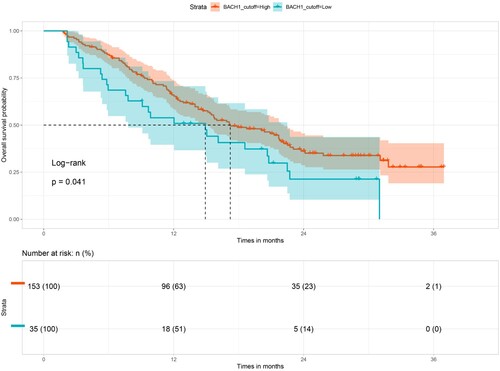
To further validate the idea that patients with high Bach1 expression levels will exhibit better survival probability, we employed bioinformatics analysis techniques to extract data on Bach1 expression levels and survival time from 188 MM patients in the GSE9782 database from Mulligan [Citation8]. Patients were divided into high and low expression groups based on their Bach1 expression levels, with the threshold set at the median Bach1 level observed in our experiment. Patients with Bach1 expression levels above this threshold were categorized as the high expression group, while those below it were categorized as the low expression group. As shown in the , overall survival probability of NDMM patients with high Bach1 expression after Btz treatment was higher than that of patients with low Bach1 expression (p < 0.05). This discovery once again demonstrates that high expression of Bach1 indeed contributes to enhancing the therapeutic efficacy of Btz.
Figure 5. Survival curve of Btz-treatment patients with high and low Bach1 expression level.
4. Discussion
Multiple Myeloma (MM) is a malignancy arising from plasma cells in the bone marrow, characterized by the overproduction of abnormal monoclonal immunoglobulins [Citation1–3]. Treatment typically involves a combination of chemotherapy, immunomodulatory drugs, corticosteroids, and targeted therapies. One such targeted therapy is Bortezomib (Btz), a proteasome inhibitor that disrupts protein degradation in cancer cells, leading to cell death [Citation9–12]. However, a significant challenge in MM treatment is the development of resistance to Btz, limiting its effectiveness [Citation2]. Resistance mechanism still remains elusive. Understanding this mechanism is helpful for developing new treatment strategies. Bach1,a transcriptional regulator, plays a important role in various cancers [Citation13–15], especially in MM [Citation16–19]. The correlation between Bach1 expression levels and the progression of MM as well as its association with the efficacy of Btz treatment is the focal point of our investigation.
We first investigated the difference in Bach1 expression levels between MM and IDA patients. The reason why we chose IDA patients as a control group was based on the following facts. IDA is a common hematological disorder, whose pathogenesis and treatment methods have been extensively studied and understood. Therefore, it can provide a reliable reference when used as a control group, clearly distinguishing it from the NDMM. Additionally, bone marrow samples from patients with IDA are easier to obtain because patients would opt for a bone marrow biopsy to determine the cause of their anemia; whereas healthy individuals without any blood abnormalities typically would not choose to undergo this test, making sample collection difficult.
Our study found Bach1 expression levels were higher in NDMM patients than in in IDA patients, which indicated that Bach1 can serve as a biomarker for identifying MM. Further investigation showed that Bach1 expression levels were positively correlated with C-reactive protein (CRP), suggested a potential link between Bach1 and inflammation or bone lesion in MM. This finding is consistent with previous research, which had demonstrated that Bach1 may be involved in the process of injury via elevating inflammatory markers [Citation12]. The exact mechanism of this correlation in MM remains unclear and needs further investigation.
Correlation analysis showed that Bach1 expression levels had a negative correlation with CKS1B in high-expression group and with Ki-67 percentage in low-expression group. Considering CKS1B and Ki-67 are important prognostic markers in MM, these negative correlations implied that Bach1 might impedes MM prognosis, regardless of whether it's in the high-expression or low-expression group. However, in these two groups, Bach1 may operate through different pathways. Detailed pathway analysis will carry out in future studies.
Through a four-year follow-up, we obtained survival data for 29 MM patients. We found that after Btz treatment, patients with high Bach1 expression had a significantly longer median survival time compared to those with low Bach1 expression. Bioinformatics analysis confirmed that high Bach1 expression was associated with better overall survival in NDMM patients after treated with Btz. Evaluation of Btz treatment efficacy revealed better prognosis among patients in the high Bach1 expression group. This disparity in Btz treatment outcomes may be attributed to the association between Btz resistance and Bach1 expression levels. Further experiments are required to validate this hypothesis.
5. Conclusion
Our study investigated the expression levels of Bach1 in bone marrow biopsy specimens from NDMM patients and IDA patients, aiming to uncover its potential implications in disease onset and treatment response. Our findings revealed significantly higher Bach1 expression levels in NDMM patients compared to IDA patients, suggesting Bach1 as a potential biomarker for MM identification. Furthermore, Bach1 expression showed a positive correlation with CRP, indicating a potential association with inflammation in MM. Notably, Bach1 expression levels exhibited negative correlations with CKS1B and Ki-67, important prognostic markers in MM, in high-expression and low-expression groups, respectively, suggesting its impact on MM prognosis through distinct pathways. Importantly, our study demonstrated that patients with high Bach1 expression had better survival outcomes following Btz treatment, as evidenced by longer median survival times and confirmed by bioinformatics analysis. This suggests a potential role for Bach1 in predicting treatment response and warrants further investigation into its association with Btz resistance. Overall, our study provides valuable insights into the significance of Bach1 in MM and sets the stage for future research in this area.
Disclosure statement
No potential conflict of interest was reported by the author(s).
Additional information
Funding
Reference
- Kubicki T, Gil L, Dytfeld D. Endoplasmic reticulum stress and proteasome inhibitors in multiple myeloma: room for improvement. Pol Arch Intern Med. 2021;131:361–368.
- Wang G, Fan F, Sun C, et al. Looking into endoplasmic reticulum stress: the Key to drug-resistance of multiple myeloma? Cancers (Basel). 2022;14(21):5340–5360. doi:10.3390/cancers14215340
- Bhatt P, Kloock C, Comenzo R. Relapsed/refractory multiple myeloma: a review of available therapies and clinical scenarios encountered in myeloma relapse. Curr Oncol. 2023;30(2):2322–2347. doi:10.3390/curroncol30020179
- Padilla J, Lee J. A novel therapeutic target, BACH1, regulates cancer metabolism. Cells. 2021;10(3):634–647. doi:10.3390/cells10030634
- Wiel C, Le Gal K, Ibrahim MX, et al. BACH1 stabilization by antioxidants stimulates lung cancer metastasis. Cell. 2019;178(2):330–345.e22. doi:10.1016/j.cell.2019.06.005
- Lignitto L, LeBoeuf SE, Homer H, et al. Nrf2 activation promotes lung cancer metastasis by inhibiting the degradation of Bach1. Cell. 2019;178(2):316–329.e18. doi:10.1016/j.cell.2019.06.003
- Chinese Hematology Association, Chinese Myeloma Committee-Chinese Hematology Association. The guidelines for the diagnosis and management of multiple myeloma in China (2020 revision). Chin J Intern Med. 2020;59(5):341–346.
- Mulligan G, Mitsiades C, Bryant B, et al. Gene expression profiling and correlation with outcome in clinical trials of the proteasome inhibitor bortezomib. Blood. 2007;109:3177–3188. doi:10.1182/blood-2006-09-044974
- Orlowski R, Stinchcombe T, Thomas E, et al. Phase I Trial of the Proteasome Inhibitor PS-341 in Patients with Refractory Hematologic Malignancies. J Clin Oncol. 2002;20(1):4420–4427. doi:10.1200/JCO.2002.01.133
- Field-Smith A, Morgan GJ, Davies FE Bortezomib (Velcadetrade mark) in the Treatment of Multiple Myeloma. Ther Clin Risk Manag. 2006;Sep2(3):271–9. doi:10.2147/tcrm.2006.2.3.271
- Richardson PG, Barlogie B, Berenson J, et al. Extended follow-up of a phase II trial in relapsed, refractory multiple myeloma: final time-to-event results from the SUMMIT trial. Cancer. 2006;Mar 15; 106(6):1316–1319. doi:10.1002/cncr.21740
- Bhatnagar V, Gormley, Luo L, et al FDA Approval Summary: Daratumumab for Treatment of Multiple Myeloma After One Prior Therapy. The Oncologist. 2017;22(11):1347–1353.
- Dimopoulos M A, Moreau P., Palumbo A, et al. Carfilzomib and dexamethasone versus bortezomib and dexamethasone for patients with relapsed or refractory multiple myeloma (ENDEAVOR): a randomised, phase 3, open-label, multicentre study. The Lancet Oncology. 2016;17(1):27–38. doi:10.1016/S1470-2045(15)00464-7
- Wallington-Beddoe C T, Mynott R L Prognostic and predictive biomarker developments in multiple myeloma. Journal of hematology & oncology. 2021;14:1–15. doi:10.1186/s13045-021-01162-7
- Lee J, Yesilkanal A E, Wynne J P., et al Effective breast cancer combination therapy targeting BACH1 and mitochondrial metabolism. Nature. 2019;568(7751):254–258. doi:10.1038/s41586-019-1005-x
- Liu Z, Wang J, Chen H, et al. Uncovering BTB and CNC homology1 (BACH1) as a novel cancer therapeutic target. Frontiers in Genetics. 2022;13:920911–920921. doi:10.3389/fgene.2022.920911
- Hu D, Zhang Z, , Luo X, et al. Transcription factor BACH1 in cancer: roles, mechanisms, and prospects for targeted therapy. Biomarker Research. 2024;12(1):21–44. doi:10.1186/s40364-024-00570-4
- Sato M, Matsumoto M, Saiki Y, et al. BACH1 promotes pancreatic cancer metastasis by repressing epithelial genes and enhancing epithelial–mesenchymal transition. CliCancer Research. 2020;80:1279–1292. doi:10.1158/0008-5472
- Davudian S, Mansoori B, Shajari N, et al. BACH1, the master regulator gene: A novel candidate target for cancer therapy. Gene. 2016;588:30–37. doi:10.1016/j.gene.2016.04.040