
 ?Mathematical formulae have been encoded as MathML and are displayed in this HTML version using MathJax in order to improve their display. Uncheck the box to turn MathJax off. This feature requires Javascript. Click on a formula to zoom.
Abstract
Purpose: We focus on a fuzzy-weighted approach to the robustness analysis based on experts' opinions for selecting a reasonable strategy in a special decision-making problem.
Design/methodology/approach: We deal with environmental uncertainty by reviewing performance of the strategies among the alternative futures, to answer some complexities of the strategy selection problem by considering the desired number of scenarios, indicators and options as well as collecting experts' judgments in an appropriate time. Weights of the indicators determining the situations of future scenarios are considered as triangular fuzzy numbers. Also, we use the well-known Dolan-Moré performance profile in order to more precisely investigate the strategies situations, especially when their robustness levels are close to each other.
Findings: According to the results, concerning environmental situations as well as the possible future of the automotive industry of Iran, the defensive strategy is a robust decision. Among the sub-strategies related to the main strategy defensive, retrenchment and divestiture strategies have a higher robustness level.
Originality/value: Using matrix modeling, it is possible to overcome some of the weaknesses of the classical robustness analysis related to reviewing few scenarios, indicators and options as well as the time-consuming process of collecting the experts' opinions.
1. Introduction
Decision-making can be considered as one of the most important skills needed for the managers. Nowadays, organisations operate in a very complex and dynamic environment which makes some difficulties in the process of decision-making; particularly, in strategy selection. Increasing uncertainty [Citation1], existence of many options and lack of quantitative data on future outcomes [Citation2], unqualified or inadequate input information [Citation3], the need to use stakeholders’ opinions in strategic decisions [Citation4] as well as fuzziness and vagueness of most of the problems [Citation5] are some of the complexities that managers may encounter in the decision-making process. Hence, designing a model to be able to answer such complexities has attracted especial attentions.
The popular models which have been studied in the decision-making literature for selecting the desired option can be reviewed in four main categories: (1) classical models and tools in the field of strategic planning such as QSPM and SWOT [Citation6–9]; (2) scenario planning models [Citation10–13]; (3) multi-criteria decision-making models [Citation14–17]; and (4) robustness analysis (RA) models [Citation18–21]. Considering the previously mentioned challenges as the criteria for evaluating the effectiveness of different models, we can present a more reasonable model in the decision-making process to select the desired option.
Models of the first category do not have the possibility of considering future uncertainty, because they generally use the current or the past information. Also, since the future most likely will be something different from what we have planned, using such models can lead to contradictory results [Citation22]. Models of the second category are not able to consider a large number of options due to the lack of quantitative data about future outcomes. In these models, four scenarios are adopted because of human capacity constraints [Citation23]. In cases where multiple variables can make large changes in the future environment, the constraints of future scenarios are considered as a major weakness. Moreover, in spite of combining quantitative and qualitative criteria as well as concerning the opinions of several decision-makers, models of the third category may face some difficulties in dealing with uncertainty and qualitative data on future outcomes. It is worth noting that the most important feature of the models of the fourth category is dealing with the uncertainty in the future outcomes obtained by the decision-making process [Citation24]. In the RA models, a decision is made which leads to more reasonable and less adverse outcomes among different futures [Citation25]. This approach is generally collaborative and flexible, and it provides the possibility of considering the opinions of different participants. Also, it is easier and more comprehensible for the users in contrast to the other approaches [Citation24]. Among the models mentioned above, only the RA models can answer the uncertainty that makes some difficulties in the organisation. However, this approach has always been faced with some weaknesses in selecting the strategy due to the inability of dealing with a lot of options (scenarios or indicators) and the fuzziness of decisions in real world applications [Citation26].
Here, a matrix-based fuzzy-weighted approach for the strategy selection problem is presented which provides the possibility of dealing with a desired number of options, scenarios, and criteria in an ideal time. The proposed model is also able to specify the importance of each criterion determining future situations as verbal expressions in the form of pairwise comparison matrix from the decision-makers and it also considers fuzzy weights in analyzing the performance of different strategies. This study is organised in the following arrangements. Some definitions and concepts of fuzzy numbers [Citation27,Citation28] are presented in Section 2. In Section 3, the model is described in detail. In Section 4, our approach is applied to a real world problem in the automotive industry of Iran. Also, we discuss how the Dolan-Moré performance profile [Citation29] can be helpful to determine the right strategy, especially when the robustness levels of some of the strategies are close to each other. Finally, conclusions are drawn in Section 5.
2. An Introduction to Fuzzy Numbers
Fuzzy decision-making is a powerful paradigm for dealing with human expert knowledge and considering the imprecision in assessing the relative importance of the attributes. Imprecisions may arise from a variety of reasons such as unquantifiable, incomplete or unobtainable information and partial ignorance. Conventional decision-making methods cannot effectively handle problems with such imprecise information. The fuzzy set theory attempts to select, prioritise or rank a finite number of courses of actions by evaluating a group of predetermined criteria [Citation3].
Here, we briefly review the fundamental notions of fuzzy set theory, initiated by Bellman and Zadeh [Citation30], to be used throughout this study (see also [Citation31,Citation32]). Below, we give definitions and notations taken from Bezdek [Citation33], and Ghanbari and Mahdavi-Amiri [Citation34,Citation35].
Definition 2.1:
Let be the universal set.
is called a fuzzy set in
if
is a set of ordered pairs, i.e.
where
is the membership function of
in
.
The membership function of specifies the degree of membership of the element
in the fuzzy set
; in fact,
clarifies the belonging degree of
to the set
.
Definition 2.2:
The support of a fuzzy set is the set of elements of
for which
is positive, that is,
Definition 2.3:
A fuzzy number is an LR-type number if there exists a shape function
(for left), a shape function
(for right) and the scalars
≥0 and
≥0 with the following membership function:
The real number
is called the mean value of
Also, the scalars
and
are called the left and the right spreads, respectively. The fuzzy number
is denoted by
. Also, a crisp number
can be specified as
. If the shape functions
and
are linear and
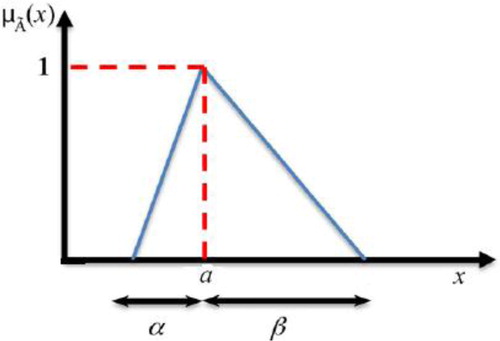
is continuous, then the corresponding fuzzy number is called triangular. Figure shows a general triangular fuzzy number. Here,
denotes the set of all the triangular fuzzy numbers.
Figure 1. A general triangular fuzzy number .
Definition 2.4:
For the triangular fuzzy numbers and
, we define:
A convenient method for solving fuzzy optimisation problems is based on the concept of comparison of the fuzzy numbers by use of the ranking functions [Citation36–39]. In fact, an effective approach for ordering the elements of
is to define a ranking function
which maps each fuzzy number into the real line where a natural order exists. For the mentioned ranking function we should have
where
and
are two arbitrary members of
. Also, we write
if and only if
. The following lemma is now immediate.
Lemma 2.1.
Citation38
Let be any linear ranking function. Then,
if and only if
If
Now, we restrict our attention to the linear ranking functions; that is, a ranking function such that
for any
and
in
and any
. Here, we employ the popular linear ranking function firstly proposed by Garcia and Verdegay [Citation36] based on an integration scheme, and then adopted by Mahdavi-Amiri et al. [Citation27,Citation28,Citation37], which for an arbitrary triangular fuzzy number
is simplified as follows:
(1)
(1)
Hence, for the triangular fuzzy numbers and
, we have
(2)
(2)
3. A Fuzzy-Weighted Matrix Model for the Robustness Analysis
Here, we describe a matrix-based model to be used by RA in the strategy selection. To start the formulation process, firstly we need to identify the strategies. In this context, the main strategies are specified as a result of choosing a certain number of predefined sub-strategies
Here, the dependence relationships are illustrated as follows:
(3)
(3)
showing that the main strategy MSi is a hybridisation of the sub-strategies
The second step is to define the future scenarios. As known, common external factors in the strategic literature include the political, economic, social, technological, environmental and legal factors (PESTEL) [Citation40]. Here, the scenarios are defined based on probable situations of the mentioned six factors as ordered in the 6-tuples
General form of the components of a scenario is presented in Table . Furthermore, the scenarios matrix M which is of the order 6×q can be defined by setting the 6-tuples Sni as its ith column. More precisely,
(4)
(4)
Table 1. The general form of the scenario components.
In the third stage, the importance of each indicator in Table is specified using the pairwise comparison matrix. For this purpose, experts express their verbal judgments based on Saaty’s scale [Citation41]. In practice, it is better for experts to describe the parameters of the problem using fuzzy data because of existing ambiguities [Citation42]. Thus, verbal judgments turned into triangular fuzzy numbers using Table [Citation3] and then, fuzzy weights were obtained [Citation43].
Table 2. Fuzzy comparison measures.
Now, we need to determine strategies favourability and non-favourability conditions. In this context, for the strategy Sj two-ordered 6-tuples Sj+ and are defined to respectively refer to its favourability and non-favourability conditions. The elements of the two vectors contain some of the states of the indicators displayed in Table , determined according to the employer’s considerations. Afterwards, the strategy conditions matrix A of the order 6 × 2 m can be defined as follows:
(5)
(5)
Table 3. Indicators affecting the problem and their different states.
Here, based on the available data, we are in a position to define the robustness-debility matrix which is denoted by B, consisting of m rows and q columns where each row corresponds to a sub-strategy and each column corresponds to a scenario
In order to specify the element (j,i) of B, the ordered 6-tuple Sni should be compared with the ordered 6-tuples Sj+ and
. For each compliance of Sni and Sj+, a positive score being equal to the corresponding fuzzy weight is assigned while for each compliance of Sni and
a negative score being equal to the symmetry of the corresponding fuzzy weight is considered. The element Bji of the matrix B is the sum of the mentioned fuzzy numbers. According to the triangular fuzzy weights of the third stage, we have:
in which
,
and
are real
matrices. Now, calculating the rank of the elements of the fuzzy matrix
based on (1), the elements of B are available. More precisely,
(6)
(6)
Next, according to the classical Rosenhead’s approach [Citation25], two m-tuple vectors R and F are defined to respectively contain robustness and debility of the sub-strategies. The jth component of R (i.e. Rj) represents the ratio of the number of positive elements of the jth row of B to q (total number of the elements of the jth row) and the jth component of F (i.e. Fj) refers to the ratio of the number of negative elements of the jth row of B to q. Finally, for each main strategy MSi, the robustness level is defined as the sum of the elements of R corresponding to the related sub-strategies and also, the debility level is given by summing the elements of F corresponding to the related sub-strategies. The best main strategy is determined by comparing the obtained robustness and debility levels. In the case where the robustness and debility levels are close to each other which makes it hard to ascertain the right strategy, here the performance profile introduced by Dolan and Moré [Citation29] is appropriately employed.
4. A Real Word Problem Study
Our real world study is devoted to the automotive industry of Iran. It is worth noting that after the oil industry, the automotive industry is the second most active industry in the country which has faced a variety of challenges in recent years. Hence, the industry needs to review its strategies to ensure its survival in the future. We should note that decision-makers participating in this case study were selected among the strategic planning experts of the automotive industry. Also, it should be mentioned that here we used the MATLAB software to perform computations of our model, being a popular tool for matrix computations.
At the first stage, the grand strategy matrix proposed by David [Citation44] was applied in order to define the strategies and their sequences. Hence, the main strategies were classified into the four groups of offensive (MS1), competitive (MS2), defensive (MS3) and conservative (MS4). Each of the main strategies consists of a number of sub-strategies demonstrated based on the equation (3) as follows:
(7)
(7)
(8)
(8)
(9)
(9)
(10)
(10)
in which the sub-strategies are classified as the vertical integration (S1), the horizontal integration (S2), the concentric diversification (S3), the horizontal diversification (S4), the conglomerate diversification (S5), the joint venture (S6), the retrenchment (S7), the divestiture (S8), the market development (S9), the market penetration (S10) and the product development (S11). Note that among the sub-strategies of [Citation44] the liquidation strategy was eliminated because the industry does not intend to end its activities.
In order to design future scenarios, experts identified the most important indicators relevant to the PESTEL, taking into account Iran’s especial circumstances, and then specified their various states as shown in Table . Among all the possible scenarios, the following 15 cases were considered as columns of the matrix M:
The first column in matrix M, for example, shows a scenario in which JCPOA is continuing, economic growth is positive, the potential of market size is improving and so on.
The collective estimates of the experts’ judgments for specifying the fuzzy weights of the indicators have been considered in the form of a fuzzy pairwise comparison matrix, as shown in Table . According to the Gogus-Boucher method [Citation45], the consistency ratio of the pairwise comparison matrix for the main number and the mean of L and R numbers are respectively equal to 0.03 and 0.05. This ratio should be less than 0.10 [Citation41]. The fuzzy weights obtained by the pairwise comparison matrix are shown in Table .
Table 4. Fuzzy pairwise comparison.
Table 5. Fuzzy weights of the criteria.
In the next step, the strategic condition matrix A indicating favourability or non-favourability conditions of each strategy was determined by the experts as follows:
According to the first two columns in matrix A, for example, the vertical integration (S1) is specifically affected with economic growth (1 for positive effect and two for negative), the potential of market size (1 for positive and 3 for negative) and technology development (3 for positive and 2 for negative).
Following, the matrices M and A are compared to obtain the fuzzy matrix by concerning the fuzzy weights of Table , containing robustness and debility scores of each strategy in different scenarios. So, we get
and
Hence, using the linear ranking function (1), since , we obtain
Now, using the data presented in the matrix B, the Rosenhead’s classical scheme [Citation25] for calculating robustness and debility of the strategies leads to the vectors R and F as follows:
Finally, according to the relations (7)–(10), the strategies robustness and debility levels are depicted in Table and Figure .
Figure 2. Comparing robustness and debility of the main strategies.
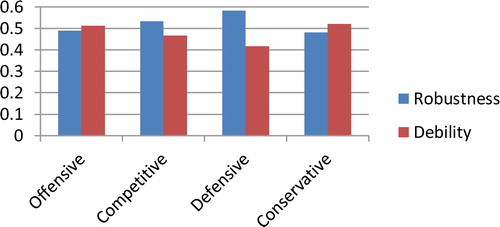
Table 6. Robustness and debility scores of the main strategies.
Figure shows that the conservative and offensive strategies are in undesired levels. Also, it can be seen that the defensive strategy is preferable to the competitive strategy. To more exactly investigate the strategy ranking, here we also employ the well-known Dolan-Moré performance profile [Citation29]. In recent years, performance profiles have become a popular and widely used tool for benchmarking and evaluating the performance of several solvers when running on a large test set [Citation46]. Performance profile gives, for every the proportion
of the cases that each main strategy has performance within a factor of
of the best. To proceed, since in our model a strategy with the maximum robustness is desirable while in the Dolan-Moré performance profile the minimum value of the outputs is preferable, at first we need to make a decreasing transformation on the matrix
Here, we use an exponential function and define the matrix
as follows:
with
Next, we define a matrix D, here called the resultant matrix, with
rows and
columns, in which each row corresponds to a main strategy
and each column corresponds to a scenario
The ith row of D is the sum of those rows of the matrix
corresponding to the sub-strategies that comprise the main strategy MSi in the sense of (3). Hence, we obtain
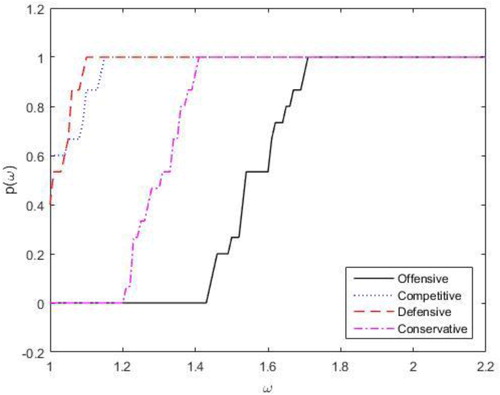
Now, we can compare the rows of D using the Dolan-Moré performance profile to find the most desirable main strategy. Figure shows the results of comparisons. As seen, the defensive strategy turns out to be more desirable in contrast to the other strategies.
Figure 3. Dolan-Moré performance profile for the main strategies.
5. Conclusion
In real applications, most things that seem to be right are actually ‘fairly’ right in the sense that there is always some degrees of uncertainty about the authenticity of the phenomena. In all the organisational areas, the decision-making situations and the data are unclear and vagueness. Reviewing such data requires a specific logic and analysis that is nowadays known as the theory of fuzzy systems or Fuzzy Logic. The theory of fuzzy systems can enter parameters such as knowledge, experience, and judgment into a real decision-making model, and can provide a flexible system for natural language. Hence, it is normal and realistic to allow the decision-makers to provide their judgments in the form of fuzzy concepts due to existing complexities and uncertainties in the real world problems [Citation47]. Note that these judgments are simpler than precise judgments [Citation48].
In this study, a matrix approach to a fuzzy-weighted robustness analysis based on the experts’ opinions has been introduced for selecting a reasonable strategy. This approach deals with environmental uncertainty by reviewing the performance of the strategies among the alternative futures and selecting the most reasonable strategy. In addition, considering the desired number of scenarios, indicators, and options as well as collecting experts’ judgments in an appropriate time is possible in the model, being answers to some complexities of the strategy selection problem. The weights of the indicators determining the situations of future scenarios in the robustness analysis have been also considered as triangular fuzzy numbers. This has two important advantages: vagueness situations of the decision-making problem are taken into account, and the desired or undesirable levels of all the final strategies in each scenario are specified appropriately, despite the classical approach of robustness analysis in which the situation of most of the decisions remains uncertain. Meanwhile, an approach based on the Dolan-Moré performance profile has been considered in robustness analysis that can be useful when robustness and debility levels of the strategies are closed to each other and consequently, it is hard to select the most reasonable strategy. Finally, the approach has been implemented in a real world problem in the automotive industry of Iran. According to the results, concerning environmental situations as well as the possible future of the automotive industry of Iran, the defensive strategy is a robust decision. Among the sub-strategies related to the main strategy defensive, retrenchment and divestiture strategies have a higher robustness level.
Acknowledgements
This research was supported by Research Council of Semnan University. The authors thank the anonymous referee for his/her valuable comments and suggestions helped to improve the quality of this work.
Disclosure statement
No potential conflict of interest was reported by the author(s).
Additional information
Funding
Notes on contributors

Ali Sorourkhah
Ali Sorourkhah is an Assistant Professor in Management Department, Rahman Institute of Higher Education, Ramsar, Iran. He is the head of the education committee of Iranian scientific marketing association (Mazandaran Branch). His research interests include multi-criteria decision-making approaches, robustness analysis and some other soft OR methods.

Saman Babaie-Kafaki
Saman Babaie-Kafaki is a Professor of Department of Mathematics of Semnan University, Semnan, Iran. He received his B.Sc. in Applied Mathematics from Mazandaran University, Iran, in 2003, and his M.Sc. and Ph.D. in Applied Mathematics from Sharif University of Technology, Iran, in 2005 and 2010, respectively. His research interests lie within numerical continuous optimisation, numerical linear algebra and heuristic algorithms.

Adel Azar
Adel Azar is a Professor of Faculty of Management & Economics of Tarbiat Modarres University, Tehran, Iran. He has received 13 prestigious academic awards, one of the most prominent of which is the second highest ranking Iranian government medal in research and also national exemplary professor award in 2017. He has already published 83 scientific articles in foreign accredited journals and 300 scientific articles published in credible international journals such as Fuzzy Sets & Systems, Expert Systems with Applications, Cleaner Production and … as author or co-author, and 78 articles have been presented at national and international conferences. His research interests include: Fuzzy Management Science, Managerial and Economic Systems Modeling, Performance Management, Performance Based Budgeting.

Mohsen Shafiei Nikabadi
Mohsen Shafiei Nikabadi is an Associate Professor of Industrial Management Department, Semnan University, Semnan, Iran. He has been involved in multiple disciplinary researches in the areas of New Product Development Strategies and Knowledge-based Systems for improving Supply chain performance.
References
- Engau C, Hoffmann VH. Strategizing in an unpredictable climate: exploring corporate strategies to cope with regulatory uncertainty. Long Range Plann. 2011;44:42–63.
- Wong HY. Using robustness analysis to structure online marketing and communication problems. J Oper Res Soc. 2007;58:633–644.
- Gumus AT. Evaluation of hazardous waste transportation firms by using a two-step fuzzy-AHP and TOPSIS methodology. Expert Syst Appl. 2009;36:4067–4074.
- Namen AA, Bornstein CT, Rosenhead J. The use of robustness analysis for planning actions in a poor Brazilian community. Pesq Oper. 2010;30:267–280.
- Yu CS. A GP-AHP method for solving group decision-making fuzzy AHP problems. Comp Opert Res. 2002;29:1969–2001.
- Hashemi N, Ghaffary G. A proposed sustainable rural development index (SRDI): lessons from Hajij village. Iran Tour Manag. 2017;59:130–138.
- Walukow MI, Pangemanan SA. Developing a competitive strategic model using quantitative strategic planning matrix (QSPM) approach for handicrafts ceramic industry in Pulutan, Minahasa Regency. Proc Soc Behav Sci. 2015;211:688–695.
- Parraga CN, Gonzalez CN, Soler FF. DELPHI-SWOT tools used in strategic planning of the port of Manta. Proc Soc Behav Sci. 2014;162:129–138.
- Wang XP, Zhang J, Yang T. Hybrid SWOT approach for strategic planning and formulation in China worldwide express mail service. J Appl Res Technol. 2014;12:230–238.
- Postma TJBM, Liebl F. How to improve scenario analysis as a strategic management tool? Technol Forecast Soc Change. 2005;72:161–173.
- Cook CN, Inayatollah S, Burgman MA, et al. Strategic foresight: how planning for the unpredictable can improve environmental decision-making? Trends Ecol Evol. 2014;29(9):531–541.
- Cheng MN, Wong JWK, Cheung CF, et al. A scenario-based road-mapping method for strategic planning and forecasting: a case study in a testing, inspection, and certification company. Technol Forecast Soc Change. 2016;111:44–62.
- Greiner R, Puig J, Huchery C, et al. Scenario modeling to support industry strategic planning and decision-making. Environ Model Softw. 2014;55:120–131.
- Mukherjee S. Selection of alternative fuels for sustainable urban transportation under multi-criteria intuitionistic fuzzy environment. Fuzzy Inf Eng. 2017;9:117–135.
- Rao CJ, Liu JE, Dong JH, et al. Hybrid multi-attribute decision-making method of electric coal procurement in industry. Fuzzy Inf Eng. 2014;6:451–462.
- Somasundaram R, Krishnamoorthy V. Selection of strategy using multi-objective multi-criteria decision model in the SSI unit. Int Res J Bus Manag. 2014;1:10–18.
- Chang PL, Chen YC. A fuzzy multi-criteria decision-making method for technology transfer strategy selection in biotechnology. Fuzzy Sets Syst. 1994;63:131–139.
- Azar A, Sorourkhah A. Designing a model for three-dimensional robustness analysis: a case study of Iran Khodro Machin tools industries company. Ind J Sci Technol. 2015;8:1–5.
- Driouchi T, Leseure M, Bennett D. A robustness framework for monitoring real options under uncertainty. Omega. 2009;37(3):698–710.
- Eustace D, Russell ER, Landman ED. Application of robustness analysis for developing a procedure for better urban transportation planning decisions. J Transp Res Forum. 2003;57:107–121.
- Wong HY, Rosenhead J. A rigorous definition of robustness analysis. J Oper Res Soc. 2000;51:176–182.
- Rudd JM, Greenley GE, Beatson AT, et al. Strategic planning and performance: extending the debate. J Bus Res. 2008;61:99–108.
- Mansson A. Energy security in a decarbonized transport sector: a scenario-based analysis of Sweden’s transport strategies. Energy Strat Rev. 2016;13-14:236–247.
- Ram C, Montibeller G, Morton A. Extending the use of scenario planning and MCDA for the evaluation of strategic options. J Oper Res Soc. 2011;62:817–829.
- Rosenhead J. Robustness analysis. New York: John Wiley & Sons; 2010.
- Attari A, Nasseri SH. New concepts of feasibility and efficiency of solutions in fuzzy mathematical programming. Fuzzy Inf Eng. 2014;6:203–221.
- Babaie-Kafaki S, Ghanbari R, Mahdavi-Amiri N. Hybridizations of genetic algorithms and neighbourhood search metaheuristics for fuzzy bus terminal location problems. Appl Soft Comput. 2016;46:220–229.
- Ghanbari R, Babaie-Kafaki S, Mahdavi-Amiri N. An efficient hybridization of genetic algorithm and variable neighbourhood search for fuzzy bus terminal location problems with fuzzy setup cost. Asia Pac J Oper Res . 2012;29(2):1–25.
- Dolan ED, Moré JJ. Benchmarking optimization software with performance profiles. Math Program. 2002;91:201–213.
- Bellman RE, Zadeh LA. Decision-making in a fuzzy environment. Manage Sci. 1970;17:141–164.
- Dubios D, Prade H. Fuzzy sets and systems: theory and applications. New York: Academic Press; 1980.
- Zimmermann HJ. Fuzzy set theory and its applications. Norwell: Kluwer Academic; 1996.
- Bezdek LC. Fuzzy models-what are they and why? IEEE Trans Fuzzy Syst. 1993;1(1):1–6.
- Ghanbari R, Mahdavi-Amiri N. Fuzzy LR linear systems: quadratic and least-squares models to characterize exact solutions and an algorithm to compute approximate solutions. Soft comput. 2015;19(1):205–216.
- Ghanbari R, Mahdavi-Amiri N. Fuzzy solutions of LR fuzzy linear systems using ranking functions and ABS algorithms. Appl Math Model. 2010;34:3363–3375.
- Garcia C, Verdegay JL. On the sensitivity of membership functions for fuzzy linear programming problems. Fuzzy Sets Syst. 1993;56:47–49.
- Mahdavi-Amiri N, Nasseri SH. Duality results and a dual simplex method for linear programming problems with trapezoidal fuzzy variables. Fuzzy Sets Syst. 2007;158(17):1961–1978.
- Ghanbari R. Solutions of fuzzy LR algebraic linear systems using linear programs. Appl Math Model. 2015;39(17):5164–5173.
- Nasseri H, Taghi-Nezhad N, Ebrahimnezhad A. A note on ranking fuzzy number with an area method using circumcenter of centroids. Fuzzy Inf Eng. 2107;9:259–268.
- Issa T, Chang V, Issa T. Sustainable business strategies and PESTEL framework. GSTF Int J Comput. 2010;1(1):73–79.
- Saaty TL. How to make a decision? The analytic hierarchy process. Eur J Oper Res. 1990;48:9–26.
- Nasseri SH, Zadeh MM, Kardoost M, et al. Ranking fuzzy quantities based on the angle of the reference functions. Appl Math Model. 2013;37:9230–9241.
- Buckley JJ. Fuzzy hierarchical analysis. Fuzzy Sets Syst. 1985;17(3):233–247.
- David FR. Strategic management: concepts and cases. Upper Saddle River: Prentice Hall; 2011.
- Gogus O, Boucher TO. Strong transitivity, rationality and weak monotonicity in fuzzy pairwise comparisons. Fuzzy Sets Syst. 1998;94:133–144.
- Gould N, Scott J. A note on performance profiles for benchmarking software. ACM Trans Math Softw. 2016;43(2):1–5.
- Wang YM, Elhag TMS, Hua Z. A modified fuzzy logarithmic least-square method for fuzzy analytic hierarchy process. Fuzzy Sets Syst. 2006;157:3055–3071.
- Wang YM, Chin KS. Fuzzy analytic hierarchy process: a logarithmic fuzzy preference programming methodology. Int J Approx Reason. 2011;52:541–553.