
 ?Mathematical formulae have been encoded as MathML and are displayed in this HTML version using MathJax in order to improve their display. Uncheck the box to turn MathJax off. This feature requires Javascript. Click on a formula to zoom.
ABSTRACT
Research question
Match day revenue is still an essential source of income for many professional sports clubs worldwide. This paper studies the determinants of ticket pricing in the English Premier League and examines whether and to what extent stadium goers pay a premium for sporting success and spending by clubs in the players’ labour market.
Research methods
We estimate regression models for the cheapest and most expensive tickets of clubs playing in the English Premier League for the five seasons between 2014/15 and 2018/19 inclusive.
Results and findings
Our study shows that ticket prices are driven by several variables including the opponent and local derbies. The impact of team performance is asymmetric affecting only the most expensive tickets. Capacity utilisation and total labour cost impact the prices of both types of tickets.
Implications
This research provides insights for both leagues and individual clubs. For example, the findings can be used as a benchmark to assess the magnitude of price increases that the market may be willing to bear. Additionally, clubs can explore the extent to which greater revenues can be extracted from different types of consumers.
Introduction
The influx of commercial and broadcasting income for the most prominent sports leagues in the world meant a gradual decline over the years in the share of match day revenues as a proportion of total revenue. However, for many sports and leagues worldwide, match day revenue is still the primary source of income, and even for the largest sports organisation, the contribution of and size of match day revenue is essential. For example, in the English Premier League (EPL), in which match day revenue is dominated by that of broadcasting and represents just 13% of total revenue for the league in 2020, the absolute value of match day revenue was €683 million, a non-trivial amount and of great economic relevance (Deloitte, Citation2021).
With the end of the government-imposed restrictions on attendance after the Covid-19 pandemic in the years 2020 and 2021, and the return of fans to stadia, questions of how sports organisations price their tickets have re-emerged. Whilst the availability of information on ticket pricing in North American major sports leagues allows empirical analyses of the factors that influence ticket prices (Rishe & Mondello, Citation2003, Citation2004), the limited accessibility of match day pricing data for the most European sport make similar analyses difficult.
The purpose of this paper is two-fold: firstly, the paper aims to address the question of whether stadium visitors must pay a premium for the sporting success of teams. Secondly, whether stadium goers must pay for excesses in the player labour market. Additionally, we explore other factors that drive ticket prices. From a managerial perspective, sports clubs may wish to explore the relationships between ticket prices and assess how their pricing strategies conform with benchmarks. With additional research and data, clubs can evaluate potential revenue improvements from changes in the determinants that affect the price.
This data set’s unique feature is the cheapest and the most expensive ticket prices for each game. We performed the arduous task of collecting the most expensive and cheapest ticket price data for each English Premier League game for five years from 2014/15 to 2018/19 inclusive. These were sourced from individual websites and ticketing platforms of the participating clubs. Accounting for missing observations, there were 3,040 observations across these two different prices.Footnote1 To analyse the determinants of ticket prices in the EPL, several possible influencing factors are considered. These include economic variables, variables capturing game attractiveness, quality of viewing variables, and stadium capacity.
We find that the relative average weekly earnings, capacity utilisation for the equivalent fixture from the previous season, local derbies, total costs of labour, and playing certain oppositions, the six biggest clubs (Manchester United, Manchester City, Chelsea, Arsenal, Liverpool, and Tottenham Hotspurs), affect the price of both the cheapest and most expensive tickets. The positive externalities on ticket prices for the six biggest away teams are interesting in that their magnitudes reflect their ‘bigness’. Home teams use these opponents as an opportunity to freeride by significantly increasing ticket pricing for both the cheapest and the most expensive tickets. Additionally, we find that improvements in the home team’s performance from the previous season positively influence the price of the most expensive ticket but not the cheapest.
The paper is structured as follows: first, we review the relevant literature. Next, we present the data and empirical model. We then discuss the explanatory variables and present and analyse the results. We then provide insight into the managerial implications of our findings before summarising our conclusions and discussing limitations and potential areas for future research.
Related literature and theoretical background
Ticket pricing
In 1998, an industry report on English Football noted that for most clubs in the EPL, ‘gate revenues remain the primary income source that ensures that the clubs’ financial backbone is maintained’ (Deloitte, Citation1998). Some 20 years later and as a direct consequence of the growth in commercial and broadcasting income (see ), match day revenues represented a mere 13.3% of the clubs’ total revenues (Deloitte, Citation2021). However, the amounts of match day revenues are still of great importance to EPL clubs (Quansah et al., Citation2021), even for the biggest clubs in the league, as can be seen in , where five out of the big sixFootnote2 have a significant dependency on match day revenues in the season 2018/19.
Figure 1. Evolution of revenues in the English Premier League.
Notes: Own figure based on Deloitte (Citation1998, Citation2013, Citation2016, Citation2019 , Citation2021). The figure displays the evaluation of total revenues for the three main revenue sources in the English Premier League from the season 2005/06 up to season 2019/20 in addition to total revenues in the founding season of the EPL 1991/92. The three major revenue sources are match day revenue, broadcasting revenue and commercial revenue.
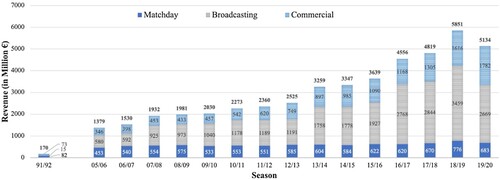
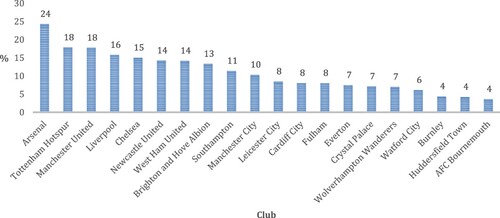
Figure 2. Match day revenues as a percentage of total revenues by club, 2018/19.
Notes: Own figure based on Quansah et al. (Citation2021). The figure displays match day revenues as a percentage of total revenues for each club that played in the English Premier League in the season 2018/19.
Ticket pricing remains a key tool by which clubs can generate appropriate match day revenue. Lovelock and Wirtz (Citation2004) assert that club pricing objectives fall into three categories: revenue, operations, or patronage orientation. While revenue orientation aims to improve revenues in pursuit of generating profits or accumulating surplus to be spent in the players’ labour market, operations orientation tries to balance supply and demand to ensure maximum utilisation of the available capacities at any given time. On the other hand, patronage orientation aims to maximise a club’s appeal among its supporter base. Drayer et al. (Citation2012) posit that clubs have maintained a focus on attendance maximisation in the past without much consideration for revenue orientation, while other authors suggest that football clubs have the motivation to under-price tickets to maximise attendance and increase ancillary revenues from food and beverages, parking, merchandise and to enhance the fan experience (Courty, Citation2003; Fort, Citation2004). For example, research from North American intercollegiate athletics suggests a unique attendance-oriented pricing objective not prominently found in professional sports (Morehead et al., Citation2021). Apart from having to cope with heterogeneous stakeholder interests within a university, as well as with the NCAA’s attendance requirements, the athletic departments have to consider attendance because of media attention, institutional reputation, school spirit, and the recruitment of talent for their sports teams (Morehead et al., Citation2021).
In the early 2000s, football clubs in England started to implement advanced price policies, such as price banding (i.e. the notion of premium pricing for match day tickets against certain opponents) and price bundling (i.e. offering combinations of two or more match day tickets in a package to be purchased together in one transaction) (Clowes & Clements, Citation2003). However, it is not so much the implementation of demand-based pricing strategies that causes resentment among English football fans but the perceived or actual excessive high ticket pricing, particularly in the EPL (Conn, Citation2014).
Determinants of ticket pricing
We borrow from the rich tradition of demand studies but place ticket prices at the centre stage therefore adopting an inverse demand function (Ferguson et al., Citation1991). The inverse demand function has price as the dependent variable. The analysis of ticket prices as the dependent variable and its determinants helps us explore several relationships. Research on the determinants of ticket pricing compared with attendance is relatively new (Diehl et al., Citation2016), and studies are relatively scarce, especially those focusing on ticket pricing in European sports. Whereas pricing data on North American major league sports have often been obtainable, historic match-by-match ticket price data for European football have been challenging to acquire (Coates & Humphreys, Citation2007).
In an exploratory study on ticket prices in the NFL, Reese and Mittelstaedt (Citation2001) were the first to explore the criteria used to establish pricing strategies in the North American primary market. They found that the previous year’s team performance, revenue needs, and socio-demographic factors, such as income, market size, population, and having a new stadium, influenced match day ticket prices in American Football. Rishe and Mondello (Citation2003) empirically investigated price determinants in the NFL and the four major North American sports leagues, respectively. While their studies suggest that the factors that influence ticket prices in the NFL are the previous season’s team performance, fan income, population, as well as stadium age, the existence of a new stadium was found to be the most important driver of ticket prices in all four major league sports. Population size and the previous season’s capacity utilisation were significant and positively associated with ticket prices in three of the four leagues, except for the NFL. Interestingly, their evidence suggests that a team’s payroll does not influence ticket prices in the NFL or NHL but does so in the NBA and MLB (Rishe & Mondello, Citation2004). Furthermore, prior season success only marginally affects ticket prices in most North American major league sports. According to a more recent study on football spectator attitudes in Brazil, club specifics, the form of the ticket purchase, and stadium quality further determined the price, according to a more recent study on football spectator attitudes (Forti & De Lima, Citation2021).
While traditional sports demand studies have considered ticket pricing as one of many variables affecting spectator demand, few studies have examined the factors influencing ticket pricing in European sports markets. Kemper and Breuer (Citation2016a, Citation2016b) have focused on dynamic ticket pricing applications in European sports, Kemper and Breuer (Citation2015) have studied the secondary ticket market in the German Bundesliga by analysing ticket prices on ebay.de, and Nufer and Fischer (Citation2013) have conducted a descriptive study on ticket prices in European football. In a sports marketing study, Woratschek et al. (Citation2020) analysed secondary ticket market premia for German women’s national football using conjoint analysis. Solberg (Citation2001) examined ticket price optimisation strategies during the 1999 World Hockey Championship in Norway by utilising price bundling. To the best knowledge, the factors that determine ticket prices in the English Premier League have not been previously investigated. Nor have the determinants of ticket prices in the primary market of any other sports league in Europe been examined.
Another factor influencing ticket pricing is the opponent. As Neale (Citation1964) notes, the production process in professional team sports differs from other industries. While the elimination of competition can benefit a firm in most markets, in sports, a single team is unable to produce a marketable product without opponents. This peculiarity necessitates a joint production process where multiple teams participate in producing the final product. Furthermore, not only is the existence of other teams essential, but also their relative strengths are crucial for the sport’s marketability. The relationship between the quality of competition and a team’s revenue is not linear in professional team sports (Michie & Oughton, Citation2004). As the opposing team’s strength increases, it can lead to an increase in attendance and revenue as fans are drawn to more competitive and exciting matches. However, if the opposing team becomes too dominant, it may result in a decline in attendance and revenue, as fans may lose interest in one-sided matches.
According to Berri and Schmidt (Citation2006):
Despite the joint nature of sports production, the compensation of talent in the industry is organized as if the individual firms were largely independent […] teams negotiate with players, and these negotiations result in a salary that is paid by the individual team. Hence, if a player generates revenue for his opponent, such revenue generation is largely uncompensated. Therefore, to the extent that individual team-revenue streams are increased by the quality of players on other teams’ rosters, an externality exists.
Our study addresses the presence of externalities by incorporating the six most popular teams as dummy variables and evaluating their effect on ticket prices. Using ticket prices as a measure, home teams can take advantage of the positive externalities of popular opposing teams. Neglecting to do so may result in the home team not fully realising the potential benefits.
Data and empirical model
Our unit of observation is the match day, and we consider two dependent variables: the cheapest and most expensive price for a match day ticket. We manually collected data on weekly ticket prices charged for games to the EPL for the five seasons between 2014/15 and 2018/19 inclusive. Due to promotion and relegation, the number of different clubs observed over the observed period is 26, with some clubs appearing in the dataset only once and others in every single season. Every one of the 20 eligible clubs in a given season had 19 home and 19 away matches, with a season comprising 380 matches, bringing the total to 1,900 matches for the five seasons. As the prices collected for each match were the cheapest and the most expensive, the total number of observations across both types of tickets was 3,800. However, some ticket prices were unavailable: Manchester City and Everton for all five seasons; Newcastle United’s most expensive tickets for four seasons; and Hull City’s ticket for the 2014/15 season. After omitting these and accounting for other missing data, the observations were further reduced to 1,520 for each of the cheapest and the most expensive tickets. During the sample period, all but four teams: Huddersfield Town; AFC Bournemouth (2015/16, 2016/17); Swansea City (2014/15, 2015/16); and West Bromwich Albion (2014/15, 2016/17) applied a seat-location approach, a price discrimination strategy based on the perceived quality of seat.
Differences between the lowest and the highest match day ticket prices reveal substantial disparities in the additional premium per match charged by each club. Watford, for example, demanded another £6 for tickets based on seat location. Chelsea charged an additional £26.00, while Arsenal charged £31.50 more for their most expensive ticket price than the cheapest seat.
The principles of price banding – price discrimination based on the perceived attractiveness of the opponent – are an integral part of most clubs’ pricing decisions. Only six out of the 26 teams in the sample – Manchester United (all seasons), AFC Bournemouth (2015/16, 2016/17, 2017/18, 2018/19), Watford (2015/16, 2016/17, 2017/18, 2018/19), Liverpool (from 2016/17 onwards), Burnley (2016/17, 2017/18, 2018/19), and Huddersfield Town (2017/18, 2018/19) – abstain from applying price banding. Everton abandoned price banding in the season 2019/20 to reduce and simplify ticket pricing (Everton, Citation2019). As noted earlier, price banding potentially extracts any additional surplus consumers are willing to pay and leads to higher income for a club (Rascher et al., Citation2007). According to a survey by Clowes and Clements (Citation2003), most clubs that do not apply price discrimination based on opponents do so consciously as they believe it is unfair to discriminate between teams in the Premier League or because they do not see the need to do so. There are also likely to be administration costs associated with price discrimination.
Of the clubs that applied price banding, there are differences in the number of categories, the opponents that trigger a premium, and the magnitude of the premium charged. While most clubs divide the opponents into three categories (e.g. A, B, and C or A+, A and B), clubs like Fulham, Middlesbrough, Swansea City, and Wolverhampton Wanderers prefer only two categories. On the other hand, Norwich City had five different categories for the 2015/16 season.
But there are also considerable differences concerning the magnitudes of price premia based on the opposition. Arsenal charged £27 for the cheapest ticket category in a game against AFC Bournemouth in 2018/19, while the price for the same seat was £65.50 against Chelsea. On the other hand, Chelsea charged £52 for the cheapest ticket against AFC Bournemouth and £61 for the same seat against Arsenal. The ticket price range of EPL clubs during the 2018/19 season is displayed in .
Table 1. EPL ticket price range for the 2018/19 season (in £).
To procure the option of buying match day tickets early, membership is required at many clubs, with only limited discounts for these tickets, if any. Several clubs also offer top category A or A+ match tickets contingent on either being a club member, having collected bonus points in previous games, or buying the tickets as price-bundles together with tickets for other less popular games. There is no publicly available data on the number of seats provided at these prices or within these schemes.
To model ticket prices, the dependent variables are the logarithm of prices. The log values are preferred as the coefficients can be interpreted as a proportional rather than an absolute change. This approach is an obvious choice since the impact of a change in any of the explanatory variables will likely have different effects at different price levels. Additionally, the use of logarithms will mitigate against any skewness in the distribution of prices which range from a low of £9 (£25) to a high of £70 (£97) for the cheapest (most expensive) ticket. The models are estimated using linear regressions estimated by ordinary least squares (OLS) and fixed effects, with each home club-season having its own intercept term. The values of each intercept term do not vary across a home club-season and capture a set of unobserved factors that are constant within each panel.
For the two types of ticket prices, the models can be presented as
(1)
(1) The subscripts i, j, and t denote home club, away club, and season respectively; type represents the two types of tickets being modelled.
is the log of ticket price,
is a constant, and
is a vector of coefficients to be estimated with respect to
, a vector of explanatory variables. The subscript t-1 is highly relevant as the prices of tickets for the current season are modelled on information from the previous season that just concluded. Finally,
is the error term, which is independent, normally distributed with a mean value of 0 and constant variance. As an additional robustness check, we also estimate the models using a fixed effect with the home club-season panel. In this instance, the intercept
is effectively replaced by
, a vector of intercepts representing a home club season.
Our choice of explanatory variables captures a range of categories. The first relates to the economic wealth of the clubs’ locations and the labour costs faced by clubs. The second category captures a range of sporting factors, including, for example, matches involving local rivals, club brands, and sporting performances. Finally, time elements are also used, including weekends and public holidays. Each of the explanatory variables is described in more detail below:
Following Reese and Mittelstaedt (Citation2001), we include relative average weekly workplace earnings, which is calculated as the average weekly workplace earnings over the previous season, as an indicator of the region’s economic conditions where the home club is located. The data source is the Centre for Cities, an independent, non-partisan urban charity-registered policy research unit in England. Lower values of weekly workplace earnings may indicate lower purchasing power (Solberg & Turner, Citation2010). However, the nature of supporting a team can often mean a lifelong following irrespectively of income (Cox, Citation2012). Fans from economically challenged, working-class regions are often considered the most loyal. To account for the impact of inflation on earnings over time, we use relative values, which are calculated as the average weekly earnings divided by the mean value for that season. As such, the mean value of this variable during any given season is 1. Additionally, we include the square of the term to capture any non-linear relationship between relative average weekly workplace earnings and ticket price.
In contrast to research that focuses on the influences on stadium demand, where stadium quality is a determinant (Quansah, Citation2022) and the stadium capacity is a limiting factor (Borland & Macdonald, Citation2003), capacity utilisation from the previous season might actually be a determinant of ticket pricing. Stadium capacity determines the maximum number of seats a club can offer, which might lead to a market shortage in the face of excess demand. As a response to the demand, clubs might raise ticket prices to manage excess demand. For this reason, the study investigates the impact of stadium capacity on ticket prices. For each match, the capacity utilisation from the equivalent match from the previous season is used. Arguably, this gives the decision-makers insights into the likely demand. The quadratic of capacity utilisation from the previous season is also included to capture non-linearity. One might expect prices to increase at an increasing rate. For those matches that can’t be paired with the prior season’s equivalent because of promotion to the league, capacity utilisation takes a value of 0, and a dummy variable, home promoted, is used to capture this phenomenon.
Studies by Forrest and Simmons (Citation2002) and Forrest et al. (Citation2004), among others, indicate that games of historical and local rivalry tend to generate higher demand, ceteris paribus. Such matches take on a special status over and above regular league matches, with teams and supporters vying for local bragging rights. To test whether derby matches significantly affect ticket prices, the data capture 19 historical rivalries among the 26 clubs, which occurred in 86 matches in the five seasons observed. The variable derby match takes the value of 1 for such matches and 0 otherwise.
Undoubtedly, prices for the biggest clubs in the EPL, based on revenue, reputation, and league success, are greater than their smaller counterparts. As noted above, such clubs have a stronger legacy, and their cumulative performances over past seasons are likely to afford them greater popularity which will be reflected in ticket prices. Taking the six biggest teams can be viewed as somewhat arbitrary. We could have easily constructed a variable capturing the biggest four. However, in the following analysis, dummy variables for away clubs registered significance for the top six clubs, with the seventh biggest club not significantly different from the others. Therefore, it seemed appropriate to choose the six biggest clubs and test their pricing behaviours relative to the rest. Furthermore, in a list of significant club dummies for televised matches in the EPL study by Buraimo et al. (Citation2022), these were the top six clubs that attracted the greatest audiences. For this reason, we include a dummy variable, Big Six at home, for Arsenal, Chelsea, Liverpool, Manchester City, Manchester United, and Tottenham Hotspur home matches.
Like other sports labour markets, the market for football players follows the rule of supply and demand. The best players are highly sought-after, with the consequent effects on the clubs’ wage bills and the high transfer fees in many instances. Assuming efficient or quasi-efficient markets, a club’s wage bill is likely to be a predictor of a team’s strength and a proxy for team quality (Szymanski, Citation2003). However, the value of the contract last for a specified period. A club may acquire a player for a high salary and transfer fee, only to realise that the player does not quite fulfil expectations. Changes in form and injuries are likely to weaken the relationship between labour costs and player quality. However, the motivation is not to test or assert the strength of the relationship between labour costs and quality but to test whether higher total labour costs lead to higher ticket prices, or in other words, to what extent do clubs pass on their player expenses to fans? Besides the club wage bill, we also considered net transfer fees deriving total labour costs. A club’s wage bill will also include non-playing staff. However, the proportion of total labour costs for non-playing staff is likely to be minor, and regardless, such costs are part of the clubs’ overheads. The measure used for this explanatory variable, ln(adjusted total labour costs), is the log of clubs’ inflation-adjusted total labour costs (sum of the wages and net transfer fee).
There is evidence in favour of positive effects on demand for games in which teams with widespread national and international reputation participate (Forrest et al., Citation2005). According to Czarnitzki and Stadtmann (Citation2002), in a study on the determinants of match attendance in the German Bundesliga, reputation and allegiance appear to be more critical determinants of demand than the uncertainty of outcome. The EPL is characterised by a small number of teams that dominate the league in areas such as playing success, wage bills, team revenues, and market size. In a recent study by Buraimo et al. (Citation2022), in which they explore television audiences in the EPL, they find that audiences have strong preferences for teams in a particular order, having controlled for other factors, including player quality. We thus test for the possibility that these clubs, considered the largest clubs in the league (Arsenal, Chelsea, Everton, Liverpool, Manchester City, Manchester United, and Tottenham Hotspur), might drive prices by including dummy variables, big six (as visiting teams), for games played against any of them.
In contrast to club brand and reputation built over time, a team’s position in the previous season is used to measure its short-term performance. Following the ‘basking-in-reflected-glory’ phenomenon (Cialdini et al., Citation1976), the home- and away teams’ short-term success could spark demand, which might influence the home team’s pricing policy (Reese & Mittelstaedt, Citation2001). As such, the models use the home and away teams’ positions at the end of the previous season as explanatory variables denoted by the previous season’s performance. The expectation is that better performances in the last season may positively impact the prices charged for tickets in the coming season.
In contrast to weekends, where people tend to have more leisure time, weekday games are usually played in the evening and attract fewer attendees (Carmichael et al., Citation1999). To capture these effects, a dummy variable, weekend, is included and is set to 1 if the match is scheduled for the weekend and 0 otherwise. Similarly, people tend to have more leisure time during Bank Holidays. A dummy variable, public holiday, is included and takes the value of 1 if the match is scheduled on a public holiday and 0 otherwise. The greater leisure time will induce greater demand, all things being equal. However, football clubs may respond to this expected increase in demand with increased prices. This may, in turn, depend on the stadium’s capacity. Descriptive statistics for the variables are presented in .
Table 2. Summary Statistics for continuous and dummy variables (n = 1,520).
Finally, we check for collinearity by inspecting the correlation coefficient matrix. The correlation coefficient values, presented in , do not cause concern and collinearity is not considered to be an issue in the modelling.Footnote3
Table 3. Correlation matrix for independent variables (n = 1,520).
Results and discussion
In this section, we present the findings of our empirical analysis, and we discuss the results by highlighting the key takeaways and their implications for the research question and the broader field of study. displays the results from the models.
Table 4. Regression results: dependent variable is ln(ticket prices).
Models (1) and (2) are linear models estimated by ordinary least squares (OLS), whereas Models (3) and (4) are estimated using fixed effects with home club-season as the panel. In the models estimated using fixed effects, variables that are constant across home club-season panels are omitted, and the explanatory variables that remain are those that vary within the panel. Comparing the coefficients of these variables from the fixed effects models with the OLS equivalent reveals that the coefficients are statistically similar. As such, much of the attention of this section will be on the OLS model. Each of the explanatory variables is discussed in turn across the two models.
The first of the explanatory variables is the relative average weekly workplace earnings. The quadratic for the variable was not significant and thus dropped. The earnings variable is statistically significant and suggests that earnings over the examined period affect pricing. Higher earnings positively impact the prices of both the cheapest and most expensive tickets for all clubs. This result suggests that clubs are aware of the level of wealth in their market and adjust their prices accordingly. The coefficient for the most expensive ticket is greater than that of the cheapest ticket, which is to be expected. However, the two coefficients are not substantially different at the 5% level. Still, the greater coefficient for the most expensive ticket is suggestive that the more affluent consumers are asked to pay a greater increase in ticket prices.
The results demonstrate that stadium utilisation matters and that the capacity utilisation of the same match in the previous season affects prices in the following season. The quadratic value suggests that the relation with ticket prices is a U-shape. However, the turning point of the curve is below the minimum values for capacity utilisation. This result suggests that the negative portion of the curve is redundant and that as capacity increases, prices increase but at an increasing rate. This result highlights that as demand increases (measures taken from last season’s match) and fewer seats remain, prices rise at an increasing rate, and the asking prices for both types of tickets are increased.
For those teams who are newly promoted to the EPL, there is no capacity utilisation since the equivalent match did not occur last season. The ticket prices for these clubs, based on the coefficient of the home promoted variable, is an increase of 17.9% for the most expensive tickets. For the cheapest ticket, there is no significant impact. However, this is based on the utilisation of 0, given that there was no equivalent match from the previous season. However, for an incumbent club with mean capacity utilisation, the price increase for the most expensive ticket would be 25.4%. Thus, the price increase by promoted teams for the most expensive tickets is 7.5% less than the average incumbent team. This result suggests that newly promoted teams are looking to extract surplus from the most affluent part of their markets but do not do so to the same extent as incumbent teams (Dietl et al., Citation2015). Perhaps they lack the commercial confidence to increase prices to the same degree, or such increases are likely to be too high, given that the previous season’s prices are for the division below.
The coefficient for the variable Big Six at home is significantly different from 0 for the most expensive tickets. For the cheapest tickets, the prices of the Big Six are not dissimilar to other clubs, although what is unclear is the proportion of seats available at different prices. For Big Six clubs, the most expensive tickets are 8.3% more expensive than their non-Big Six counterparts, controlling for other factors, which is expected, given their historical success, commercial might, and global strength. This result complements that of Buraimo et al. (Citation2022), who highlight the big teams generate the bulk of the interest in televised football in the EPL.
Derby matches of local interest have a positive impact on the cheapest and most expensive tickets, which are estimated to be 10.5% and 11.5%, respectively. Clubs in the EPL are keen to charge a premium for local rivalry, and this is to be expected since such matches tend to be anticipated by fans and offer the chance to gain local bragging rights. Whilst the increase for the most expensive ticket prices is higher than that of the cheapest ticket, the difference is not statistically significant, but the magnitude indicates that the more expensive tickets experience a higher price increase because of derby matches. Furthermore, whilst the percentage increase is equivalent, the absolute increases will be higher for the most expensive tickets, given the higher mean price. This result is interesting since many studies of football demand (e.g. Buraimo et al., Citation2011) show that derby matches positively influence stadium attendance. As such, there may be greater scope for increasing prices for derby matches since the price increases do not seem to diminish the additional stadium attendance. The findings also support observations made on the pricing effects of derbies in intercollegiate athletics (Sanford, Citation2016).
As noted earlier, labour costs are the most significant costs faced by football clubs, and these generally take the form of transfer fees needed to acquire players and their wages once recruited.Footnote4 We note that the labour costs of clubs are associated with a change in price for the most expensive tickets and the cheapest ones. The positive and significant signs of the coefficient of ln(adjusted total labour costs) for both ticket types suggest that clubs look to recoup at least some of the costs they face in the labour market; much of these are passed on to those fans paying the highest prices. The magnitude of the coefficient for the most expensive tickets is nearly three times that of the cheapest ticket highlighting the extent to which the more expensive tickets are used to generate more revenue. However, we again highlight that without knowledge of how the seats are apportioned across different price points, it is impossible to explore which tickets generate greater revenue. Of important note is that most of the revenue to EPL comes from the broadcast market. For the 2019–2020 season, the revenues from the broadcast market for the league made up 52% of total revenue (Deloitte, Citation2021). Hence, clubs are likely to pass on a more modest but significant amount of the players’ labour costs to fans in the stadium, given that the broadcast market can bear most of these costs.
The next set of explanatory variables is the visiting teams. In the analysis, we find that the six clubs, Manchester United, Manchester City, Liverpool, Tottenham Hotspur, Chelsea, and Arsenal, as visiting teams on average elicit price increases for the most expensive tickets, and in that descending order of magnitude. However, the differences across the clubs are negligible and not statistically different. The club next on the list was Everton, however, matches in which Everton was the visiting team did not generate price increases that were any different from those other clubs in the sample. In essence, any of the Big Six clubs as the visiting team elicit price increases by the host clubs for both types of tickets. Additionally, the price increases were consistently applied across the two types of tickets indicating that clubs adopt a consistent approach to extracting surplus from the cheapest and most expensive tickets when based on the visiting Big Six clubs. However, since the coefficients can be interpreted as percentage changes, a greater absolute amount will come from the most expensive tickets. For example, the coefficients for Liverpool as the away team for the cheapest and most expensive prices are 12.3% and 13.3%, respectively. Given the mean prices of £40 and £58 charged for the cheapest and most expensive tickets, respectively, by a team hosting Liverpool in the 2018–2019 season, the additional increases in prices are estimated to be £4.64 and £7.25 for the cheapest and most expensive tickets respectively and clearly a higher margin for the most expensive ticket in contrast to what the coefficients might suggest.
Furthermore, it is evident that host clubs take advantage of the positive externalities offered to them, which means that fans not only get to see well-known teams, but also high-level players, as elite clubs and superior player quality tend to go hand in hand. Furthermore, this underlines the tension between the Big Six clubs and their failed attempt to establish a European Super League. The positive externalities that arise from hosting these clubs are high. Any threat to the current setting will most likely be met with resistance from the clubs accruing these externalities, which is a relevant issue. Still, any discussions and analyses of the European Super League are outside the scope of this study.
The performances of the teams in the previous season offer some interesting results. That of the home team has no (meaningful) significant impact on the cheapest tickets but influences the most expensive ones. An improvement in home team performance of one place in the league standings from the previous season increases prices for the most expensive tickets by 1.2%. To put this into context, if we take two hypothetical identical home teams with the only difference being their finishing position last season and that difference being a one standard deviation difference (6.7 places), the home club is estimated to charge an extra £3.88 for the most expensive ticket. The impact on revenue will depend on the number of tickets available at this price. These results can be put in contrast to findings from the North American sports market, where team performance was one of the most critical drivers of primary and secondary ticket pricing (Diehl et al., Citation2016; Reese & Mittelstaedt, Citation2001; Rishe & Mondello, Citation2003).
The coefficient of the variable weekend is not significantly different from 0 for the cheapest tickets. However, there is a hint of significance for the most expensive tickets, especially in the fixed effects model. One can generally assume that the prices of tickets across the weekend, weekdays and public holidays are very similar.
Managerial implications
There are some lessons and implications from these results for managers at clubs and similarly at the league level. From the perspective of clubs, the results from the model can be used as a benchmark when considering price increases. Whilst the prices set by firms can be determined using different approaches, as mentioned earlier in this study, the extent to which fans can bear and are willing to accept price increases is a factor. In conventional markets, firms can readily increase prices, and consumers can either accept such increases or stop consumption, presumably to seek an alternative. Football attendance, however, is not a conventional market since fans and supporters have strong affinities and such affinities spill over into ownership even if such ownership is not legal and more psychological. As such, there are limits to price increases that consumers will find acceptable. Beyond this limit, relations between clubs and their fans and supporter can become strained. In some instances, the outcomes can be unpalatable.
For example, in a Premier League fixture in 2016 between Liverpool and Sunderland at Anfield, over 10,000 Liverpool supporters left the match in protest over proposed increases in ticket prices. The club announced that prices for the most expensive match day ticket for the following season would be increased to £77, up from £59. The supporters duly got up and walked out of the stadium in the 77th minute; this was in addition to flying black flags, rather than the usual red ones, and chants accusing the owners of greed (Press Association, Citation2016). The club owners apologised, and the price increase was cancelled. Arsenal and Tottenham Hotspur have also, in the past, retreated over price increases.
The relevance of the models in this study is that the prices used are actual prices borne by attendees, and therefore, the coefficients of the variables capture price increases that the market is willing to pay. Thus, the models can be used to benchmark acceptable price increases. This is not to suggest that fans and supporters will not accept price increases that are even greater but to suggest that beyond these, there is the risk of conflict. The extent of any proposed price increases will depend on the magnitude of the significant variables in the models and the initial prices at which the increases are being applied.
Furthermore, this study has implications for sports leagues regarding revenue allocation and distribution. While some leagues redistribute revenues, particularly from broadcast markets, they may struggle to find the optimal distribution mechanism. It’s important to note that clubs have the ability to design their own pricing strategies, which can serve as a form of quasi-redistribution. Since all clubs host every member of the Big Six (except the Big Six, who will have just five such occasions), the positive externality imposed by the Big Six effectively reassigns resources from the bigger, wealthier teams to the smaller ones. This type of revenue redistribution is desirable in sports leagues and can be achieved through effective pricing strategies, with success depending on the clubs’ in-house management expertise. This quasi-redistribution approach to stadium revenue has the advantage of not requiring league intervention and allowing clubs to retain their own stadium revenue.
Conclusion
This paper examines the factors influencing ticket pricing in the English Premier League (EPL). It finds that the cheapest and most expensive ticket prices are influenced by factors such as local earnings, stadium capacity utilisation from the previous season, whether the team is a ‘Big Six’ club, the status of the opponent and team rivalries. These variables perform as expected in the models. The study shows that clubs set prices based on the market’s ability and willingness to pay higher prices. Clubs are responsive to local prosperity, which is reflected in ticket prices. Additionally, clubs take advantage of limited stadium capacity by increasing prices as capacity decreases, forcing consumers to compete on price and pay higher premiums as capacity approaches zero.
While the Big Six clubs of the league are the driving force behind the EPL’s popularity in international markets and its high broadcasting income, positive externalities accrue to smaller teams who can freeride within both the broadcast and stadium markets. In response to the takeover of Newcastle United in 2021 by the sovereign wealth fund of Saudi Arabia, the remaining Premier League clubs passed a temporary ban on related party transactions, a move to restrict clubs from agreeing on sponsorship deals with companies linked to their owners. As Financial Fair Play regulations oblige clubs to balance football-related expenditures, such as transfer fees and wages, with income, the rule hinders clubs with wealthy shareholders, such as Newcastle United, in buying the best players, building up a strong reputation through sporting success, and becoming a big club. Paradoxically, restricting or limiting clubs from transitioning from small and medium to big clubs constrains the extent to which other clubs will be able to generate additional revenue and freeride, given the findings from this study.
Clubs look to charge stadium attendees a price premium for short-run home sporting success (at least for the most expensive tickets). The study’s results also suggest that clubs tend to recoup some player costs by passing these on to the cheapest and most expensive ticket prices (and possibly on all ticket prices in between). Whist the broadcast market for the EPL does an extraordinary job of providing resources to clubs to spend in the labour market, clubs are still compelled to extract resources from fans given their labour costs.
We further conclude that ticket prices and, consequently, match day revenues serve as a means of redistributing resources from larger to smaller clubs. This is because clubs adjust their prices based on the reputation and recent success of the teams they are scheduled to play against.
There are limitations and assumptions associated with this study. First, the study uses only two price points: the lowest and the highest available ticket prices of the home club in a particular game. The number of price points will differ among clubs, and this is often not publicly available. Thus, clubs can use ticket prices as a marketing tool, offering very limited seats in their cheapest advertised category. Second, the study focuses on how EPL clubs price their match day tickets. While this reveals the relationship between covariates and prices, the analysis does not provide an answer to how much fans are willing to pay. Third, the study cannot answer the question of whether price decisions by clubs are well-founded or whether clubs copy pricing methods from each other. For this reason, there is scope for combining the research with a qualitative angle by including interviews with club managers to examine the nature of their decision-making process, objective-setting, and pricing tools.
Disclosure statement
No potential conflict of interest was reported by the author(s).
Notes
1 Wage costs and ticket prices of a few teams were not available for all years, such as those for Manchester City and Everton for all five seasons, Newcastle United’s most expensive match day tickets for the four seasons they played in the EPL, as well as Hull City’s ticket match day pricing data for the 2014/15 season.
2 There is empirical logic to the notion of Big Six. In a study of television audience demand by Buraimo et al. (Citation2022), the six biggest clubs boosted demand significantly compared with the others. As such, the reputation of the Big Six can be supported empirically.
3 Additionally, we check for multicollinearity using variance inflation factors for each variable. The results suggest that multicollinearity is not an issue, as the highest value is 5.49, well within the threshold value of 10. Furthermore, we use the condition index. The condition number of 28.61 again confirms that the models perform well against this test.
4 See Quansah et al. (Citation2021) for an examination of the importance of club revenues for player salaries and transfer expenses in the EPL.
References
- Berri, D. J., & Schmidt, M. B. (2006). On the road with the National Basketball Association’s superstar externality. Journal of Sports Economics, 7(4), 347–358. https://doi.org/10.1177/1527002505275094
- Borland, J., & Macdonald, R. (2003). Demand for sport. Oxford Review of Economic Policy, 19(4), 478–502. https://doi.org/10.1093/oxrep/19.4.478
- Buraimo, B., Forrest, D., McHale, I. G., & Tena, J. d. D. (2022). Armchair fans: Modelling audience size for televised football matches. European Journal of Operational Research, 298(2), 644–655. https://doi.org/10.1016/j.ejor.2021.06.046
- Buraimo, B., Paramio, J. L., & Campos, C. (2011). The impact of televised football on stadium attendances in English and Spanish league football. In D. Hassan & S. Hamil (Eds.), Who owns football? (pp. 129–142). Routledge.
- Carmichael, F., Millington, J., & Simmons, R. (1999). Elasticity of demand for Rugby League attendance and the impact of BskyB. Applied Economics Letters, 6(12), 797–800. https://doi.org/10.1080/135048599352196
- Cialdini, R. B., Borden, R. J., Thorne, A., Walker, M. R., Freeman, S., & Sloan, L. R. (1976). Basking in reflected glory: Three (football) field studies. Journal of Personality and Social Psychology, 34(3), 366–375. https://doi.org/10.1037/0022-3514.34.3.366
- Clowes, J., & Clements, N. (2003). An exploration of discriminatory ticket pricing practice in the English football Premier League. Managing Leisure, 8(3), 105–120. https://doi.org/10.1080/1360671032000123645
- Coates, D., & Humphreys, B. R. (2007). Ticket prices, concessions and attendance at professional sporting events. International Journal of Sport Finance, 2(3), 161.
- Conn, D. (2014). Premier League ticket prices defy the very culture that built the game. Retrieved August 8, 2021, from https://www.theguardian.com/football/blog/2014/jul/28/premier-league-ticket-prices-football
- Courty, P. (2003). Some economics of ticket resale. Journal of Economic Perspectives, 17(2), 85–97. https://doi.org/10.1257/089533003765888449
- Cox, A. (2012). Live broadcasting, gate revenue, and football club performance: Some evidence. International Journal of the Economics of Business, 19(1), 75–98. https://doi.org/10.1080/13571516.2012.643668
- Czarnitzki, D., & Stadtmann, G. (2002). Uncertainty of outcome versus reputation: Empirical evidence for the First German Football Division. Empirical Economics, 27(1), 101–112. https://doi.org/10.1007/s181-002-8361-7
- Deloitte. (1998). Deloitte & Touche annual review of football finance. D. T. Tohmatsu.
- Deloitte. (2013). Annual Review of Football Finance 2013. Retrieved August 26, 2019, from ARFF 2012 (deloitte.com)
- Deloitte. (2016). Annual review of football finance 2016. Retrieved August 26, 2019, from https://www2.deloitte.com/content/dam/Deloitte/uk/Documents/sports-business-group/deloitte-uk-annual-review-of-football-finance-2016.pdf
- Deloitte. (2019). Annual review of football finance 2019. Retrieved August 26, 2019, from https://www2.deloitte.com/uk/en/pages/sports-business-group/articles/deloitte-football-money-league.html
- Deloitte. (2021). Annual review of football finance. Retrieved July 20, 2022, from https://www2.deloitte.com/uk/en/pages/sports-business-group/articles/annual-review-of-football-finance.html
- Diehl, M. A., Drayer, J., & Maxcy, J. G. (2016). On the demand for live sport contests: Insights from the secondary market for National Football League tickets. Journal of Sport Management, 30(1), 82–94. https://doi.org/10.1123/JSM.2014-0034
- Dietl, H., Grossmann, M., Hefti, A., & Lang, M. (2015). Spillovers in sports leagues with promotion and relegation. Scottish Journal of Political Economy, 62(1), 59–74. https://doi.org/10.1111/sjpe.12060
- Drayer, J., Rascher, D. A., & McEvoy, C. D. (2012). An examination of underlying consumer demand and sport pricing using secondary market data. Sport Management Review, 15(4), 448–460. https://doi.org/10.1016/j.smr.2012.03.005
- Everton. (2019, November 7). Everton announces simplified match-by-match ticket prices. Retrieved August 15, 2021, from https://www.evertonfc.com/news/1276887/everton-announces-simplified-match-by-match-ticket-prices
- Ferguson, D. G., Stewart, K. G., Jones, J., & Le Dressay, A. (1991). The pricing of sports events: Do teams maximize profit? The Journal of Industrial Economics, 39(3), 297–310. https://doi.org/10.2307/2098521
- Forrest, D., & Simmons, R. (2002). Team salaries and playing success in sports: A comparative perspective. Zeitschrift für Betriebswirtschaft, 72(4), 221–238.
- Forrest, D., Simmons, R., & Buraimo, B. (2005). Outcome uncertainty and the couch potato audience. Scottish Journal of Political Economy, 52(4), 641–661. https://doi.org/10.1111/j.1467-9485.2005.00360.x
- Forrest, D., Simmons, R., & Szymanski, S. (2004). Broadcasting, attendance and the inefficiency of cartels. Review of Industrial Organization, 24(3), 243–265. https://doi.org/10.1023/B:REIO.0000038274.05704.99
- Fort, R. (2004). Inelastic sports pricing. Managerial and Decision Economics, 25(2), 87–94. https://doi.org/10.1002/mde.1108
- Forti, P., & De Lima, L. M. (2021). Quanto vale o show? O ingresso de futebol sob uma perspectiva hedônica. ReMark – Revista Brasileira de Marketing, 20(3), 105–134. https://doi.org/10.5585/remark.v20i3.15802
- Hausman, J. A., & Leonard, G. K. (1997). Superstars in the National Basketball Association: Economic value and policy. Journal of Labor Economics, 15(4), 586–624. https://doi.org/10.1086/209839
- Jewell, R. T. (2017). The effect of marquee players on sports demand: The case of US Major League Soccer. Journal of Sports Economics, 18(3), 239–252. https://doi.org/10.1177/1527002514567922
- Kemper, C., & Breuer, C. (2015). What factors determine the fans’ willingness to pay for Bundesliga tickets? An analysis of ticket sales in the secondary market using data from ebay.de. Sport Marketing Quarterly, 24(3), 142–158.
- Kemper, C., & Breuer, C. (2016a). Dynamic ticket pricing and the impact of time – an analysis of price paths of the English Soccer Club Derby County. European Sport Management Quarterly, 16(2), 233–253. https://doi.org/10.1080/16184742.2015.1129548
- Kemper, C., & Breuer, C. (2016b). How efficient is dynamic pricing for sport events? Designing a dynamic pricing model for Bayern Munich. International Journal of Sport Finance, 11(1), 4–25.
- Lawson, R. A., Sheehan, K., & Stephenson, E. F. (2008). Vend it like Beckham: David Beckham’s effect on MLS ticket sales. International Journal of Sport Finance, 3(4), 189.
- Lovelock, C. H., & Wirtz, J. (2004). Services marketing: People, technology, strategy.
- Michie, J., & Oughton, C. (2004). Competitive balance in football: Trends and effects. The Sportsnexus London.
- Morehead, C. A., Shapiro, S. L., Reams, L., McEvoy, C., & Madden, T. M. (2021). A qualitative exploration of ticket-pricing decisions in intercollegiate athletics. Journals of Issues in Intercollegiate Athletics, 14, 547–573. https://csri-jiia.org/a-qualitative-exploration-of-ticket-pricing-decisions-in-intercollegiate-athletics/
- Neale, W. C. (1964). The peculiar economics of professional sports: A contribution to the theory of the firm in sporting competition and in market competition. The Quarterly Journal of Economics, 78(1), 1–14. https://doi.org/10.2307/1880543
- Nufer, G., & Fischer, J. (2013). Ticket pricing in European football-analysis and implications. Sport and Art, 1(2), 49–60. https://doi.org/10.13189/saj.2013.010205
- Press Association. (2016). Liverpool fans’ walkout protest: around 10,000 leaves in the 77th minute over ticket prices. The Guardian. Retrieved January 20, from https://www.theguardian.com/football/2016/feb/06/liverpool-fans-walkout-thousands-ticket-price-protest
- Quansah, T., Frick, B., Lang, M., & Maguire, K. (2021). The importance of club revenues for player salaries and transfer expenses—how does the coronavirus outbreak (COVID-19) impact the English Premier League? Sustainability, 13(9), 5154. https://doi.org/10.3390/su13095154
- Quansah, T. K. (2022). New sports stadia for Africa? The impact of sportscape features on attendance intentions in sub-Saharan African club football. European Sport Management Quarterly, 1–24. https://doi.org/10.1080/16184742.2022.2125549
- Rascher, D. A., McEvoy, C. D., Nagel, M. S., & Brown, M. T. (2007). Variable ticket pricing in Major League Baseball. Journal of Sport Management, 21(3), 407–437. https://doi.org/10.1123/jsm.21.3.407
- Reese, J. T., & Mittelstaedt, R. D. (2001). An exploratory study of the criteria used to establish NFL ticket prices. Sport Marketing Quarterly, 10(4), 223–230.
- Rishe, P., & Mondello, M. (2004). Ticket price determination in professional sports: An empirical analysis of the NBA, NFL, NHL, and Major League Baseball. Sport Marketing Quarterly, 13(2), 104–112.
- Rishe, P. J., & Mondello, M. J. (2003). Ticket price determination in the National Football League: A quantitative approach. Sport Marketing Quarterly, 12(2), 72–79.
- Sanford, K. S. F. (2016). Assessing the intensity of sports rivalries using data from secondary market transactions. Journal of Sports Economics, 17(2), 159–174. https://doi.org/10.1177/1527002514527112
- Solberg, H. A. (2001). Finding a price policy that maximises the ticket revenues at sporting events: A focus on price bundling1. European Sport Management Quarterly, 1(4), 300–319. https://doi.org/10.1080/16184740108721904
- Solberg, H. A., & Turner, P. (2010). Exporting sports rights to overseas markets: The case of European football. Sport in Society, 13(2), 354–366. https://doi.org/10.1080/17430430903523119
- Szymanski, S. (2003). The economic design of sporting contests. Journal of Economic Literature, 41(4), 1137–1187. https://doi.org/10.1257/jel.41.4.1137
- Woratschek, H., Kaiser, M., Durchholz, C., & Strobel, T. (2020). Preisaufschläge für die sportliche relevanz. German Journal of Exercise and Sport Research, 50(3), 406–416. https://doi.org/10.1007/s12662-020-00661-y
