
 ?Mathematical formulae have been encoded as MathML and are displayed in this HTML version using MathJax in order to improve their display. Uncheck the box to turn MathJax off. This feature requires Javascript. Click on a formula to zoom.
ABSTRACT
Background
Over the last two decades, Indonesia has experienced remarkable economic growth. However, the percentage of infants and young children meeting the minimum dietary diversity (MDD) criteria has stagnated. Despite the growing body of evidence of the association between MDD and socioeconomic factors, there is little information about socioeconomic inequalities in MDD in Indonesia.
Objectives
The current study seeks to quantify the wealth- and education-related inequalities in MDD among infants and young children in Indonesia and determine the contribution of different factors to these disparities.
Methods
We included a total of 5038 children aged 6–23 months of the 2017 Indonesia Demographic and Health Survey. We measured wealth- and education-related inequalities using the concentration curve and Wagstaff normalised concentration index. Using a concentration index decomposition analysis, we then examined factors contributing to wealth- and education-related inequalities in MDD.
Results
The concentration indices by household wealth and maternal education were 0.220 (p < 0.001) and 0.192 (p < 0.001), respectively, indicating more concentration of inequalities among the advantaged population. The decomposition analysis revealed that household wealth (29.8%), antenatal care (ANC) visits (16.6%), paternal occupation (15.1%), and maternal education (11.8%) explained the pro-rich inequalities in MDD in Indonesia. Maternal education (26.1%), household wealth (19.1%), ANC visits (14.9%), and paternal occupation (10.9%) made the most considerable contribution to education-related inequalities in MDD.
Conclusions
There is substantial wealth- and education-related inequalities in MDD. Our findings suggest an urgent need to address the underlying causes of not reaching dietary diversity by promoting infant and young child feeding equity in Indonesia.
Responsible Editor
Jennifer Stewart Williams
Background
Malnutrition is a predominant public health issue among children. Globally, an estimated 22% or 149 million children under five are affected by stunting. Wasting remains to threaten the lives of an estimated 7% or 45 million children under five. Overweight affects an estimated 6% or 39 million children under five [Citation1]. In Indonesia, child malnutrition rates remain alarming. The 2018 Indonesia Basic Health Research (Riskesdas), the most recent nationally representative survey, has reported a stunting prevalence at 31%, wasting at 10%, underweight at 18%, and overweight at 8% [Citation2]. These rates indicate that Indonesia is making slow progress and are off track in meeting the Global Nutrition Targets [Citation3].
Eating a variety of food in addition to breastmilk help infants and young children achieve optimum growth, health, and development [Citation4,Citation5]. A diversified diet also reflects the quality and quantity of food intake, food security, and micronutrient adequacy of children [Citation6–8]. Children who consume a diversified diet are more likely to have a reduced risk of stunting [Citation9–11]. Moreover, children from low- and middle-income countries (LMICs) could avoid more than 11 million stunting cases if 90% or more of infants and young children received food from different groups to meet the MDD criteria [Citation12]. Minimum dietary diversity is also associated with a decreased risk of anaemia [Citation13,Citation14] and developmental delays [Citation15,Citation16]. Overall, MDD may have long term effects on adult human capital, health, and economic productivity [Citation17].
The World Health Organization (WHO)/United Nations International Children’s Emergency Fund (UNICEF) has recommended infants and young children meet a minimum dietary diversity (MDD), consuming foods and beverages from at least five out of eight food groups during the previous day, starting from six months. These food groups include 1) grains, roots, tubers, 2) pulses, 3) vitamin A-rich fruits and vegetables, 4) other fruits and vegetables, 5) dairy products, 6) flesh foods, 7) eggs, and 8) breastmilk [Citation4,Citation18]. This food group method is a relatively simple and easy measurement used in survey settings [Citation7]. Additionally, MDD has been used as one of the process indicators to monitor the effectiveness of various breastfeeding and complementary feeding interventions in the Global Nutrition Monitoring Framework [Citation4].
Existing studies in LMICs has extensively examined factors affecting MDD at the child, maternal, household, and community levels. These studies have found that maternal education and household economic status are among the factors that are consistently associated with MDD. Children of higher economic status are at greater odds of receiving foods from diverse foods [Citation19–23]. Mothers with higher education are more likely to have children who consume a more varied diet than those with lower education [Citation19–21,Citation23–25]. Other factors, such as maternal employment [Citation26], paternal education [Citation20,Citation27], antenatal care (ANC) [Citation20,Citation25] and residency [Citation21,Citation26], are often related to increasing dietary diversity but have shown mixed results across studies. Overall, these findings suggest that socioeconomically disadvantaged children are more likely not to reach MDD.
Dietary diversity increases with economic improvements [Citation12,Citation28]; however, Indonesia may not be the case. Over the last 22 years, Indonesia experienced a substantial economic change. The poverty rate was halved from 24% in 1999 to 11.3% in 2004. The annual economic growth averaged 6% between 2005 and 2015 [Citation29,Citation30]. Yet, despite the overall economic improvement of the country, dietary diversity among children has stagnated. A nationally representative analysis study showed that the consumption of a minimum of five out of eight groups in Indonesia was 53.1% in 2007, 51.7% in 2012, and 53.7% in 2017 [Citation23]. One important reason might be the persistent income inequality, which could have worsened the unequal access to nutrition, clean water, sanitation, and health services [Citation29].
Socioeconomic inequalities pose a significant challenge to optimal feeding practices [Citation28]. However, very few studies have examined the extent of socioeconomic disparities related to dietary diversity and the factors contributing to the inequality [Citation31,Citation32]. Moreover, no study has examined socioeconomic inequalities in dietary diversity in the Indonesian context. While earlier research has extensively estimated odds ratios to analyse the relationship between socioeconomic status and dietary diversity [Citation19–25], the concentration index may better assess inequalities across the whole population (e.g. in a cumulative share of individuals ranked by household economic status). Furthermore, the concentration index can also be decomposed into a range of explanatory variables that influence socioeconomic-related inequalities [Citation33]. Understanding socioeconomic inequalities in MDD may assist policymakers and public health professionals to target specific groups of the population at risk to improve child dietary diversity and reduce the burden of not meeting MDD on child well-being. Therefore, this paper aims to fill in the gaps in the existing literature by quantifying the extent of wealth- and educational-related inequalities in MDD and examining the contribution of explanatory variables to wealth- and educational-related inequalities among infants and young children in Indonesia.
Methods
Data source
We used data from the 2017 Indonesia Demographic and Health Survey (IDHS), nationally representative of the 34 provinces. Provinces are the largest subdivisions in Indonesia, followed by districts/municipalities, subdistricts, and urban/rural villages in the lower administrative units. The survey used a two-stage stratified sampling design. First, primary sampling units or census blocks (CB) were selected by probability proportional to size, where the size is the number of households listed in the 2010 population census. The CB was stratified by rural and urban areas with implicit stratification in each stratum by sorting the CB by the wealth index category. Second, 25 households were selected systematically from each CB. All women aged 15–49 were eligible for individual interviews in these households. The 2017 DHS report provides detailed information on the questionnaires and sampling procedures [Citation34].
Outcome variable
The study outcome, minimum dietary diversity (MDD), assesses the percentage of children 6–23 months of age who have consumed at least five out of eight food groups in the past 24 hours. The food groups include 1) grains, roots, and tubers; 2) legumes and nuts; 3) dairy products; 4) flesh foods; 5) eggs; 6) vitamin A-rich fruits and vegetables; 7) other fruits and vegetables; 8) breastmilk [Citation18]. We coded the answers as either ‘1 = yes, consumed’ or ‘0 = no, not consumed’ [Citation34].
Socioeconomic status
We used two indicators of socioeconomic inequalities: household wealth and maternal education. The wealth index was computed based on household assets using principal component analysis, and the key household assets variables included ownership of infrastructures and amenities. Briefly, the principal component analysis estimates a cumulative wealth score for each household based on its asset [Citation35]. We divided these scores into five quintiles, from the lowest 20% representing the poorest group to the highest 20% representing the richest group. We grouped maternal education into four categories: none or not completed primary school, completed primary school, completed secondary school, and completed higher education.
Contributory factors to socioeconomic inequality in dietary diversity
We selected the contributory factors to socioeconomic inequality in dietary diversity based on our study on MDD determinants in Indonesia. For the present study analysis, we only included significant variables in relation to MDD found in our previous research [Citation23]. These variables included child’s age (6–11 months, 12–17 months, 18–23 months), mother’s education (none or incomplete primary school, completed primary school, completed secondary school, completed higher education), mother’s access to media (none, at least one media), mother’s occupation (not working, agricultural, non-agricultural), father’s occupation (not working, agricultural, non-agricultural), number of ANC visits in the last pregnancy (<4 visits, ≥4 visits), household wealth (poorest, poorer, middle, richer, richest), area of residence (rural, urban), and regions (Java and Bali, Sumatera, Kalimantan, Sulawesi, Eastern Indonesia).
Data analysis
To assess the socioeconomic inequality in dietary diversity, we calculated the concentration index [Citation36], which is a widely used measure of socioeconomic inequality, and is written as:
where h is the health variable in which inequality is measured, is its mean, cov denotes the covariance, and r is the individual’s fractional rank in the distribution of socioeconomic position [Citation33]. The value of the concentration index ranges from −1 to +1. A negative value indicates a disproportionate concentration of MDD among the disadvantaged groups, whereas a positive value indicates a disproportionate concentration of MDD among the advantaged groups. Zero value means the absence of wealth- and education-related inequalities. However, our outcome is a binary variable, the bounds of the concentration index do not extend to −1 and +1, but equal to
and
. Therefore, we normalised the concentration index by dividing its value by its bound as proposed by Wagstaff et al. [Citation37,Citation38]:
We also plotted the concentration curves to display the cumulative proportion of the MDD (y-axis) against the cumulative proportion of the children sorted by their household wealth and maternal education on the x-axis, beginning with the most disadvantaged and ending with the most advantaged groups. The curve that lies above the line of equality indicates that MDD is concentrated among the disadvantaged groups. Conversely, the curve below the equality line suggests that MDD is more concentrated among the advantaged groups. The farther the curve deviates from the line of equality, the greater the degree of inequality [Citation33].
To ascertain the factors contributing to the observed socioeconomic inequalities in dietary diversity, we decomposed the concentration index to measure the explanatory variables’ contribution to wealth- and education-related inequalities in MDD. For a linear additive relationship between MDD (y) and a set of determinants , such as
allows the concentration index for y to be written as:
where is the mean of y,
is the mean of
,
is the concentration index for
(defined analogously to
),
is the elasticity of MDD with explanatory variables, and
is the generalised concentration index for the error term (
). A negative contribution revealed that an independent variable operated towards the pro-poor distribution of MDD. In contrast, a positive contribution indicated that an independent variable worked towards the pro-rich distribution of MDD [Citation33]. In this study, we applied Wagstaff’s correction [Citation37,Citation38] into the equation:
As the outcome’s binary nature, we used a Generalised Linear Model (GLM) with a binomial family and probit link to decompose MDD inequality [Citation39]. In addition, our analysis demonstrated the low level of multicollinearity with a mean of variance inflation factor (VIF) of 1.38. We also performed interaction tests among possible dependent variables (i.e. household wealth, maternal education, father occupation, ANC visits, residency, region), but statistically not significant. We used Stata version 17.0 (StataCorp, College Station, TX) for statistical analysis, with the significance level determined at p < 0.05. We applied the ‘svy’ commands throughout the analyses to adjust the survey design of the IDHS by including sampling weight, strata, and cluster.
Results
Characteristics of the study participants and prevalence of minimum dietary diversity
presents the background characteristics of the study participants and the percentage of children who met the MDD criteria. We included a total of 5038 children aged 6–23 months in the analysis. The overall prevalence of MDD among children 6–23 months was 52.6% (95% CI: 45.6–49.2). The prevalence meeting standards for MDD was higher among children aged 18–23 months (62.7%) and those whose mothers and fathers attained at least a higher educational degree (66.5% and 66.7%, respectively). In addition, we found a wide gap in the proportion of MDD among children across different household wealth categories, with 39.9% in the lowest quintile and 55.3% in the highest quintile. The prevalence of MDD was exceptionally high among children who resided in urban areas (57.2%). Minimum dietary diversity also displayed a remarkable regional difference, ranging from 37.2% in Eastern Indonesia to 55.0% in Java and Bali.
Table 1. Characteristics of the study population and proportions of minimum dietary diversity (weighted n = 5038)
Socioeconomic inequality in minimum dietary diversity
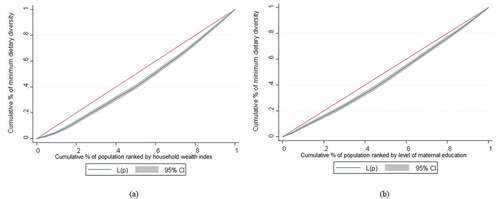
The normalised concentration indices (Cnorm) for MDD among infants and young children aged 6–23 months, ranked by household wealth and maternal education, are estimated at 0.220 and 0.192, respectively (see ). The positive values of Cnorm suggest that children from wealthier households and educated mothers had a more diverse meal. depicts the concentration curves for MDD among infants and young children aged 6–23 months, ranked by household wealth and maternal education. As illustrated, concentration curves lie below the 45-degree line, confirming that the proportion of MDD is higher in children with wealthier households and highly educated mothers.
Table 2. Wagstaff normalised concentration index of minimum dietary diversity by household wealth index and maternal education
Figure 1. (a) Concentration curves of minimum dietary diversity ranked by household wealth index and (b) level of maternal education.
Contribution of the determinants to wealth- and education-related inequality in minimum dietary diversity
summarizes the decomposition analysis results of wealth-and education-related inequality in MDD among children aged 6–23 months in Indonesia. Each column shows the elasticity of MDD, the concentration index, and the absolute and the percentage contributions of each contributor to the MDD concentration index. The elasticity shows how sensitive MDD is to each contributor. We found that MDD is mainly responsive to the child’s age, mother’s education, father’s occupation, and ANC visits.
Table 3. Decomposition of wealth- and education-related inequalities in minimum dietary diversity among Indonesian infants and young children
The Cnorm represents the degree of inequality in MDD for each contributor. As indicated by negative concentration indices, children of mothers with primary education (−0.413), fathers with primary education (−0.425), poorer households (−0.511), rural areas (−0.533), Sulawesi (−0.271) and Eastern Indonesia (−0.563) were highly concentrated among the poorer population. Similarly, children of mothers with primary education (−0.781), unemployed mothers (−0.236), fathers with primary education (−0.496), poorer households (−0.238), and rural areas (−0.290) were concentrated among the less educated population.
shows the contributions of explanatory variables to wealth- and education-related inequalities in MDD. Mother’s education, father’s occupation, ANC visits, and household wealth explain most of the wealth- and education-related inequalities in MDD. The large elasticities of MDD for these contributors are responsible for their considerable contribution to MDD concentration indices. Conversely, there is a notable degree of wealth- and education-related inequalities in the father’s education and residency, but there is a minor sensitivity of MDD to variation in these contributors, thus making a small contribution to MDD concentration indices. Furthermore, considering that each contribution is the product of the sensitivity of MDD for that factor and the degree of wealth- and education-related inequalities in that factor, the positive or negative value of the contributor comes from the positive or negative elasticity or concentration index. For example, the contributions of being 12–17 months and 18–23 months old, having mothers with primary school, having unemployed mothers, having fathers with secondary school, belonging to poorer and middle economic status, residing in rural areas and residing in Kalimantan are negative. The negative contributions are derived from the negative elasticity or concentration index of these factors.
depicts the percentage contribution of the explanatory variables to wealth- and education-related inequalities. For wealth-related inequality in MDD, the largest contributor was household wealth (29.8%), followed by ANC visits (16.6%), paternal occupation (15.1%), and maternal education (11.8%). Similarly, the largest contributions toward education-related inequality in MDD included maternal education (26.1%), household wealth (19.1%), ANC visits (14.9%), and paternal occupation (10.9%). On the other hand, the child’s age, maternal employment, maternal access to media, paternal education, residency, and geographical regions showed minimal or no contribution to wealth- and education-related inequality in MDD. Overall, these variables explained nearly 76.8% and 70.2% of the wealth- and education-related inequalities in MDD.
Figure 2. (a) Concentration curves of minimum dietary diversity ranked by household wealth index and (b) level of maternal education.
Discussion
This study is the first to examine the extent of wealth- and education-related inequalities in MDD among infants and young children and decomposed them into contributing factors in Indonesia. The study found that the proportion of children who had met the WHO’s minimum dietary diversity criteria was more concentrated among children from wealthier households and those born to mothers with higher educational attainment. Household wealth, mother’s education, father’s occupation, and ANC visits mainly contributed to the pro-rich and pro-educated socioeconomic inequalities in MDD.
Our result of pro-rich wealth-related inequalities in MDD was in line with previous studies [Citation28,Citation32]. Although no study has assessed education-related inequality in MDD, the distribution of infant and young child feeding indicators was higher among mothers with higher education in several studies [Citation40,Citation41]. However, these findings do not imply that eating a diversified diet does not occur among children from poorer families and less-educated mothers. Instead, it revealed MDD is disproportionately concentrated among the richer and educated population.
We found that household wealth was the predominant contributor to the wealth- (29.8%) and education-related (19.1%) inequalities in MDD. Similarly, earlier studies in Ethiopia [Citation31] and Zimbabwe [Citation32] have shown that household economic status was the main factor explaining socioeconomic disparities in MDD. Since dietary diversity is associated with the availability, access and utilisation of food, wealthier households are more likely to have enough resources to consume varied and nutritious food [Citation42]. They have greater affordability to purchase non-staple foods, leading to improved dietary diversity [Citation41,Citation43]. At the same time, they also have better access to health care and information [Citation44], thus applying the recommended feeding practices. Interventions that improve food purchasing power, such as income-generating strategies (e.g. homestead food production) and cash transfers, would help reduce the economic barriers to accessing a diversified diet [Citation45–47]. In addition, infant and young child feeding promotions should be made available to all mothers and their children, especially those with lower economic status.
Of all the mother’s factors, maternal education is the most significant contributor to the wealth- (11.8%) and education-related (26.1%) inequalities in MDD. Although there has been no study examining the contribution of maternal education in the MDD inequalities, several studies have highlighted the contribution of this factor in explaining the disparities in child undernutrition [Citation48–50]. The role of maternal education in improving child dietary diversity could be due to higher dietary knowledge [Citation24,Citation43,Citation51] and better health literacy, dietary information-seeking behaviour, understanding, and critical thinking skills related to nutritional information [Citation52]. Between 2002 and 2017, senior high school enrollment in Indonesia rose considerably from 50% to 71%. However, there was a 25% discrepancy in school enrollment between the poorest and wealthiest quintiles in the latest year. Moreover, 29% of these students did not complete their studies for various reasons, including insufficient funds, participation in the labour force, distance, marriage, and taking care of households for girls [Citation53]. Thus, there is a need to narrow the gap in formal education participation across economic status, geographical regions, and gender [Citation54], especially at the secondary and higher degree levels, for a long term investment in child nutrition. Governments should commit to encouraging school participation, for example, providing pro-poor incentives (e.g. cash transfers, food-for-education), decentralizing education to the district/municipality level, and developing alternative learning programs (e.g. non-formal education) [Citation55]. Such initiatives should be designed to include people from marginalized communities, regardless of gender or ethnicity.
We also found that ANC visits had a distinct contribution to wealth- (16.6%) and education-related (14.9%) inequalities in MDD. Counselling received from the health practitioners during the visit, followed by appropriate practice, may lead to feeding children with a diversified diet [Citation56]. In Indonesia, 96% of pregnant women had access to ANC services in 2018. However, only 74% met at least four ANC visits, ranging from 44% in Papua to 90% in Yogyakarta and 58% among women without formal education to 83% among women with a higher degree [Citation2]. Increasing maternal awareness about ANC service by targeting the most vulnerable community is vital [Citation50]. While the National Health Insurance (NHI) covers the ANC service fee, there is also a need to expand the NHI coverage to reduce sociodemographic inequalities in access to maternal and health services [Citation57].
Our study also revealed that paternal occupation explained wealth- (15.1%) and education-related (10.9%) inequalities in MDD. Household head employment was associated with dietary diversity as it could determine the earnings [Citation42]. However, Indonesian agriculture jobs dominated by small-scale farmers remain struggling with low incomes [Citation58]. Such income disparities may increase the risk of food insecurity, making it difficult for them to afford healthy diets [Citation59]. In addition to increasing crop production, a study in Bangladesh suggested that farmers could cover their household food expenses by seeking off-farm income. Thus, there is a need for policy support in agricultural development (e.g. best agronomic practices, access to information and credit, infrastructure investment) and off-farm income generating for smallholder farmers to achieve food security and lift them out of poverty [Citation60]. In addition, there is much to learn from Tanzania, where nutrition-sensitive agriculture and agroecology interventions among food-insecure smallholder farmers have improved sustainable agricultural practices and women’ empowerment in income allocation, which could enhance household food security and children’s dietary diversity [Citation61].
The development of nutrition education to improve a diversified diet in Indonesia began with the ‘Healthy Four Perfect Five’ (Empat Sehat Lima Sempurna) campaign. However, although this slogan encouraged people to eat various food groups (staples, plant- and animal-protein source food, fruits, vegetables), the value of milk as the ‘perfect’ food has been exaggerated. Milk mainly was not locally produced and costly, making it available only for the rich [Citation62]. The most updated guideline, Guide for Balanced Nutrition, also encourages the population to eat a diversified diet by carrying a message of ‘be grateful and enjoy various food’. Nevertheless, this guideline is less socialized and implemented. Perhaps because of its simplicity, some industries and communities continue to use the old ‘Healthy Four Perfect Five’ [Citation59]. Although the newest guideline has been developed for all populations across all ages, including children five years [Citation63], some recommendations should follow the global indicators for infant and young child feeding practices, including minimum dietary diversity. Practical and straightforward messages may help communities adopt new nutritional information [Citation64]. Health practitioners should adequately promote the nutrition guidelines by including locally available food [Citation65] and pricing information [Citation66] during all contact with mothers and young children, such as antenatal and postnatal care. Nutrition counselling and education should occur in multiple settings, involve local human resources, and reach out to mothers regardless of their socioeconomic backgrounds to ease disparities.
Strengths and limitations
To our knowledge, this is the first study in Indonesia to measure both wealth- and education-related inequalities in MDD and to decompose the inequality by a set of contributing factors. The study used a nationally representative sample to generalise the findings to children aged 6–23 months in Indonesia. The use of the WHO’s most updated MDD indicator is helpful for ongoing monitoring and comparing with international guidelines [Citation18]. However, MDD is constructed based on the single 24-hour food recall during the survey, thus not reflecting the actual feeding patterns [Citation67]. While the decomposition analysis enables us to understand various factors contributing to the inequality in MDD, we could not draw a causal inference [Citation33]. This issue also occurs when using cross-sectional data.
Conclusions
The present study provided evidence on substantial wealth- and education-related inequalities in the MDD proportion among infants and young children in Indonesia. The overall findings of this study urge the need for multisectoral approaches to addressing the underlying causes of socioeconomic inequalities in MDD. We should prioritise children of poorer households and less educated mothers. Improving access and the quality of prenatal and postnatal health care is beneficial for delivering health-facility-based nutrition education. Nutrition-sensitive agriculture interventions may improve diet diversity through food production and income-generating. While there is a national recommendation on Balanced Nutrition Guideline, there is no evidence of whether the promotion of this guideline benefits infant and young child feeding and this issue requires further research. Finally, examining the changes of inequalities in MDD over time is vital for improving child nutrition outcomes in Indonesia.
Author contributions
BAP, TMH, and MJD designed the study. BAP conducted the data analysis and interpreted the data under the guidance of TMH. BAP drafted the initial manuscript under the supervision of TMH and MJD. TMH, MJD, and AA read and revised the manuscript. All authors approved the final manuscript draft.
Ethics and consent
The ICF International Review Board (IRB) ethically approved the 2017 IDHS to ensure compliance with the US Department of Health and Human Services requirements for the ‘Protection of Human Subjects’ (45 CFR 46) and the host country’s IRB, with written informed consent obtained from all participants during the survey. DHS granted the first author permission to use the data.
Paper context
While earlier studies have documented evidence on the determinants of minimum dietary diversity, very few have evaluated the magnitude and drivers of socioeconomic disparities in minimum dietary diversity. This paper provides evidence on wealth- and education-related inequalities in minimum dietary diversity among infants and young children in Indonesia. Our findings support calls for greater equality of wealth, education, and health care to close gaps in child nutrition.
Acknowledgments
The lead author (BAP) conducted this research and publication as part of her doctoral study, for which she highly acknowledged the Indonesia Endowment Fund for Education (LPDP) for providing a scholarship.
Disclosure statement
No potential conflict of interest was reported by the author(s).
Additional information
Funding
References
- World Health Organization, United Nations Children’s Fund, World Bank. Levels and trends in child malnutrition: UNICEF/WHO/The World Bank Group joint child malnutrition estimates: key findings of the 2021 edition. 2021 [cited 2021 Dec 24]. Available from: https://www.who.int/publications/i/item/9789240025257
- National Institute of Health Research and Development, Ministry of Health of Indonesia. The 2018 basic health research (Riskesdas) report. 2019 [cited 2019 Sep 17]. Available from: http://labdata.litbang.kemkes.go.id/images/download/laporan/RKD/2018/Laporan_Nasional_RKD2018_FINAL.pdf
- World Health Organization. Comprehensive implementation plan on maternal, infant and young child nutrition. 2014 [cited 2019 Sep 17]. Available from: https://apps.who.int/iris/bitstream/handle/10665/113048/WHO_NMH_NHD_14.1_eng.pdf
- World Health Organization, United Nations Children’s Fund. Global nutrition monitoring framework: operational guidance for tracking progress in meeting targets for 2025. 2017 [cited 2019 Sep 17]. Available from: https://www.who.int/publications/i/item/9789241513609
- Dewey KG. Reducing stunting by improving maternal, infant and young child nutrition in regions such as South Asia: evidence, challenges and opportunities. Matern Child Nutr. 2016;12:27–11.
- Arimond M, Ruel MT. Dietary diversity is associated with child nutritional status: evidence from 11 demographic and health surveys. J Nutr. 2004;134:2579–2585.
- Ruel MT. Operationalizing dietary diversity: a review of measurement issues and research priorities. J Nutr. 2003;133:3911S–3926S.
- Arsenault JE, Yakes EA, Islam MM, et al. Very low adequacy of micronutrient intakes by young children and women in rural Bangladesh is primarily explained by low food intake and limited diversity. J Nutr. 2012;143:197–203.
- Khamis AG, Mwanri AW, Ntwenya JE, et al. The influence of dietary diversity on the nutritional status of children between 6 and 23 months of age in Tanzania. BMC Pediatr. 2019;19:518.
- Krasevec J, An X, Kumapley R, et al. Diet quality and risk of stunting among infants and young children in low- and middle-income countries. Matern Child Nutr. 2017;13:e12430.
- Perkins JM, Jayatissa R, Subramanian SV. Dietary diversity and anthropometric status and failure among infants and young children in Sri Lanka. Nutrition. 2018;55-56:76–83.
- Baye K, Kennedy G. Estimates of dietary quality in infants and young children (6–23 mo): evidence from demographic and health surveys of 49 low- and middle-income countries. Nutrition. 2020;78:110875.
- Belachew A, Tewabe T. Under-five anemia and its associated factors with dietary diversity, food security, stunted, and deworming in Ethiopia: systematic review and meta-analysis. Syst Rev. 2020;9:31.
- Visser M, Van Zyl T, Hanekom SM, et al. Associations of dietary diversity with anaemia and iron status among 5- to 12-year-old schoolchildren in South Africa. Public Health Nutr. 2021;24:2554–2562.
- Thorne-Lyman AL, Shrestha M, Fawzi WW, et al. Dietary diversity and child development in the far west of Nepal: a cohort study. Nutrients. 2019;11:1799.
- Zhao C, Guan H, Shi H, et al. Relationships between dietary diversity and early childhood developmental outcomes in rural China. Matern Child Nutr. 2021;17:e13073–e13073.
- Martorell R. Improved nutrition in the first 1000 days and adult human capital and health. Am J Hum Biol. 2017;29:e22952.
- World Health Organization, United Nations Children’s Fund. Indicators for assessing infant and young child feeding practices: definitions and measurement methods. 2021 [cited 2021 Apr 28]. Available from: https://www.who.int/publications/i/item/9789240018389
- Na M, Aguayo VM, Arimond M, et al. Stagnating trends in complementary feeding practices in Bangladesh: an analysis of national surveys from 2004-2014. Matern Child Nutr. 2018;14:e12624.
- Ogbo FA, Ogeleka P, Awosemo AO. Trends and determinants of complementary feeding practices in Tanzania, 2004–2016. Trop Med Health. 2018;46:40.
- Sekartaji R, Suza DE, Fauziningtyas R, et al. Dietary diversity and associated factors among children aged 6–23 months in Indonesia. J Pediatr Nurs. 2021;56:30–34.
- Eshete T, Kumera G, Bazezew Y, et al. Determinants of inadequate minimum dietary diversity among children aged 6–23 months in Ethiopia: secondary data analysis from ethiopian demographic and health survey 2016. Agric Food Sec. 2018;7:66.
- Paramashanti BA, Huda TM, Alam A, et al. Trends and determinants of minimum dietary diversity among children aged 6–23 months: a pooled analysis of Indonesia demographic and health surveys from 2007 to 2017. Public Health Nutr. 2021;1–12. DOI:10.1017/S1368980021004559
- Ahmed KY, Page A, Arora A, et al. Trends and factors associated with complementary feeding practices in Ethiopia from 2005 to 2016. Matern Child Nutr. 2020;16:e12926.
- Na M, Aguayo VM, Arimond M, et al. Trends and predictors of appropriate complementary feeding practices in Nepal: an analysis of national household survey data collected between 2001 and 2014. Matern Child Nutr. 2018;14:e12564.
- Harvey CM, Newell M-L, Padmadas SS. Socio-economic differentials in minimum dietary diversity among young children in South-East Asia: evidence from demographic and health surveys. Public Health Nutr. 2018;21:3048–3057.
- Sebayang SK, Dibley MJ, Astutik E, et al. Determinants of age-appropriate breastfeeding, dietary diversity, and consumption of animal source foods among Indonesian children. Matern Child Nutr. 2020;16:e12889.
- Gatica-Domínguez G, Neves PAR, Barros AJD, et al. Complementary feeding practices in 80 low- and middle-income countries: prevalence of and socioeconomic inequalities in dietary diversity, meal frequency, and dietary adequacy. J Nutr. 2021;151:1956–1964.
- World Bank. Indonesia’s rising divide. 2016 [cited 2019 Nov 5]. Available from: https://openknowledge.worldbank.org/handle/10986/24765
- Wicaksono E, Amir H, Nugroho A. The sources of income inequality in Indonesia: a regression-based inequality decomposition. ADBI Working Paper 667. 2017 [cited 2019 Sep 17]. Available from: https://www.adb.org/publications/sources-income-inequality-indonesia
- Hirvonen K. Rural–urban differences in children’s dietary diversity in Ethiopia: a poisson decomposition analysis. Econ Lett. 2016;147:12–15.
- Lukwa AT, Siya A, Zablon KN, et al. Socioeconomic inequalities in food insecurity and malnutrition among under-five children: within and between-group inequalities in Zimbabwe. BMC Public Health. 2020;20:1199.
- O’Donnell O, Van Doorslaer E, Wagstaff A, et al. Analyzing health equity using household survey data: a guide to techniques and their implementation. 2008 [cited 2019 Sep 17]. Available from: http://documents1.worldbank.org/curated/en/633931468139502235/pdf/424800978011OFFICIAL0USE0ONLY10.pdf
- National Population and Family Planning Board (BKKBN), Statistics Indonesia (BPS), Ministry of Health (Kemenkes), ICF International. Indonesia demographic and health survey 2017. 2018 [cited 2019 Nov 5]. Available from: http://dhsprogram.com/pubs/pdf/FR342/FR342.pdf
- Rutstein SO, Johnson K. The dhs wealth index: dhs comparative reports no. 6. 2004 [cited 2019 Sep 17]. Available from: https://dhsprogram.com/publications/publication-cr6-comparative-reports.cfm
- O’Donnell O, O’Neill S, Van Ourti T, et al. Conindex: estimation of concentration indices. Stata J. 2016;16:112–138.
- Wagstaff A. The bounds of the concentration index when the variable of interest is binary, with an application to immunization inequality. Health Econ. 2005;14:429–432.
- Wagstaff A. The concentration index of a binary outcome revisited. Health Econ. 2011;20:1155–1160.
- Yiengprugsawan V, Lim LLY, Carmichael GA, et al. Decomposing socioeconomic inequality for binary health outcomes: an improved estimation that does not vary by choice of reference group. BMC Res Notes. 2010;3:57.
- Neves PAR, Barros AJD, Gatica-Domínguez G, et al. Maternal education and equity in breastfeeding: trends and patterns in 81 low- and middle-income countries between 2000 and 2019. Int J Equity Health. 2021;20:20.
- Anane I, Nie F, Huang J. Socioeconomic and geographic pattern of food consumption and dietary diversity among children aged 6-23 months old in Ghana. Nutrients. 2021;13:603.
- Obayelu OA, Osho FR. How diverse are the diets of low-income urban households in Nigeria? J Agric Food Res. 2020;2:100018.
- Ali NB, Tahsina T, Hoque DME, et al. Association of food security and other socio-economic factors with dietary diversity and nutritional statuses of children aged 6-59 months in rural Bangladesh. PLoS One. 2019;14:e0221929–e0221929.
- Shifti DM, Chojenta C, Holliday EG, et al. Socioeconomic inequality in short birth interval in Ethiopia: a decomposition analysis. BMC Public Health. 2020;20:1504.
- Yuan B, Målqvist M, Trygg N, et al. What interventions are effective on reducing inequalities in maternal and child health in low- and middle-income settings? A systematic review. BMC Public Health. 2014;14:634.
- Durao S, Visser ME, Ramokolo V, et al. Community‐level interventions for improving access to food in low‐ and middle‐income countries. Cochrane Database Sys Rev. 2020;7:CD011504.
- Nair MK, Augustine LF, Konapur A. Food-based interventions to modify diet quality and diversity to address multiple micronutrient deficiency. Front Public Health. 2016;3:277.
- Singh SK, Srivastava S, Chauhan S. Inequality in child undernutrition among urban population in India: a decomposition analysis. BMC Public Health. 2020;20:1852.
- Mohammed SH, Muhammad F, Pakzad R, et al. Socioeconomic inequality in stunting among under-5 children in Ethiopia: a decomposition analysis. BMC Res Notes. 2019;12:184.
- Huda TM, Hayes A, El Arifeen S, et al. Social determinants of inequalities in child undernutrition in Bangladesh: a decomposition analysis. Matern Child Nutr. 2018;14:e12440.
- Solomon D, Aderaw Z, Tegegne TK. Minimum dietary diversity and associated factors among children aged 6-23 months in Addis Ababa, Ethiopia. Int J Equity Health. 2017;16:181.
- Xu Y, Zhu S, Zhang T, et al. Explaining income-related inequalities in dietary knowledge: evidence from the China health and nutrition survey. Int J Environ Res Public Health. 2020;17:532.
- World Bank. The promise of education in Indonesia. 2020 [cited 2021 Sep 17]. Available from: https://documents1.worldbank.org/curated/en/658151605203420126/pdf/The-Promise-of-Education-in-Indonesia.pdf
- Suwarno P, editor Equality in education and employment for sustainable development of diverse Indonesia: enhancing equal opportunity, volunteerism, and philanthropy. In: Proceeding of the 1st Non-Formal Education International Conference (NFEIC 2018); 2018 Aug 2–3; West Sumatera, Indonesia. Dordrecht (Netherlands): Atlantis Press; 2019.
- Shanker A, Marian D, Swimmer C. Effective interventions aimed at reaching out-of-school children: a literature review. 2015 [cited 2022 Jan 9]. Available from: https://files.eric.ed.gov/fulltext/ED573790.pdf
- Aemro M, Mesele M, Birhanu Z, et al. Dietary diversity and meal frequency practices among infant and young children aged 6–23 months in Ethiopia: a secondary analysis of Ethiopian demographic and health survey 2011. J Nutr Metab. 2013;2013:782931.
- Anindya K, Lee JT, McPake B, et al. Impact of Indonesia’s national health insurance scheme on inequality in access to maternal health services: a propensity score matched analysis. J Glob Health. 2020;10:010429.
- Karmini K, Karyati K. The various sources of household income of paddy farmers in east kalimantan, Indonesia. Biodiversitas. 2018;19:357–363.
- FAO, IFAD, UNICEF, WFP, WHO. The state of food security and nutrition in the world 2021. Transforming food systems for food security, improved nutrition and affordable healthy diets for all. 2021 [cited 2021 Sep 17]. Available from: http://www.fao.org/documents/card/en/c/cb4474en
- Emran S-A, Krupnik TJ, Aravindakshan S, et al. Factors contributing to farm-level productivity and household income generation in coastal Bangladesh’s rice-based farming systems. PLoS One. 2021;16:e0256694.
- Santoso MV, Bezner Kerr RN, Kassim N, et al. A nutrition-sensitive agroecology intervention in rural Tanzania increases children’s dietary diversity and household food security but does not change child anthropometry: results from a cluster-randomized trial. J Nutr. 2021;151:2010–2021.
- Soekirman S. Taking the Indonesian nutrition history to leap into betterment of the future generation: development of the Indonesian nutrition guidelines. Asia Pac J Clin Nutr. 2011;20:447–451.
- Ministry of Health of Indonesia. Regulation of the ministry of health on balanced nutrition guideline number 41 in 2014. 2014 [cited 2019 Sep 17]. Available from: https://peraturan.bpk.go.id/Home/Details/119080/permenkes-no-41-tahun-2014
- Effendy DS, Prangthip P, Soonthornworasiri N, et al. Nutrition education in Southeast Sulawesi province, Indonesia: a cluster randomized controlled study. Matern Child Nutr. 2020;16:e13030–e13030.
- Kuchenbecker J, Reinbott A, Mtimuni B, et al. Nutrition education improves dietary diversity of children 6-23 months at community-level: results from a cluster randomized controlled trial in Malawi. PLoS One. 2017;12:e0175216–e0175216.
- Bessems KMHH, Linssen E, Lomme M, et al. The effectiveness of the good affordable food intervention for adults with low socioeconomic status and small incomes. Int J Environ Res Public Health. 2020;17:2535.
- Shim J-S, Oh K, Kim HC. Dietary assessment methods in epidemiologic studies. Epidemiol Health. 2014;36:e2014009–e2014009.
