
 ?Mathematical formulae have been encoded as MathML and are displayed in this HTML version using MathJax in order to improve their display. Uncheck the box to turn MathJax off. This feature requires Javascript. Click on a formula to zoom.
ABSTRACT
Background
In low- and middle-income countries, the double burden of malnutrition is prevalent. Many countries in Africa are currently confronted with overweight and obesity, particularly among women, coupled with an increase in the prevalence of non-communicable diseases.
Objective
This study examines trends in overweight and obesity among Ethiopian women of reproductive age from 2005 to 2016, and identifies associated factors.
Methods
We used three consecutive datasets from 2005 (n = 14070), 2011 (n = 16515), and 2016 (n = 15683) demographic health survey years. Multilevel logistic regression was used to identify the determinant factors among individual- and cluster-level variables.
Results
The prevalence of overweight and obesity among reproductive women in Ethiopia increased steadily from 6.09% in 2005 to 8.54% in 2011, and 10.16% in 2016. However, mixed patterns were observed among the regions of the country. We found that age, education, living in urban areas, and living in a rich community are associated with becoming overweight and obese. For instance, the odds of becoming overweight and obese among women aged 35–49 were higher than those among women aged 15–24 (odds ratio [OR] = 3.62, 95% Confidence Interval [CI]:2.64–4.97). Women who completed secondary school have higher odds than those without formal education (OR = 1.64, 95% CI:1.19–2.26).
Conclusion
To our knowledge, this is the first study to investigate trends in the nationwide prevalence of overweight and obesity and the associated factors among Ethiopian women. This study warrants further follow-up research to identify the pathways between overweight and obesity and their probable factors.
Paper context
Main findings: The trend in the prevalence of overweight and obesity among the reproductive age women in Ethiopia showed a steady rise.
Added knowledge: This study filled the research gap by analyzing the trend in the prevalence and the regional variation of overweight and obesity in the country.
Global health impact for policy and action: The findings will help design appropriate policies that address the varying trends and prevalence in overweight and obesity among regions as well as the associated factors.
Responsible Editor Jennifer Stewart Williams
Background
Obesity is a pressing global public health issue [Citation1]. Over the past three decades, the prevalence of obesity has doubled or tripled in many countries, most likely due to sedentary lifestyles, urbanization, and the rising consumption of processed foods with high calorie content [Citation2]. According to the World Health Organization (WHO), overweight and obesity are defined as abnormal or excessive fat accumulation that may impair health [Citation3]. In 2016, an estimation of more than 1.9 billion adults worldwide were overweight. Among which over 650 million were obese globally [Citation3]. In 2021, WHO reported that as a result of overweight and obesity, at least 2.8 million people are dying each year [Citation4]. Moreover, overweight and obesity are significant risk factors for coronary heart disease, hypertension, stroke, type 2 diabetes, dyslipidemia, cancer, and other untreated non-communicable diseases (NCDs) [Citation5–8]. Globally, approximately 120 million disability-adjusted life years (DALY) and 4.0 million deaths are attributed to overweight and obesity [Citation9]. Although considered once as a sign of wealth and prosperity, being overweight and obese are now widely recognized as severe health problems, particularly those who are in low and lower-middle-income countries [Citation10,Citation11]. In addition, eight out of ten countries that contribute to more than 50% of the world’s obesity (671 million obese people) are low- and middle-income countries, namely, Brazil, Russia, India, China, Egypt, Indonesia, Mexico, and Pakistan [Citation12]. These countries are experiencing a rapid increase in NCD risk factors, while also struggling to deal with infectious diseases and undernutrition in rural areas [Citation13]. The ‘double burden’ of this disease is pronounced in many low-income and middle-income countries.
Similarly, many countries in Africa are currently confronted with overweight and obesity, particularly among women, coupled with an increase in the prevalence of NCDs [Citation14,Citation15]. In Africa, the prevalence of obesity among women is approximately double that of men [Citation16]. This is particularly true in urban areas. The prevalence of overweight and obesity among women of reproductive age was 87% in South Africa, 74.1% in Tanzania, 66.7% in Nigeria, and 57.4% in Uganda [Citation17]. According to a review conducted in Ethiopia, the most common risk factors for NCDs are overweight and obesity [Citation18]. The prevalence of overweight and obesity has increased in Ethiopia [Citation19,Citation20]. Other studies reported that the prevalence of overweight and obesity is high among women of reproductive age in Ethiopia [Citation21–23]. In addition, education is a substantial individual-level factor that determines the prevalence of overweight and obesity in a country [Citation24–26]. Place of residence has also been identified as a substantial contextual factor in determining overweight and obesity [Citation24,Citation25]. However, these studies did not perform a trend analysis of the prevalence of overweight and obesity among women of reproductive age living in rural and urban areas [Citation24–26]. To the best of our knowledge, studies examining the trends in overweight and obesity among women of reproductive age across Ethiopia using longitudinal datasets are scarce. Therefore, this study aimed to explore temporal trends in the prevalence of overweight and obesity and their associated factors among women of reproductive age in Ethiopia. Understanding temporal trends in the prevalence of overweight and obesity and their associated factors will have important implications for preventing and controlling emerging public health challenges in Ethiopia.
To date, five Ethiopian demographic health surveys (DHS) have been conducted, including the 2019 Ethiopia Mini DHS (EMDHS). The first survey was conducted in 2000. However, because of the unavailability of the necessary indicator (body mass index [BMI] measurement) in the original dataset of the survey years, 2000 and 2019, we could only analyze the data from the other three surveys (2005, 2011, and 2016). The primary objective of this study was to investigate the trends and factors associated with being overweight and obese among women of reproductive age in Ethiopia from 2005 to 2016. The specific objectives of this study were (1) to assess the trends in the prevalence of overweight and obesity among non-pregnant and non-postpartum women aged 15–49 years in Ethiopia from 2005 to 2016, (2) to explore the regional patterns in the time trend of the prevalence of overweight and obesity, and (3) to identify the major individual- and regional-level determinants of the prevalence of overweight and obesity.
Methods
Study area
Ethiopia is located in the northeastern part of Africa, known as the Horn of Africa, and lies between 30 and 150 °N latitudes and 330 and 480 °E longitudes. The country is divided into 10 regions (killils): Afar, Amhara, Benishangul-Gumuz, Gambella, Harai, Oromiya, Southern Nations, Nationalities, and People’s Region (SNNPR), Somali, Tigray, and the recently added one (Sidama), and two city administrations, Addis Ababa and Dire Dawa. However, as the Ethiopian demographic and health surveys (EDHS) dataset used in this study did not provide data for the Sidama region, we did include this region in our analysis. Ethiopia shares boundaries with Eritrea in the north, Sudan and South Sudan in the west, Kenya in the south with Kenya, and Djibouti and Somalia in the east.
Ethiopian demographic and health surveys 2005–2016
We used data from the EDHS for three consecutive survey years (2005, 2011, and 2016). The EDHS is a population-based cross-sectional survey conducted across Ethiopia. The sample selection was conducted using a two-stage stratified cluster sampling procedure. In the first stage, enumeration areas (EAs), which are geographic areas consisting of convenient numbers of dwelling units serving as counting units for the census, were selected from the nine regions and Dire Dawa city administration except Addis Ababa (entirely urban). An EA is a geographic area of 200–300 households that serves as a counting unit for the census [Citation27]. The EAs were chosen from a list authorized by the Ethiopian Central Statistics Agency as a sampling framework for the Population and Household Census (PHC). The second stage involved selecting a specified number of households from each EA or cluster using a systematic sampling technique. Details of the sampling design can be found in the EDHS reports for successive survey years [Citation28–30].
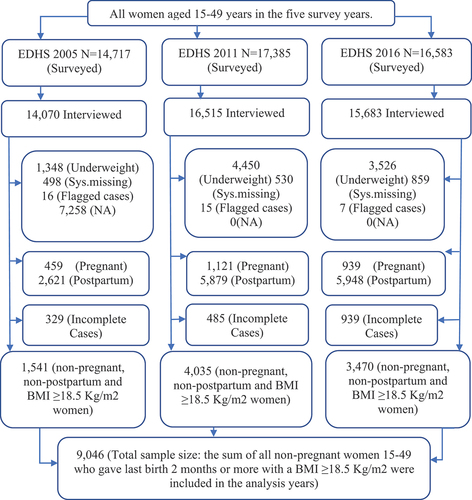
The three EDHSs surveyed 14,070, 16515, and 15,683 women of reproductive age (15–49 years) in 2005, 2011, and 2016, respectively. All women 15–49 years old who were eligible for the surveys were selected for the woman’s questionnaire, which collected data on BMI and other issues. The surveys were conducted from 27 April to 30 August 2005; 27 December 2010, to 3 June 2011; and 18 January 2016, to 27 June 2016. To extract the working dataset, we first eliminated underweight women and those with missing, flagged, or unavailable data. Next, to prevent potential weight gain related to pregnancy, we excluded non-pregnant and non-postpartum women. As a result, 459, 1,121, and 939 pregnant women were removed from the 2005, 2011, and 2016 surveys, respectively, and 2,621,5,879, and 5,948 postpartum women were removed from the 2005, 2011, 2016, and 2015 surveys, respectively. Finally, incomplete data were excluded from each survey year. The screened subtotal sample sizes for each survey year were 1,541 in 2005, 4,035 in 2011, and 3,470 in 2016. Consequently, we considered a total sample size of 9,046 non-pregnant and non-postpartum women. shows this information.
Figure 1. Flow chart for the selection of study participants.
Statistical analysis
Factors of analysis
Dependent variable
The primary focus of our study was the prevalence of overweight and obesity among women of reproductive age, excluding those who were pregnant or postpartum. This measure was derived from the numerical variable ‘body mass index for respondent’ based on WHO standards: 1) underweight (BMI: less than 18.50), 2) normal (BMI: 18.50–24.99), 3) overweight (25.00–29.99) and 4) obese (BMI: greater than 30.00) [Citation31]. Subsequently, we aggregated these variables to create another categorical variable with two categories (normal, overweight, and obese).
Independent variables
Using the EDHS, the choice of independent variables was based on previous studies and their presence in the dataset. These variables are generally classified as individual- and regional-level variables. Some variables are transformed, recategorized and coded again to fit into the multilevel analysis.
The individual level
At the individual level, we categorized women based on various factors: age of women (generated from the variable ‘current age of respondent’) is recategorized as 15–25, 25–34, and 35–49, women’s education level (no education, primary education, secondary education, and higher education), women’s religion (Orthodox, Catholic, Protestant, Muslim, Traditional and other), contraceptive use (no method, folkloric method, traditional, and modern method), marital status (recategorized as: in a union, not in a union), women work status (has work, has no work), household wealth index (recategorized as: poorest or poorer, middle, and richer or richest), media access (listening radio, reading newspaper/magazine, and watching television), parity (the number of children a woman has) and partners education.
The regional-level
We used the two variables region, place of residence and survey years directly from the dataset, but transform and aggregate, recategorize and recode the individual-level variables (education level and wealth status) to obtain the other two regional-level variables, namely, community women education level, and community women’s wealth status.
To obtain the regional-level educational status, we combined the individual-level educational status by calculating the percentage of non-pregnant and non-postpartum women who had completed at least primary school at the regional level and classified this variable as high (>50%) or low (≤50%). Similarly, we first aggregate the individual wealth index categorical variables to obtain the regional wealth index by calculating the mean wealth index at the regional level. We classified communities with a wealth index below the mean value as poor. Similarly, a community with a wealth index above the mean value, is classified as rich. The variable region represents nine administrative regions: Tigray, Afar, Amhara, Oromia, Somali, Benishangul-Gumuz, the South National Nationalities People’s Region (SNNPR), and two city administrations (Addis Ababa and Dire Dawa). The place of residence indicated whether the respondent lived in an urban or rural area. It determines a person’s access to services, information about health, and other aspects of life [Citation30].
Data analysis
To analyze the trends in the prevalence of overweight and obesity and the associated factors in each survey year, our outcome of interest (indicator) was the prevalence of overweight and obesity. The DHS provided a weighting factor. Weighting was used because of possible disparities in response rates and the non-proportional allocation of the sample to different regions, including urban and rural areas. A complex survey sampling technique was used to analyze the weighted data. We conducted significance tests and associations between the response and explanatory variables based on these assumptions. To quantify the significant associations, OR with 95% confidence interval [CI] was used.
The time trend regional variation in prevalence of overweight and obesity
To investigate regional variations in time trends, we used descriptive statistics that showed the percentages of overweight and obesity prevalence in each region in a specific year. To elaborate on the regional variation and the trend during the study period, we calculated the percentage point (pp) change in 2005−2011, 2011−2016, and 2005–2016. Moreover, we display regional variations and trends in the graphs.
Factors associated with prevalence of overweight and obesity
To identify the major factors determining the prevalence of overweight and obesity, we employed a multi-level mixed effect logistic regression analysis using the R software version (4.1.2 (1 November 2021)). In the process of our analysis to assess the association between the dependent and independent variables of the study we used two-level bivariate mixed-effect logistic regression. In the final multi-level mixed effect logistic regression model, we included categorical variables with a p value of < 0.25 and used the estimated log odds ratio with a 95% CI to declare whether the variable was an independent variable. Statistical significance was set at p < 0.05. To select the best-fitting model, we constructed four consecutive models and evaluated their Akaike Information Criterion (AIC) and Bayesian information criterion (BIC) values. The first model was the intercept only (null/empty model), and no explanatory or exposure variables were included to show the total variance between communities. The second was a fixed effects model encompassing all individual-level variables that were initially significant, with a p value of < 0.25. The third model is a random-effects model, which has only regional-level variables. The final/fourth model is a mixed-effect model with individual-level variables (fixed effect) and regional-level variables (random effect). The model used for the analysis is as follows:
Where i and j are the individual (Level 1) and community (Level 2) units, respectively. Pij is the probability of the outcome of interest for woman i in community j; Bs are the fixed coefficients (AOR); x and X represent the individual- and regional-level independent variables, respectively; U indicates the random effects for the jth community; and ε shows the unmeasured factors that may influence the primary outcome of interest.
Descriptive statistics were used to analyze the means, standard deviations, proportions, and percentages of the study variables. To assess individual variation, we analyzed the fixed effect using an adjusted odds ratio along with 95% confidence intervals (CI), whereas for regional-level (random effect), we computed the intraclass correlation coefficient (ICC) value to examine the clustering effect and the degree to which the unexplained variance of the empty model is explained by the regional-level factors using the following statistical formula:
where and
indicate the regional- and individual-level variances, respectively. Individual-level variance
is a fixed value of
.
The goodness of fit of the adjusted final model was estimated using the AIC and BIC statistics and checked using a log-likelihood test compared to the preceding models. The smaller the values of AIC and BIC, the better the model fit. In addition, any interaction among the predicator variables was tested, and there was no significant interaction between the individual- and regional-level variables.
Results
Background characteristics of the study participants
The background characteristics of the participants are listed in . Women aged 25–34 were the highest in proportion, accounting for 40.4%, 42.2%, and 46.7% in the three successive survey years, respectively. The proportion of women with no formal education decreased from 74.63% in 2005 to 62.93% in 2016. The proportion of those with primary and higher education rose from 17.08% in 2005 to 27.54% in 2016, and from 1.11% in 2005 to 3.24% in 2016. The proportion of adult men without any formal education decreased from 58.81% in 2005 to 47.14% in 2016, whereas those with higher education rose from 2.71% in 2000 to 6.41% in 2016. Concerning religion distribution/composition, followers of Orthodox Christianity decreased from 49.38% in 2005 to 44.12% in 2016.
Table 1. Background characteristics (weighted %) of non-pregnant and non-postpartum women of the Ethiopian demographic and health survey years 2005, 2011, and 2016 (N = 9046).
The time trend in the prevalence of overweight and obesity per region and by women characteristics
and show that the proportion of overweight and obese women has increased over the past decade (2005–2016). At the national level, the prevalence of overweight and obesity increased steadily from 6.09% in 2005 to 8.54% in 2011, and 10.16% in 2016. Looking at the time trend in 2005–2011, all regions except Afar showed an increase in the prevalence of overweight and obesity. The Dire Dawa, Gambela, and Harari regions showed the highest percentage point (pp) changes in this period, accounting for 18.18pp, 13.99pp, and 12.89pp, respectively. However, the Afar region showed the lowest pp change (1.02pp). In 2011–2016, some regions and the Dire Dawa City administration showed a decline in the prevalence of overweight and obesity. The greatest decline in the prevalence of overweight and obesity was observed in Dire Dawa (6.05pp), followed by Gambela (5.47pp) and Somali (4.90pp). However, in the same period, some regions and the Addis Ababa City administration showed an increase. The highest pp change was observed in Addis Ababa, Afar, and Benishagul-Gumuz, accounting for 16.14pp, 9.09pp, and 3.88pp change, respectively. From 2005 to 2016, all regions showed an increase in the prevalence of overweightness and obesity. The Addis Ababa, Harari, and Dire Dawa city administrations registered the highest prevalence changes, accounting for 19.13pp, 15.23pp, and 12.13pp, respectively. The smallest change was observed in Amhara. More details on the trend in the prevalence of overweight and obesity are found in the Supplementary Material (Text S1 and Figure S1).
Figure 2. Location of Ethiopia (a) and Prevalence of overweight and obesity by region 2005(b), 2011(c), 2016(d) (. A source: Britannica). OvOb: Overweight and Obesity.
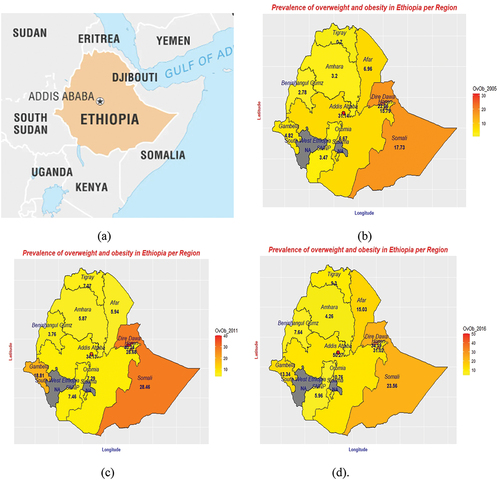
Table 2. Trends in the prevalence of overweight and obesity among non-pregnant women aged 15–49 per region (weighted) in the years 2005, 2011, and 2016 (N = 9,046).
Overall, between 2005 and 2016, Addis Ababa, Harari, Dire Dawa, Tigray, Benishagul-Gumuz, and Oromia showed a steady increase in the prevalence of overweight and obesity among women of reproductive age. The remaining exhibited mixed patterns (rise and fall) during this period. Time trends in the prevalence of overweight and obesity per region are shown in and for better visualization is graphically illustrated using maps in .
Moreover, the time trend in the prevalence of overweight and obesity varied according to the characteristics of women across the survey years. There was an increase in the prevalence of overweight and obese individuals across age groups. The highest increase was observed among women aged 25–34 (6.55%p) who had completed primary education (5.33%p), were Catholic believers (7.81%p), had worked (7.19%), and were rich (13.17pp). Besides looking at the effect of media access, women who read newspapers/magazines, listened to radio, and watched TV had shown an increase in the prevalence of overweight and obesity between 2005 and 2016 by 14.95pp, 9.53pp, and 3.80%p, respectively. Furthermore, the trend showed that the prevalence of obesity increased from 23.55% in 2005 to 32.56% in 2016 with an overall 9.01pp (95% CI 7.44–10.58) in urban areas, whereas it increased from 3.15% in 2005 to 4.81% in 2016 with an overall 1.66pp (95% CI 1.47–1.85) in rural areas. More details of the trend analysis by each female characteristic are described in the Supplementary Material (Table S1).
Individual- and regional-level factors influencing the prevalence of overweight and obesity among non-pregnant and non-postpartum women of reproductive age
Model assessment
The ICC value in the null model of the pooled dataset indicated that 19.80 of the total variances in the odds of becoming overweight or obese was due to between-community characteristics. The remaining 80.20% of the total variability in the prevalence of overweight and obesity is attributed to individual-level differences. The cluster variability/ICC declined over successive models from 19.80% to 9.35%, to approximately 0. Compared to the preceding models, Model 4 (the combined model), which consisted of individual- and regional-level factors, showed the smallest AIC and BIC values. Therefore, we adopted a combined model for our analysis to predict overweightness and obesity in women.
Factors associated with overweight and obesity
The multilevel analysis showed that all the individual-level variables: age, education level, religion, read newspaper/magazine, listen/watch TV, parity, and education of partner were found to be significant determinant factors of overweight and obesity among the non-pregnant and non-postpartum women. Between 2005 and 2016 women aged 25–34 and 35–49 were more likely to be overweight and obese, with odds ratio of 2.38 (95% CI: 1.79–3.18) and 3.62 (95% CI: 2.64–4.97), respectively, than those aged 15–24. In the same period, women who attended secondary school had higher odds of being overweight and obese compared to those who had no education (OR = 1.64; 95% CI:1.19–2.26).
Result showed that women who followed traditional beliefs were more likely to be overweight and obese with an OR = 3.95 (95% CI: 2.15–7.25) compared to those who were Orthodox believers. Women who had one to three children were significantly less likely to be overweight and obese than those who had no child with an OR = 0.32 (95% CI: 0.17–0.61). Those with at least four children were 66% less likely to be overweight or obese (OR = 0.34; 95% CI: 0.18–0.65). The other individual-level variable that was found to be significant is women partners’ education level, hence women whose partner finished high school were 37% (OR = 1.37; 95% CI: 1.03–1.84) more likely to be overweight and obese than those women whose partner had no formal education. While those women whose partner has completed higher education were 2.09 times (95% CI: 1.50–2.92) more likely to be overweight and obese than those women whose partner had no formal education.
Moreover, the regional-level variables of region, place of residence, education, and wealth were significantly associated with the prevalence of overweight and obesity in the survey years. The odds of the results are presented in . Women who lived in the Oromia, Somali, Benishagul-Gumuz, Gambela, and Harari regions and the Addis Ababa and Dire Dawa city administration were more likely to be overweight and obese than those who lived in the reference region (Tigray). Those who lived in the Somali region were eight times (95% CI: 4.80–13.34) more likely to be overweight or obese than those who lived in Tigray. Moreover, those women who lived in Harari were 3.10 times (95% CI: 0.90–10.67) more likely to be overweight and obese than those women who lived in Tigray. However, women who lived in Benishagul-Gumuz were significantly less likely to be overweight and obese than those who lived in Tigray by 79% (OR = 0.21; 95% CI: 0.03–1.24). In addition, women who lived in the urban area were significantly more likely to be overweight and obese (OR = 2.80; 95% CI: 2.15–3.66) than those women who lived in the rural area.
Table 3. Multilevel mixed effect logistic regression analysis of individual- and regional-level factors associated with prevalence of overweight and obesity among reproductive age women in Ethiopia, 2005, 2011, and 2016.
Furthermore, women who belonged to a community with high level of education were significantly more likely to be obese by 59% (OR = 1.41; 95% CI: 1.10–1.80) than those women who belonged to less educated community. Considering the regional-level wealth status, women who belong to the rich community were 1.61 times (95% CI: 1.28–2.02) more likely to be overweight and obese than their counterparts.
Discussion
The time trend analysis of the prevalence of overweight and obesity in Ethiopia showed a steady rise in consecutive survey years (2005–2016) by a significant percentage point. This is consistent with findings from neighboring countries, current trends in most low-income and middle-income countries, and across the globe. However, mixed patterns (rise and fall) were observed among the regions of the country.
In addition, looking at the time trends for each period (2005–2010 and 2011–2016), the patterns varied by region. For instance, Addis Ababa, Harari, Dire Dawa, Tigray, Benishagul-Gumuz, and Oromia showed a steady increase in the prevalence of overweight and obesity among women of reproductive age in both periods, whereas the rest showed a mixed pattern with fluctuations. In 2005–2011, the Dire Dawa, Gambela, and Harari regions had the greatest percentage point (pp) changes during these periods, whereas the Afar region showed the lowest pp change. In 2011–2016, the Addis Ababa, Harari, and Dire Dawa showed the greatest change in prevalence, whereas the least change was observed in the Amhara region. A possible reason for this is that both Addis Ababa and Dire Dawa, including Harar, are major metropolitan cities in Ethiopia with large populations. Moreover, urbanization was faster in these three areas than that in other areas.
The multilevel analysis revealed that the individual-level factors (age, women’s education level, religion, read newspaper/magazine, listen/watch TV, parity, and partners education) were associated with overweight and obesity among women in Ethiopia. Women aged 25–34 years and 35–49 years were more likely to be overweight and obese than those aged 15–24 years. This result is consistent with those of previous studies [Citation24,Citation32]. A possible reason for this may be the high rates of physical inactivity and increased consumption of high-energy foods associated with aging, which can lead to overweight and obesity [Citation25]. This can also be explained by a shift in body composition caused by age-related hormonal changes and/or an increase in and redistribution of body fat [Citation33,Citation34].
Women who had completed secondary school were more likely to be overweight or obese than those without education. This finding is consistent with many previous studies [Citation35–48]. However, some countries have found the strongest evidence of a negative correlation between these two factors. For example, a study conducted in China found an inverse association between educational level and being overweight or obese [Citation49]. This may be due to higher education and improved socio-economic status contributing to better health through increased health information and improved habits in more affluent countries [Citation45]. In LMICs, higher educational attainment is correlated with higher socioeconomic status and access to material resources, which makes women more likely to adopt ‘Western’ diets or processed foods high in fat and refined carbohydrates and sedentary lifestyles, which increases their risk of gaining weight.
Additionally, our study revealed that women who spent more time reading newspapers and/or magazines were more likely to be overweight and obese than their counterparts. This could be because of the associated lifestyle changes while reading; that is, they become physically less active. Similarly, TV exposure had a correlation with being overweight and obese. The increased TV viewing time of women is associated with a higher likelihood of obesity due to a sedentary lifestyle. These findings are in line with other studies [Citation26,Citation39,Citation40,Citation44,Citation45,Citation50,Citation51]. Advertising also increases calorie intake and can lead viewers to choose an unhealthy diet [Citation52]. Women with at least one child were less likely to be overweight or obese than those without children. This may be due to several factors, including workload, care, production, and reproduction. However, different results were obtained in a study conducted in Nepal [Citation38]. According to the available data, the relationship between parity and obesity differs between cultures [Citation18], ethnic groups [Citation15,Citation21–23], and national development levels. This may also highlight the need for further studies in this area.
Furthermore, the multilevel analysis results showed that region was one of the determining regional-level factors for the prevalence of overweight and obesity. This result is consistent with that of a previous study conducted in Kenya [Citation35]. We found that women who lived in the Oromia, Somali, Benishagul-Gumuz, Gambela, and Harari regions and the Addis Ababa and Dire Dawa city administration were more likely to be overweight and obese than those who lived in the reference region (Tigray). Living in urban was found to be a factor of overweight and obesity. Similar results have been reported previously [Citation35–40,Citation53–55]. A possible reason for the association between living in urban areas and overweight and obesity could be that urban areas experience fast-paced economic growth, in which population density rises and food consumption follows Western diets, which has become a trend in many developing countries [Citation56–62]. The continual influx of people from rural to urban areas, resulting in high population density and high demand for housing and infrastructure, may have contributed to the drying up of open areas, which may have reduced the opportunity for residents’ physical activities [Citation53,Citation62]. This largely affects the lifestyle of the residents shifting outdoor activities to more home-based entertainment, leading to increased sitting time and less energy-intensive activities in the urban areas of developing countries. Unlike urban women, rural women may be less likely to gain weight because of their engagement in labor-intensive activities such as agriculture.
The study is constrained by the absence of information on variables, such as comorbidity conditions, dietary intake, physical activities, and energy expenditures in the DHS dataset, which warrants further study.
Conclusion
The country is witnessing a health transition due to urbanization and changes in feeding habits and lifestyles, marking a significant change in the percentages of overweight and obese people. The findings of this study underscore the importance of targeted interventions and policies aimed at promoting healthier lifestyles and addressing the underlying factors driving excessive caloric consumption, varying trends, and risk factors across different regions and demographic groups. Initiatives focused on enhancing physical activity habits, improving access to nutritious foods, and increasing awareness of the risks associated with being overweight and obese could help mitigate the growing burden of noncommunicable diseases in Ethiopia. Further research is needed to explore additional factors, such as comorbidities, dietary intake, and physical activity levels to better inform comprehensive intervention strategies.
Author contributions
ETB and SC conceived and designed the study, analysed the data, and interpreted the findings. ETB wrote the first draft of the manuscript and contributed to the revision of the manuscript. SC had a hand in drafting the analytical strategy. ETB, SC, and JY contributed to the study design, data interpretation, and critical revision of the manuscript. All authors take responsibility for any issues that might arise from the publication of the manuscript.
Ethics and consent
We utilized secondary data with no information identifying the participants. The data is acquired from the DHS Program. The EDHS has got approval from the National Research Ethics Review Committee (NRERC), the Ethiopian Health and Nutrition Research Institute (EHNRI) Review Board, the Institutional Review Board of ICF International, and the CDC. Furthermore, prior to their enrollment in the survey, study participants provided their informed consent.
Supplemental Material
Download MS Word (129.9 KB)Acknowledgments
We would like to sincerely thank The DHS Program, USA, for granting us access to the data. We would also like to thank the Central Statistical Agency (CSA) of Ethiopia, which was extremely helpful in gathering the data.
Disclosure statement
No potential conflict of interest was reported by the author(s).
Supplementary material
Supplemental data for this article can be accessed online at https://doi.org/10.1080/16549716.2024.2362728
Correction Statement
This article has been corrected with minor changes. These changes do not impact the academic content of the article.
Additional information
Funding
References
- Tiwari A, Balasundaram P. Public health considerations regarding obesity. [Updated 2023 Jun 5]. In: StatPearls [Internet]. Treasure Island (FL): StatPearls Publishing; 2024 Jan. Available from: https://www.ncbi.nlm.nih.gov/books/NBK572122/
- Finucane MM, Stevens GA, Cowan MJ, et al. National, regional, and global trends in body-mass index since 1980: systematic analysis of health examination surveys and epidemiological studies with 960 country-years and 9·1 million participants. Lancet. [2011 Feb 12];377:557–13. doi: 10.1016/S0140-6736(10)62037-5. Epub 2011 Feb 3. PMID: 21295846; PMCID: PMC4472365.
- World Health Organization. Obesity and overweight. 2021 [cited 2023 Feb 5]. Available from: https://www.who.int/news-room/fact-sheets/detail/obesity-and-overweight
- World Health Organization. Indicator metadata registry details. [cited 2023 Feb 5]. Available from: https://www.who.int/data/gho/indicator-metadata-registry/imr-details/3420
- Cefalu WT, Bray GA, Home PD, et al. Advances in the science, treatment, and prevention of the disease of obesity: reflections from a diabetes care editors. Expert Forum Diabetes Care. 2015 Aug;38:1567–1582. doi: 10.2337/dc15-1081. PMID: 26421334; PMCID: PMC4831905.
- Fruh SM. Obesity: risk factors, complications, and strategies for sustainable long-term weight management. J Am Assoc Nurse Pract. 2017 Oct;29:S3–S14. doi: 10.1002/2327-6924.12510. PMID: 29024553; PMCID: PMC6088226.
- Capodaglio P, Liuzzi A. Obesity: a disabling disease or a condition favoring disability? Eur J Phys Rehabil Med. 2013 Jun;49:395–398. PMID: 23736901.
- Ziraba AK, Fotso JC, Ochako R. Overweight and obesity in urban Africa: A problem of the rich or the poor? BMC Public Health. [2009 Dec 15];9:465. doi: 10.1186/1471-2458-9-465. PMID: 20003478; PMCID: PMC2803188.
- GBD 2015 Obesity Collaborators, Afshin A, Forouzanfar MH, et al. Health effects of overweight and obesity in 195 Countries over 25 Years. N Engl J Med. [2017 Jul 6];377:13–27. doi: 10.1056/NEJMoa1614362. Epub 2017 Jun 12. PMID: 28604169; PMCID: PMC5477817.
- Campbell T, Campbell A. Emerging disease burdens and the poor in cities of the developing world. J Urban Health. 2007 May;84:54–64. doi: 10.1007/s11524-007-9181-7. PMID: 17453349; PMCID: PMC1891650.
- NCD Risk Factor Collaboration (NCD-RisC). Worldwide trends in body-mass index, underweight, overweight, and obesity from 1975 to 2016: a pooled analysis of 2416 population-based measurement studies in 128·9 million children, adolescents, and adults. Lancet. [2017 Dec 16];390:2627–2642. doi: 10.1016/S0140-6736(17)32129-3. Epub 2017 Oct 10. PMID: 29029897; PMCID: PMC5735219.
- Ford ND, Patel SA, Narayan KM. Obesity in low- and middle-income Countries: burden, drivers, and emerging challenges. Annu Rev Public Health. [2017 Mar 20];38:145–164. doi: 10.1146/annurev-publhealth-031816-044604. Epub 2016 Dec 23. PMID: 28068485.
- World Health Organization. Noncommunicable diseases: childhood overweight and obesity. 2021 [cited 2023 Mar 10]. Available from: https://www.who.int/news-room/questions-and-answers/item/noncommunicable-diseases-childhood-overweight-and-obesity
- Mokdad AH, Ford ES, Bowman BA, et al. Prevalence of obesity, diabetes, and obesity-related health risk factors, 2001. JAMA. [2003 Jan 1];289:76–79. doi: 10.1001/jama.289.1.76. PMID: 12503980.
- Mendez MA, Monteiro CA, Popkin BM. Overweight exceeds underweight among women in most developing countries. Am J Clin Nutr. 2005 Mar;81:714–721. doi: 10.1093/ajcn/81.3.714. PMID: 15755843.
- World Health Organization. Obesity. Situation and trends: Global Health Observatory (GHO) data. 2016 [cited 2023 Mar 25]. Available from: http://www.who.int/gho/ncd/risk_factors/obesity_text/en/
- Ajayi IO, Adebamowo C, Adami HO, et al. Urban-rural and geographic differences in overweight and obesity in four sub-Saharan African adult populations: a multi-country cross-sectional study. BMC Public Health. [2016 Oct 28];16:1126. doi: 10.1186/s12889-016-3789-z. PMID: 27793143; PMCID: PMC5084330.
- Misganaw A, Mariam DH, Ali A. Epidemiology of major non-communicable diseases in Ethiopia: a systematic review. J Health Popul Nutr. 2014 Mar;32:1–13. doi: 10.1186/1471-2458-13-634. PMID: 24847587; PMCID: PMC4089066.
- Birhane T, Shiferaw S, Hagos S, Mohindra KS. Urban food insecurity in the context of high food prices: a community based cross sectional study in Addis Ababa, Ethiopia. BMC Public Health. [2014 Jul 4];14:680. doi: 10.1186/1471-2458-14-680. PMID: 24993286; PMCID: PMC4227136.
- Asfaw HA, Mamo E, Shiferaw S. Effect of shift-work on hypertension among factory workers in Ethiopia [Internet]. ResearchGate. 2015. Available from: https://www.researchgate.net/publication/361912636_Effect_of_Shift-Work_on_Hypertension_Among_Factory_Workers_in_Ethiopia
- Tebekaw Y, Teller C, Colón-Ramos U. The burden of underweight and overweight among women in Addis Ababa, Ethiopia. BMC Public Health. [2014 Nov 1];14:1126. doi: 10.1186/1471-2458-14-1126. PMID: 25361603; PMCID: PMC4228094.
- Darebo T, Mesfin A, Gebremedhin S. Prevalence and factors associated with overweight and obesity among adults in Hawassa city, southern Ethiopia: a community based cross-sectional study. BMC Obes. [2019 Mar 4];6:8. doi: 10.1186/s40608-019-0227-7. PMID: 30867934; PMCID: PMC6398229.
- Baye MY. Prevalence of overweight, obesity among Urban Civil Servants in Southern Ethiopia. Ethiopian medical journal. 2019 [cited 2023 Apr 2]. Available from: https://emjema.org/index.php/EMJ/article/view/853
- Abrha S, Shiferaw S, Ahmed KY. Overweight and obesity and its socio-demographic correlates among urban Ethiopian women: evidence from the 2011 EDHS. BMC Public Health. [2016 Jul 26];16:636. doi: 10.1186/s12889-016-3315-3. PMID: 27457223; PMCID: PMC4960736.
- Alemu E, Atnafu A. Prevalence of overweight and/or obesity and Associated Factors among High School Adolescents in Arada Sub city, Addis Ababa, Ethiopia. J Nutr Food Sci. 2014;4. doi: 10.4172/2155-9600.1000261.
- Ahmed KY, Abrha S, Page A, et al. Trends and determinants of underweight and overweight/obesity among urban Ethiopian women from 2000 to 2016. BMC Public Health. [2020 Aug 24];20:1276. doi: 10.1186/s12889-020-09345-6. PMID: 32838771; PMCID: PMC7447570.
- Central Statistical Agency Ethiopia. Ethiopia - population and housing census of. 2007 [cited 2023 Apr 2]. Available from: https://catalog.ihsn.org/index.php/catalog/3583
- Central Statistical Agency Ethiopia and ORC Macro. Ethiopian demographic and health survey preliminary report 2005. 2006. [cited 2023 Apr 16]. Available from: https://dhsprogram.com/publications/publication-fr179-dhs-final-reports.cfm
- Central Statistical Agency Ethiopia and Inner City Fund International. Ethiopian demographic and health survey report 2011. 2012. [cited 2023 Apr 16]. Available from: https://dhsprogram.com/publications/publication-fr255-dhs-final-reports.cfm
- Central Statistical Agency Ethiopia and Inner City Fund. Ethiopia demographic and health survey 2016. 2016. [cited 2023 Apr 18]. Available from: https://dhsprogram.com/publications/publication-fr328-dhs-final-reports.cfm
- World Health Organization. Obesity: preventing and managing the global epidemic. Report of a WHO consultation. World Health Organ Tech Rep Ser. 2000;894:i-xii, 1–253. PMID: 11234459.
- Mosha D, Paulo HA, Mwanyika-Sando M, et al. Risk factors for overweight and obesity among women of reproductive age in Dar es Salaam, Tanzania. BMC Nutr. [2021 Jul 16];7:37. doi: 10.1186/s40795-021-00445-z. PMID: 34266482; PMCID: PMC8283918.
- Han TS, Tajar A, Lean ME. Obesity and weight management in the elderly. Br Med Bull. 2011;97:169–196. doi: 10.1093/bmb/ldr002. Epub 2011 Feb 16. PMID: 21325341.
- Gallagher D, Visser M, De Meersman RE, et al. Appendicular skeletal muscle mass: effects of age, gender, and ethnicity. J Appl Physiol. 1985 [1997 Jul];83:229–239. doi: 10.1152/jappl.1997.83.1.229. PMID: 9216968.
- Mkuu RS, Epnere K, Chowdhury MAB. Prevalence and Predictors of Overweight and Obesity Among Kenyan Women. Prev Chronic Dis. [2018 Apr 19];15:E44. doi: 10.5888/pcd15.170401. PMID: 29679481; PMCID: PMC5912924.
- Yeshaw Y, Kebede SA, Liyew AM, et al. Determinants of overweight/obesity among reproductive age group women in Ethiopia: multilevel analysis of Ethiopian demographic and health survey. BMJ Open. [2020 Mar 9];10:e034963. doi: 10.1136/bmjopen-2019-034963. PMID: 32156768; PMCID: PMC7064084.
- Mndala L, Kudale A. Distribution and social determinants of overweight and obesity: a cross-sectional study of non-pregnant adult women from the Malawi demographic and health survey (2015-2016). Epidemiol Health. 2019;41:e2019039. doi: 10.4178/epih.e2019039. Epub 2019 Sep 27. PMID: 31623425; PMCID: PMC6883023.
- Kinnunen TI, Bastola K, Neupane S. Trends in the prevalence of overweight and obesity among women of reproductive age. J Nepal Health Res Counc. [2021 Sep 6];19:252–258. doi: 10.33314/jnhrc.v19i2.3292. PMID: 34601512.
- Sarma H, Saquib N, Hasan MM, et al. Determinants of overweight or obesity among ever-married adult women in Bangladesh. BMC Obes. [2016 Mar 1];3:13. doi: 10.1186/s40608-016-0093-5. PMID: 26962459; PMCID: PMC4774107.
- Doku DT, Neupane S. Double burden of malnutrition: increasing overweight and obesity and stall underweight trends among Ghanaian women. BMC Public Health. [2015 Jul 16];15:670. doi: 10.1186/s12889-015-2033-6. PMID: 26178521; PMCID: PMC4502461.
- Nglazi MD, Ataguba JE. Overweight and obesity in non-pregnant women of childbearing age in South Africa: subgroup regression analyses of survey data from 1998 to 2017. BMC Public Health. [2022 Feb 25];22:395. doi: 10.1186/s12889-022-12601-6. PMID: 35216565; PMCID: PMC8874296.
- Kamal SM, Hassan CH, Alam GM. Dual burden of underweight and overweight among women in Bangladesh: patterns, prevalence, and sociodemographic correlates. J Health Popul Nutr. 2015 Mar;33:92–105. PMID: 25995726; PMCID: PMC4438653.
- Corsi DJ, Kyu HH, Subramanian SV. Socioeconomic and geographic patterning of under- and overnutrition among women in Bangladesh. J Nutr. [2011 Apr 1];141:631–638. doi: 10.3945/jn.110.131599. Epub 2011 Feb 23. PMID: 21346108.
- Chowdhury MAB, Adnan MM, Hassan MZ. Trends, prevalence and risk factors of overweight and obesity among women of reproductive age in Bangladesh: a pooled analysis of five national cross-sectional surveys. BMJ Open. [2018 Jul 19];8:e018468. doi: 10.1136/bmjopen-2017-018468. PMID: 30030307; PMCID: PMC6059314.
- Alem AZ, Yeshaw Y, Liyew AM, et al. Double burden of malnutrition and its associated factors among women in low and middle income countries: findings from 52 nationally representative data. BMC Public Health. [2023 Aug 3];23:1479. doi: 10.1186/s12889-023-16045-4. PMID: 37537530; PMCID: PMC10398981.
- Benkeser RM, Biritwum R, Hill AG. Prevalence of overweight and obesity and perception of healthy and desirable body size in urban, Ghanaian women. Ghana Med J. 2012 Jun;46:66–75. PMID: 22942454; PMCID: PMC3426384.
- Khan MM, Kraemer A. Factors associated with being underweight, overweight and obese among ever-married non-pregnant urban women in Bangladesh. Singapore Med J. 2009 Aug;50:804–813. PMID: 19710981.
- Biswas RK, Rahman N, Khanam R, et al. Double burden of underweight and overweight among women of reproductive age in Bangladesh. Public Health Nutr. 2019 Dec;22:3163–3174. doi: 10.1017/S1368980019002611. Epub 2019 Sep 23. PMID: 31544733; PMCID: PMC10260564.
- Song J, Zhang J, Fawzi W, et al. Double burden of malnutrition among Chinese women of reproductive age and their social determinants. Nutrients. [2020 Oct 12];12:3102. doi: 10.3390/nu12103102. PMID: 33053638; PMCID: PMC7601850.
- Ahmed KY, Rwabilimbo AG, Abrha S, et al. Factors associated with underweight, overweight, and obesity in reproductive age Tanzanian women. PLoS One. [2020 Aug 24];15:e0237720. doi: 10.1371/journal.pone.0237720. PMID: 32834011; PMCID: PMC7444815.
- Das Gupta R, Sajal IH, Hasan M, et al. Frequency of television viewing and association with overweight and obesity among women of the reproductive age group in Myanmar: results from a nationwide cross-sectional survey. BMJ Open. [2019 Mar 20];9:e024680. doi: 10.1136/bmjopen-2018-024680. PMID: 30898812; PMCID: PMC6475159.
- Rosiek A, Maciejewska NF, Leksowski K, et al. Effect of television on obesity and excess of weight and consequences of health. Int J Environ Res Public Health. [2015 Aug 12];12:9408–9426. doi: 10.3390/ijerph120809408. PMID: 26274965; PMCID: PMC4555288.
- Neupane S, Prakash KC, Doku DT. Overweight and obesity among women: analysis of demographic and health survey data from 32 Sub-Saharan African Countries. BMC Public Health. [2016 Jan 13];16:30. doi: 10.1186/s12889-016-2698-5. PMID: 26758204; PMCID: PMC4710980.
- Wariri O, Alhassan JAK, Mark G, et al. Trends in obesity by socioeconomic status among non-pregnant women aged 15-49 y: a cross-sectional, multi-dimensional equity analysis of demographic and health surveys in 11 sub-Saharan Africa countries, 1994-2015. Int Health. [2021 Sep 3];13:436–445. doi: 10.1093/inthealth/ihaa093. PMID: 33205197; PMCID: PMC8417076.
- Abubakari AR, Lauder W, Agyemang C, et al. Prevalence and time trends in obesity among adult West African populations: a meta-analysis. Obes Rev. 2008 Jul;9:297–311. doi: 10.1111/j.1467-789X.2007.00462.x. Epub 2008 Jan 7. PMID: 18179616.
- Schmidhuber J, Shetty P. The nutrition transition to 2030. Why developing countries are likely to bear the major burden. Acta agriculturæ Scandinavica. 2005 [cited 2023 Apr 20]. Available from: https://www.researchgate.net/publication/228702841
- Nutrition PB. Agriculture and the global food system in low and middle income Countries. Food Policy. [2014 Aug 1];47:91–96. doi: 10.1016/j.foodpol.2014.05.001 PMID: 24932059; PMCID: PMC4053196.
- Neiderud CJ. How urbanization affects the epidemiology of emerging infectious diseases. Infect Ecol Epidemiol. [2015 Jun 24];5:27060. doi: 10.3402/iee.v5.27060. PMID: 26112265; PMCID: PMC4481042.
- De Bruin S, Holleman C. Urbanization is transforming agrifood systems across the rural–urban continuum creating challenges and opportunities to access affordable healthy diets. 2023 [cited 2023 Apr 25]. doi: 10.4060/cc8094en.
- Zou Y, Zhang R, Zhou B, et al. A comparison study on the prevalence of obesity and its associated factors among city, township and rural area adults in China. BMJ Open. [2015 Jul 15];5:e008417. doi: 10.1136/bmjopen-2015-008417. PMID: 26179650; PMCID: PMC4513451.
- Neuman M, Kawachi I, Gortmaker S, et al. Urban-rural differences in BMI in low- and middle-income countries: the role of socioeconomic status. Am J Clin Nutr. 2013 Feb;97:428–436. doi: 10.3945/ajcn.112.045997. Epub 2013 Jan 2. PMID: 23283503; PMCID: PMC3742298.
- Machado-Rodrigues AM, Coelho-E-Silva MJ, Mota J, et al. Urban-rural contrasts in fitness, physical activity, and sedentary behaviour in adolescents. Health Promot Int. 2014 Mar;29:118–129. doi: 10.1093/heapro/das054. Epub 2012 Oct 19. PMID: 23086894.