
 ?Mathematical formulae have been encoded as MathML and are displayed in this HTML version using MathJax in order to improve their display. Uncheck the box to turn MathJax off. This feature requires Javascript. Click on a formula to zoom.
ABSTRACT
This study presents a techno-economic comparison of four alternatives (experimental prototype of concentrating solar power tower system, photovoltaic (PV) system, collapsible vertical axis wind turbine and diesel generator) to supply electrical energy for a small compound of buildings. Among the services needed in the compound are the provision of an adequate drinking water, health centre for immunization purposes, and learning centre. The result of this study shows that the amount of electrical energy needed to meet the basic power requirements is 7.3 kWh/day. Detailed analysis and design requirements of the four alternatives are presented. Dynamic indicators (life cycle cost, annualized life cycle cost and cost of energy production) were applied to evaluate the economic-effectiveness of these energy supply systems. The cost of energy was $1.06/kWh, $1.18/kWh, $1.19/kWh and $2.98/kWh for the PV system, solar power tower system, diesel generator system and wind turbine system, respectively. Providing electricity to the compound buildings using solar power tower and PV systems is very beneficial and competitive among the other types of energy sources.
1. Introduction
Attempts are ongoing to preserve the energy and to alter energy production at differing range scales of renewable energy sources. Among several choices available, solar power tower energy is believed to highly contribute in achieving the constantly growing request for energy. A solar tower power plant as a means for converting solar energy into electricity is mentioned widely in the literature. The possible usage of concentrating solar power plant technology was assessed by many researchers [Citation1–8]. Generally, five main components comprise an energy block of a central receiver system: thermal storage tanks; heat transfer fluid; heliostats; receiver and control. Mirrors called heliostats are used in such plants to redirect the solar rays during the daylight to a solar receiver placed on top of a steel tower. Heliostats are controlled by computers to keep their reflective surface perpendicular to the divider of the angle between the directions of the sun and the target as seen from the mirror [Citation4, Citation9, Citation10].
Photovoltaic (PV) is defined simply as the technology that changes sunlight energy into electricity without using moving parts, causing no pollution, without using fossil fuels, and can last for long time with minimal maintenance [Citation11, Citation12]. This technology is viable for providing electrical energy for remote regions with no transportation or storage problems, and most importantly it is widely available and does not release pollutants to the environment [Citation13, Citation14]. Solar panel is the principal constituent of the PV systems which is composed by assembling many PV cells to give a module; a group of modules gives an array and a group of arrays gives a panel. This modular arrangement of PV panels enables them to be utilized for a huge number of applications.
Wind energy is another competitive renewable energy in Saudi Arabia and in several locations in the world. We are currently producing greenhouse gases and consuming fossil fuels in a completely unsustainable way to produce energy. All this is being done at the cost of damaging the environment. As this is increasing the global warming potential and ultimately increasing the carbon footprint. Wind turbines generate electricity by converting the wind energy into kinetic energy and the turbines turn to generate electricity [Citation15]. It causes no pollution and produces no greenhouse gases during operation such as carbon dioxide and methane compared to diesel engine system as a conventional method for producing electricity [Citation16–18].
Cost of energy is an acknowledged and significant factor for attaining optimal and cost-effective electricity generation systems. Cost of energy is defined as the mean cost per kWh of electricity generated by a system. Ahmad et al. [Citation19] performed a techno-economic feasibility study for electricity generation via hybrid biomass, wind and PV system. They indicated that their hybrid system is cost-effective compared to conventional means of electricity generation. Zhu et al. [Citation20] conducted a techno-economic analysis of a hybrid system for a 1000 MWe electricity generation comprising of solar tower and coal-fired power plant. They considered the whole life cycle in their analysis. They stated that although the existence of the solar tower increased the electricity cost, it participates in the reduction of carbon dioxide capture cost compared to the conventional coal-fired plant. Zhao et al. [Citation21] performed an economic feasibility analysis on an estimated first hybrid system consisting of solar tower and coal-fired power plant in the China’s Inner Mongolia Region. They used their results to provide recommendations for the promotion of this type of hybrid technology. In a more recent study, Zhao et al. [Citation22] performed an economic optimization analysis of solar multiple with different scales for the solar-coal hybrid power plant. They optimized the solar field size by calculating the levelized energy cost for each case. They concluded that the optimization of the solar field size is helpful for the economic enhancement of the hybrid power system. Sawle et al. [Citation23] conducted a socio-techno-economic analysis to decide on the optimal configuration parameters for the design of a hybrid power system. The system they studied included various combinations of renewable energy generation including wind, PV, diesel generator, biomass and battery bank. They found that the case of hybrid system with PV, biomass, diesel and battery was the most efficient solution among all cases and had the least cost of energy.
The aim of this article is to explore the techno-economic viability of four various energy systems to provide a compound of buildings in Jeddah-Saudi Arabia with electricity. It is needed to satisfy the most necessary loads in the compound centres and to use the result to help the decision makers in the energy sector in the country. Section 2 is the methodology section which is divided into two main subsections: design requirements and technical analysis of the different systems used in the study, and the economic analysis subsection which illustrates the models and equations used to complete this analysis. Section 3 is the results of analysis which comprises of four subsections each of them analyses and discusses the results of each energy system separately. Finally, Section 4 summarizes all the conclusions obtained from this study.
2. Methodology
The following sections provide characterization and design requirements of the alternatives used to produce electricity from renewable energy sources. The energy produced will be used to electrify a small compound of buildings.
2.1. Design requirements and technical analysis of alternatives
The next subsections present a brief description of the three renewable energy alternatives (experimental prototype of concentrating solar power tower system, PV system and vertical axis wind turbine (VAWT)) used to supply the required electrical energy.
2.1.1. Experimental prototype of solar power tower system
The prototype of the solar power tower system was built at King Abdulaziz University in Jeddah on the west coast of Saudi Arabia (at latitude of N 21° 29′ and longitude of E 39° 14′). Detailed design considerations and construction of the concentrating solar tower system are given by Abu-Hamdeh and Alnefaie [Citation24, Citation25]. Details about the most necessary loads in the compound centres and their energy requirements are shown in Table . It is reported in the literature that an operation of concentrating solar power (CSP) plant is cost-effectively possible if the average annual direct normal irradiation is above 1800 kWh/m2. Figure shows the solar irradiation data of Saudi Arabia [Citation24, Citation25]. The figure shows that the operation of CSP plant is technically feasible in most parts of Saudi Arabia. Figure presents the complete power block layout, including thermal storage tanks, receiver, tower and heat exchanger. The thermal fluid used in this system was a molten salt mixture (60% NaNO3 and 40% KNO3). Ten heliostats were adopted for this prototype system. The layout of the heliostats relative to the tower and the receiver is presented in Figure . The basic function of the receiver in a solar plant is to convert the radiation energy deflected by the heliostat into valuable thermal energy. Given the receiver size and the selected field configuration, a tower height of 7 m was manufactured and constructed. This height limits the maximum receiver heliostat distance and minimizes atmospheric attenuation.
Figure 1. Solar map of Saudi Arabia with average daily sum of direct normal irradiation per square meter [Citation24, Citation25].
![Figure 1. Solar map of Saudi Arabia with average daily sum of direct normal irradiation per square meter [Citation24, Citation25].](/cms/asset/0e54560d-8a93-4d74-954a-20c435f718f4/tusc_a_1556916_f0001_oc.jpg)
Figure 2. Actual picture of the complete power block layout, including thermal storage tanks, receiver/tower, and heat exchanger.
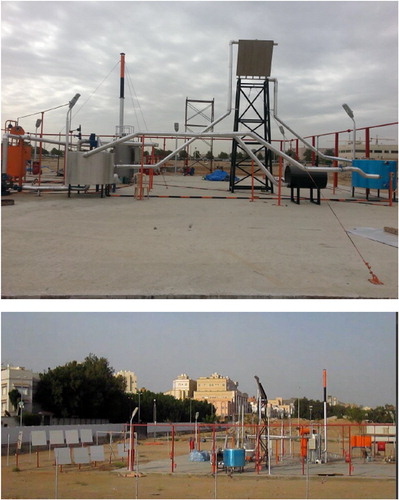
Table 1. Energy requirements of selected loads in the compound.
The thermal power transferred to the water in the heat exchanger as it is heated by the molten salt was measured by measuring the water mass flow rate and the change in temperature of the water at the inlet and exit points of the heat exchanger. Then, the thermal power transferred to the water in the heat exchanger was calculated (9 kWt). To make electricity, the superheated steam powers a small thermal power plant working on the Rankine cycle. The small power generation plant transforms thermal energy enclosed in the steam from the heat exchanger into electrical energy for delivery to the electric grid in the compound. The final electrical output power obtained was 1.9 kWe. The peak sun hours for Jeddah is 8 h which means a 15.2 kWe/day of energy was obtained from the CSP.
2.1.2. PV system
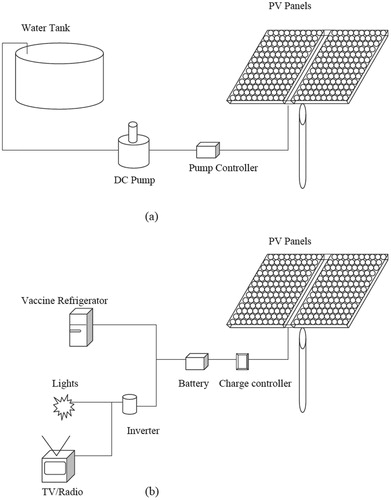
Of all methods of renewable energy production, solar PV power systems have been increasing most rapidly with an average worldwide annual growth rate of 60% last years. Although, the efficiency of PV systems is still very low due to different problems such as overheating and necessary materials needed [Citation26, Citation27]. The first panel of PV was created in the early fifties of the previous century at a huge cost and very low efficiency. Since then, prices of the PV cells have decreased constantly with steady increase in their efficiency. Many countries are installing PV systems as part of a shift towards a low carbon economy [Citation28]. Figure shows the PV system implemented in this study. More details about the design of this system are given by Abu-Hamdeh [Citation26].
Figure 3. Schematic of (a) solar water pumping system and (b) other loads solar system.
2.1.3. Wind turbine
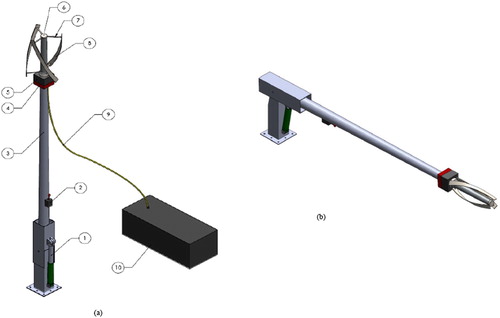
This section presents a design of a mobile VAWT that is collapsible for relocation purposes. It has the ability to power the compound stated in this study. This device has been developed to providing clean, renewable power in locations where conventional power units are typically undesirable. The wings of the turbine retract into the base shaft via a device described here within the following sections and the unit can be raised/lowered in few minutes time. One of the main accomplishments of this design was the manufacture of the blades from epoxy polymer reinforced with carbon nanotubes. Figure depicts the structure in both operable and collapsed forms. More details about the design of this system can be found in Reference [Citation29].
Figure 4. (a) Operational turbine: (1) hydraulic cylinder, (2) handle brake, (3) turbine shaft (mast), (4) braking system, (5) generator, (6) hinge, (7) arm, (8) blade, (9) power cable, (10) the turbine control and power conditioning system and (b) collapsed turbine.
2.2. Economic analysis
Cost analysis of the four possible alternatives discussed in this article, solar power tower system, PV system, wind turbine and diesel generation will be explored. Life cycle cost (LCC) was calculated for the four energy supply systems. LCC is a dynamic economic method used to decide on the best cost-effective selection among different options [Citation28, Citation30]. It considers the initial cost of a system and other costs such as operating and maintenance and replacement costs. Then, annualized life cycle cost (ALCC) and cost of kWh production were evaluated for each energy supply system.
The total LCC for each system was calculated using the following equation [Citation31]:
(1)
(1)
where LCC is the total present value of LCC of a given system, C is the initial installation and capital cost of all components in the system, R is the present value of the replacements cost, and OM is the present value of all future operation and maintenance (OM) costs which is calculated by multiplying the annualized cost of OM and the present worth factor which is defined as follows [Citation31]:
(2)
(2)
where i is the annual interest rate (%) and N is the service life (years). The ALLC was calculated as follows:
(3)
(3)
Cost of production (CP) is the net cost of producing each kWh throughout the life cycle of each system and is by [Citation28]
(4)
(4)
The following formula for determining the present value of future one-time costs was used to determine the present value [Citation31]:
(5)
(5)
where
is the present value,
is the amount of one-time cost at a time
,
is the annual interest rate and
is the service life in years.
The common study period for LCC analysis is 20 y. A market value of 10% for the interest rate was used in all calculations. The inflation rate in prices is about zero for renewable energy projects in Saudi Arabia.
3. Results of analysis
The obtainability of energy is a key requirement for advancing the economy and progressing the standards of people’s living. Calculations of the above dynamic economic methods for the four alternatives are shown below.
3.1. PV system
Life cycle of the PV system components was considered as 20 years except for the batteries, which was taken as a 5 years although it depends on the discharging and discharging of the battery. The battery is used for the lightning, refrigerator and TV/radio (Figure ). Table shows that a total of 4.26 kWh is needed to operate these loads. At a battery cost of $140/kWh including the cost of wiring, the initial cost of the first group of batteries is $1780 (4.26 kWh * $140/kWh * 3 days). The present value of the replacements cost (R) consists of the present value of the second, third and fourth groups of the batteries, which was calculated using Equation (5). The calculated R value was found to be $2217.6.
The initial capital cost of all components in the system (C) consists of the following costs: PV arrays, first group of batteries, battery charge regulator, invertor, installation, and auxiliaries cost. Because the cost of each PV module is $500, the initial cost of the PV arrays is $12,000 (24 module @ $500 each). The cost of the first group of batteries was calculated earlier and found to be $1780. The market cost of the invertor and the battery charge regulator was $1200. The auxiliaries cost was estimated at 5% of the PV arrays cost [Citation28] and found to be $600. The cost of installation is 20% of the initial investment cost. For the current PV system, the cost of installation was found to be $3116 (estimated at 20% of the initial investment cost). The total initial capital cost of all components in the system (C) was found to be $18,696 by summing all the above costs.
The present value of all future OM costs was calculated by multiplying the annualized cost of OM (estimated at 2% of the total initial capital cost C [Citation28, Citation29]) and the present worth factor. The annualized cost of OM was found to be $374 and the present worth factor was found to be 8.51. Multiplying the two numbers gave a $3184 for OM costs.1
The total LCC for the PV system was calculated using Equation (1) and found to be $24,097.6. The ALLC) for this system was calculated using Equation (3) and found to be 2830.5$/year. The annual kWh provided by the PV system is 2664.5 kWh/year ([7.3 kWh/day]*365 days/year). The CP of the PV system was calculated using Equation (4) and found to be 1.06 $/kWh.
3.2. Solar power tower system
Life cycle of the solar tower system components was considered as 20 years except for the hot salt circulation and transfer pumps, which was taken as 10 years [Citation28]. The market price of the pumps is $8000 (2 pumps @ $4000 each). The present value of the replacements cost (R) consists of the present value of the second group of molten salt pumps that will be purchased after 10 years. The present value of the second group of pumps was determined using Equation (5). With 10% interest rate and zero inflation rate in prices, the calculated R value was found to be $3084.
The initial capital cost of all components in the solar tower system (C) consists of the cost of the following systems: the first group of pumps ($8000), collector components, receiver-tower, steam generation, thermal storage, auxiliary heaters, power generation and diesel burners. The initial cost of the collector system was $10,000 (10 heliostats @ $1000 each which includes the cost of tracking motors, mirrors, controls and wires, support and foundation and installation labour). The cost of the tower-receiver system was $7000 including the manufacturing and installing the steel tower and the receiver on its top and the installation labour. The cost of the thermal storage system was $9000, which consists of the following costs: hot tank, cold tank, piping and insulation, valves and fittings for molten salt application, dry industrial grade salt constituents, instruments and controls, foundations and installation labour. The cost of the steam generation system was $3000 includes the following costs: evaporator circulation pump; hot salt circulation and transfer pump (evaluated separately); heat exchanger for evaporation, and associated piping, insulation, valves, and installation labour. The components of the power generation system are the components of the Rankine cycle. All components of this cycle were assembled in the laboratories of the mechanical engineering department in the university by a group of graduate and undergraduate students. The estimated cost for parts and components was $9000. The cost of auxiliary heaters is the cost associated with the freeze protection of the solar field piping, fittings, and the receiver. The cost of these auxiliary heaters was $2000. Two diesel burners at $1700 were also considered to provide plant back-up energy required to balance extended cloudy periods. The total initial capital cost of all components in the solar tower system (C) was summed to $49,700.
The present value of all future OM costs was calculated by multiplying the annualized cost of OM (estimated at 1% of the total initial capital cost C for the concentrating solar power tower systems [Citation32] which is equivalent to $497) and the present worth factor (8.51). The OM cost was $3184.
The total LCC for the solar tower system was calculated using Equation (1) and found to be $55,968. The ALLC for this system was calculated using Equation (3) and found to be 6576.7 $/year. The annual kWh provided by the solar system is 5548 kWh/year ([15.2 kWh/day]*365 days/year). The CP of the solar tower system was calculated using Equation (4) and found to be 1.18 $/kWh.
3.3. Wind turbine
Life cycle of all components of the wind turbine system components was considered as 20 years [Citation33]. The initial capital cost of all components in the solar tower system (C) was $36,000. The main components of the wind turbine system and their contribution in percentage terms to the initial capital cost as follows: tower or mast (32.8%), blades and arms (32%), hinge (3.2%), bearings (2.2%), generator (7%), control and power conditioning system (9%), cables and screws (3.8%), braking system (5%) and hydraulic cylinder (5%).
The present value of all future OM costs was calculated by multiplying the annualized cost of OM (estimated at 10% of the total initial capital cost C for wind turbine systems [Citation33]) and the present worth factor. The OM cost was $30,636.
The total LCC was calculated using Equation (1) and found to be $66,636. The ALLC for this system was calculated using Equation (3) and found to be 7830.3 $/year. The annual kWh provided by the wind turbine system is 2628 kWh/year. The CP of the wind turbine system was calculated using Equation (4) and found to be 2.98 $/kWh.
3.4. Diesel generator
A diesel generator with a power capacity of 10 kW was selected for this system. Life cycle of the diesel generator system was considered as 20 years but reviving will be performed every 4 years [Citation28]. Since the market price of the diesel generator is $1000/kW including installation cost, the initial capital cost (C) was $10,000 (1200/kW * 10 kW).
The OM costs consist of the present value of all future operations, which includes: 4 times reviving throughout the life cycle, annual repairs and maintenance operations, and lube and diesel fuel consumption for 20 years. The present value of the reviving cost consists of the present value of the first, second, third and fourth operations of the reviving. The estimated reviving cost is 20% of the total initial capital cost C for diesel generators [Citation28]. The present value of the cost of the four reviving operations, $3372, was calculated using Equation (5). The annual repairs and maintenance cost is 5% of the total initial capital cost [Citation28]. Multiplying the annualized cost of repairs and maintenance by the present worth factor yielded a present value of $4255. The present value of fuel consumption for 20 years was calculated by multiplying the annualized lube and diesel fuel cost by the present worth factor. Annual lube and diesel fuel cost was estimated according to the following procedure:
Heating rate of diesel fuel = 11500 Btu/kWh
Energy of fuel required annually = (heating rate in Btu/kWh)*(energy in kWh/year)= (11,500 Btu/kWh)*(7.286 kWh/day)*(365 days/year) = 30,582,985 Btu.
The diesel fuel heating value = 37,900 Btu/L.
The yearly number of liters of fuel = annual energy of fuel/heating value of fuel = 30,582,985 Btu/37,900 Btu/L = 807 L.
Taking a fuel cost of $0.40/L, the annual cost of fuel = ($0.40/L) * 807 L= $322.8/year.
Lube oil cost is $100/year.
Multiplying the annualized lube and fuel cost by the present worth factor yielded a present value of $3598. Summing all the above yielded $11,225 for OM cost.
The total LCC for the diesel generator system was calculated using Equation (1) and found to be $21,225. The ALLC for this system was calculated using Equation (3) and found to be 2494.1 $/year. The annual kWh provided by the diesel generator system is 2190 kWh/year. The CP of the diesel generator system was calculated using Equation (4) and found to be 1.14 $/kWh. The indirect costs of conventional energy generation (environment and health impacts) should be included when comparing between conventional generation of energy and solar energy [Citation34]. The estimated average indirect costs including environment factors (CO2, SO2 and NOx) in Saudi Arabia are 0.05 $/kWh. The final CP of the diesel generator system was then found to be 1.19 $/kWh [Citation34].
Table shows evaluation results of applying the dynamic economic methods (LCC, ALCC and cost of kWh production) on the four energy supply systems of the compound site. On a cost-per-kWh basis, a cost of ($1.18/kWh), ($1.19/kWh) and ($2.95/kWh) for the solar tower, diesel generator and wind turbine systems, respectively, is indicated versus only ($1.06/kWh) for the PV system. Generally speaking, the performance of the PV system does not depend on the mechanical production of the energy, and availability of electricity is always guaranteed providing the sun shines on the location. In addition, it requires little maintenance as a result of being independent on moving parts. Moreover, it does not discharge any pollutant to the environment, and it does not produce disturbing noise. Replacement expenses are small due to its high reliability. On the other hand, although they are able to provide the needed power on demand, diesel generators are noisy and require buying fuel all year round. In addition, they cause environmental pollution and require reviving every four years. In comparison, the initial cost of the solar power tower system is higher than the PV or diesel generator systems. This difference in initial cost can be attributed to the fact that we are dealing with small-scale energy-producing systems. The technologies of CSP as solar power tower system are earning thrust for large-scale solar power production. Our ultimate goal is to go for a commercial-scale plant. The real advantage obtained that we evaluated and explored options for building and operating the first prototype solar power plant and gained important skills and knowledge in doing that.
Table 2. Assessment results of the dynamic economic methods applied on the four energy supply systems.
Table reveals that the wind turbine system has the highest cost of energy among all other alternatives presented. Although wind power provides clean, renewable power in locations where conventional power units are typically undesirable, the wind power option can be excluded easily not only because it gives the highest cost of energy production but also because the wind energy potential in the site is low since the wind speed in the region is below 3.0 m/s (averaging only 2.5 m/s), which is supposed as insufficient mean for power production.
4. Conclusion
It is concluded from this investigation that the PV system on a small scale is a cost-effective system and competitive with other approaches to produce electricity. It produced the least cost-per-kWh among the four energy supply systems presented in this article. Additionally, the PV system is a clean one and produces the least noise among other systems. The concentrating solar power tower system produced the second least cost-per-kWh. Compared with the PV system, the initial cost of the solar power tower system is higher for small-scale energy-producing systems. The solar power tower is expected to have less cost-per-kWh than the PV system on large-scale solar power generation systems. The cost-per-kWh for the diesel generator system was close to the one for concentrating solar power tower system, but it not a preferable option due to its numerous disadvantages. The wind turbine system had the highest cost of energy production among all alternatives presented and discussed in this article. The wind power alternative was presumed insufficient for power generation because the wind energy potential in the site is low since the wind speed in the region is below 3.0 m/s. Most important of all, energy cost for the solar systems is the least among alternatives considered for energy production presented in this study.
Acknowledgments
The authors acknowledge Science and Technology Unit, King Abdulaziz University for technical support.
Disclosure statement
No potential conflict of interest was reported by the authors.
ORCID
Nidal Abu-Hamdeh http://orcid.org/0000-0002-4852-2217
Correction Statement
This article has been republished with minor changes. These changes do not impact the academic content of the article.
Additional information
Funding
References
- Al-Soud M, Hrayshat E. A 50 MW concentrating solar power plant for Jordan. J Clean Prod. 2009;17:625–635. doi: 10.1016/j.jclepro.2008.11.002
- Vallentin D, Viebahn P. Economic opportunities resulting from a global deployment of concentrated solar power (CSP) technologies-the example of German technology providers. Energy Policy. 2010;38:4467–4478. doi: 10.1016/j.enpol.2010.03.080
- Zhu Y, Zhai R, Qi J, et al. Annual performance of solar tower aided coal-fired power generation system. Energy. 2017;119:662–674. doi: 10.1016/j.energy.2016.11.023
- Wei X, Lu Z, Wang Z, et al. A new method for the design of the heliostat field layout for solar tower power plant. Renew Energy. 2010;35:1970–1975. doi: 10.1016/j.renene.2010.01.026
- www.iea.org [internet]. Paris: International Energy Agency (IEA); 2014 [cited 2018 Jan 15]. Available from: https://www.iea.org/media/workshops/2014/solarelectricity/CollaresPereira.pdf
- Kalogirou SA. Solar energy engineering: processes and systems. 2nd ed. Amsterdam: Elsevier/Academic Press; 2014.
- Flueckiger SM, Yang Z, Garimella SV. Review of molten-salt thermocline tank modeling for solar thermal energy storage. Heat Transf Eng. 2013;34:787–800. doi: 10.1080/01457632.2012.746152
- Almsater S, Saman W, Bruno F. Performance enhancement of high temperature latent heat thermal storage systems using heat pipes with and without fins for concentrating solar thermal power plants. Renew Energy. 2016;89:36–50. doi: 10.1016/j.renene.2015.11.068
- Collado F. Preliminary design of surrounding heliostat fields. Renew Energy. 2009;34:1359–1363. doi: 10.1016/j.renene.2008.09.003
- Xiudong W, Zhenwu L, Weixing Y, et al. Tracking and ray tracing equations for the target-aligned heliostat for solar tower power plants. Renew Energy. 2011;36:2687–2695. doi: 10.1016/j.renene.2011.02.022
- Dorf RC. The energy fact book. New York (NY): McGraw-Hill Book Company; 1981.
- Alsharif MH. Optimization design and economic analysis of energy management strategy based on photovoltaic/energy storage for heterogeneous cellular networks using the HOMER model. Sol Energy. 2017;147:133–150. doi: 10.1016/j.solener.2017.03.044
- Hubbard HM. Photovoltaics Today and Tomorrow. Science. 1989;244:297–300. doi: 10.1126/science.244.4902.297
- Business-BBC News [internet]. England: BBC News; 2014 [cited 2017 Nov 13]. Available from: https://www.bbc.com/news/business-40341833
- Kaldellis JK, Kapsali M, Kavadias KA. Energy balance analysis of wind-based pumped hydro storage systems in remote island electrical networks. Appl Energy. 2010;87:2427–2437. doi: 10.1016/j.apenergy.2010.02.016
- Rezaie B, Esmailzadeh E, Dincer I. Renewable energy options for buildings: case studies. Energy Build. 2011;43:56–65. doi: 10.1016/j.enbuild.2010.08.013
- Santoso S, Le HT. Fundamental time–domain wind turbine models for wind power studies. Renew Energy. 2007;32:2436–2452. doi: 10.1016/j.renene.2006.12.008
- Chen W-H, Chen C-Y, Huang C-Y, et al. Power output analysis and optimization of two straight-bladed vertical-axis wind turbines. Appl Energy. 2017;185:223–232. doi: 10.1016/j.apenergy.2016.10.076
- Ahmad J, Imran M, Khalid A, et al. Techno economic analysis of a wind-photovoltaic-biomass hybrid renewable energy system for rural electrification: A case study of Kallar Kahar. Energy. 2018;148:208–234. doi: 10.1016/j.energy.2018.01.133
- Zhu Y, Zhai R, Yang Y, et al. Techno-economic analysis of solar tower aided coal-fired power generation system. Energies. 2017;10: 1392.
- Zhao Y, Hong H, Jin H. Appropriate feed-in tariff of solar–coal hybrid power plant for China’s Inner Mongolia region. Appl Therm Eng. 2016;108:378–387. doi: 10.1016/j.applthermaleng.2016.07.062
- Zhao Y, Hong H, Jin H. Optimization of the solar field size for the solar–coal hybrid system. Appl Energy. 2017;185:1162–1172. doi: 10.1016/j.apenergy.2016.01.069
- Sawle Y, Gupta SC, Bohre AK. Socio-techno-economic design of hybrid renewable energy system using optimization techniques. Renew Energy. 2018;119:459–472. doi: 10.1016/j.renene.2017.11.058
- Abu-Hamdeh NH, Alnefaie KA. The first solar power tower system in Saudi Arabia. Appl Mech Mater. 2014;672–674: 123–126.
- Abu-Hamdeh NH, Alnefaie KA. Design considerations and construction of an experimental prototype of concentrating solar power tower system in Saudi Arabia. Energy Conv Manag. 2016;117:63–73. doi: 10.1016/j.enconman.2016.02.077
- Abu-Hamdeh NH. Photovoltaic system design for a village of farmers in Jordan Badia. Appl Eng Agri. 2000;16: 297–302. doi: 10.13031/2013.5138
- Sinha S, Chandel S.S. Improving the reliability of photovoltaic-based hybrid power system with battery storage in low wind locations. Sust Energy Technol Assessm. 2017;19:146–159.
- Al-Smairan M, Al-Adamat R, Al-Nhoud O. Techno-economic feasibility of energy supply of remote dump site in Jordan Badia by photovoltaic systems, diesel generators and electrical grid. Res J Appl Sci Eng Technol. 2012;4:1073–1081.
- Abu-Hamdeh NH, Almitani KH. Design and analysis of a collapsible vertical axis wind turbine. Energy Conv Manag. 2017;151:400–413. doi: 10.1016/j.enconman.2017.09.015
- Maleki A, Askarzadeh A. Optimal sizing of a PV/wind/diesel system with battery storage for electrification to an off-grid remote region: A case study of Rafsanjan, Iran. Sust Energy Technol Assessm. 2014;7:147–153.
- Abu-Hamdeh NH, Almitani KH. Solar liquid desiccant regeneration and nanofluids in evaporative cooling for greenhouse food production in Saudi Arabia. Sol Energy. 2016;134:202–210. doi: 10.1016/j.solener.2016.04.048
- NREL [internet]. Denver (CO): National Renewable Energy Laboratory; 2013 [cited 2018 Jan 15]. Available from: https://www.nrel.gov/docs/fy13osti/57625.pdf
- NREL [internet]. Denver (CO): National Renewable Energy Laboratory; 2015 [cited 2018 Jan 15]. Available from: https://www.nrel.gov/docs/fy17osti/66861.pdf
- Almasoud AH, Gandayh HM. Future of solar energy in Saudi Arabia. J King Saud Univ–Eng Sci. 2015;27:153–157.