
ABSTRACT
Heavy metals were analysed in Osun River (Nigeria) between 2017 and 2018. Concentrations of the heavy metals were in the increasing order: Fe > Zn > Cu > Mn > Pb > (Ni, Cr) > (Cd, Co). Iron made up 76% of the total heavy metals measured. Activities at Swanlux Farm (a major oil palm farm) seemed to impart on Osun River as the highest Fe concentration (2.55 mg/L) was measured near the farm. In the urban settlement, average zinc concentration was almost double (0.37 mg/L) of that found in the pre-urban area (0.25 mg/L). The pre-urban settlement had lower concentrations of Pb, Zn and Cd, signifying the effects of anthropogenic activities. Cu and Mn were found in a similar trend in the river; Coker village had their highest concentrations. Use of agrochemicals was conceivably the major source of Cu and Mn at the river sampling point as cocoa farms are predominant in the area. Osun River use for agricultural/irrigational purposes should be with continuous monitoring.
1. Introduction
Heavy metals are natural trace components of the aquatic environment, which may increase due to natural processes and anthropogenic activities which include domestic, industrial, agricultural, mining and others. Heavy metals are non-biodegradable with long resident time in the environment. Heavy metals have become one of the major environmental concerns due to their toxicity and accumulative behaviour [Citation1,Citation2]. The anthropogenic activities and waste discharges on the riverine ecosystems have been evolving and constitute environmental challenges in Nigeria over some decades. This is partly due to inadequate facilities and infrastructure in many urban settlements and especially rural communities in the country. Anthropogenic activities can effortlessly increase heavy metals concentrations in river water [Citation3]. Leachates of agrochemicals and fertilizers (which contain heavy metals) from farm settlements end up in many rivers. During transportation of heavy metals in the riverine system, they could undergo frequent changes due to dissolution, precipitation and adsorption phenomena [Citation4]. Heavy metals are the most important forms of aquatic pollutants and may accumulate in the tissues of fish, which are often at the top of the aquatic food chain [Citation1,Citation2]. Aquatic fauna are endangered by the progressive build-up and irreversible accumulation of metals in their organs and their host environment. Exposure to heavy metals has been linked to developmental retardation, various cancers, kidney damage and even death. Hence it is an important scientific study to measure the concentrations of heavy metals in the riverine ecosystem.
Rivers in the human environment are constantly being subjected to various threats [Citation5]. Osun River is one of the longest rivers in Nigeria, having a length of 267 km. The river has become a global and tourists’ attraction in Osogbo; Osogbo is the capital city of Osun State. The catchment area of Osun River is subject to natural activities such as weathering of rocks, soil erosion, leaching and human activities which including inappropriate discharge of wastes, run-off from domestic and/or municipal sewage, abattoir wastes and agricultural activities. It is not impossible that part of biological and chemical wastes from institutions, chemical laboratories and industries would end up in Osun River due to its proximity to major Institutions (Osun State University, Fountain University and hospitals). Several villagers, farmers and individuals make use of Osun River as one of the main sources of water for domestic, agricultural and irrigation purposes. Among these are dwellers of Coker Village, Swanlux farmers, local fishermen, and others. To the best of our knowledge, no known research has been published on the concentrations of heavy metals in the studied portions of this important river. This study aims at measuring concentrations of heavy metals in Osun River at some strategic locations in Osogbo city and at the pre-urban settlements of the river. The results of this study will also serve as a baseline/reference for monitoring future studies on the river.
2. Materials and method
2.1. Materials and instrument
All chemicals used in this study were of analytical grade. Instruments used were a probe meter (YSI Quatro ISE ISE), Global Positioning Satellite (GPS; Garmin Oregon 550), and Atomic Absorption Spectrophotometer (AAS; VGB 210 Bulk Scientific). All standard solutions for the heavy metals were of highest purity and supplied by Perkin Elmer AA Analyst. De-ionized water was used throughout the experiment to prepare all the solutions.
2.2. The study area
Osun River originates from Igede-Ekiti (in Ekiti State) and flows southwards through Southwestern Nigeria into the Lagos lagoon and the Atlantic Gulf of Guinea. Before flowing across Osogbo town in Osun State, the river meanders through many rainforests, farmlands and villages. The river flows across the southern part of Osogbo city (Figure ) and houses various fauna, especially catfish which are trapped and sold by local fishermen. According to 2006 population census, Osogbo has a population of 156,694 with an average annual rainfall of 350 mm. Osogbo and its Metropolis are characterized by tropical rainforest. The temperature of the city could be as high as 38°C in March and as low as 19°C in January. The study areas covered the pre-urban and urban parts of the river. The points of sampling in the Osun River are designated A–H (Figure ). Location A is the upstream while H is the downstream. Table contains the geographical coordinates of these locations. The sampling locations in this study have peculiar characteristics. Kajola Dam is sandwiched between A and B. The whole area (Kajola Dam) is about 2 km from Kajola community, surrounded by forest and has no residential building except an office belonging to the State’s Ministry of Water Resources overseeing the dam. C is surrounded by tropical forests and about 700 m from Coker village. Coker village had a population of 86 [Citation6] with farming as the major occupation of the inhabitants. D boarders Swanlux Farm which has an oil palm plantation. E is situated beside a bridge dividing Owode town (population = 83,831; 2006 cencus) from Osun-Jela community (a rural settlement); it is about 25 m from Osogbo-Ilesa road. F is beside a bridge along the newly constructed Oke-Osun road with relatively less urban activities; Fountain University is about 1 km from this location. This portion of the river contains some rocks, which forms its base. G is located in Gbodofan (a densely populated area of the city) and open to anthropogenic activities, domestic and industrial wastes. H is beside the road linking Ofatedo and Ogo-Oluwa areas of the town. The location is surrounded by shrubs and distant scanty, occupied buildings. Ebunoluwa International School is less than 1 km form this location.
Figure 1. Water sampling locations (A–H) in Osun River, Osogbo. The triangle, square and star represent Ebunoluwa International School, National Open University and Fountain University, respectively
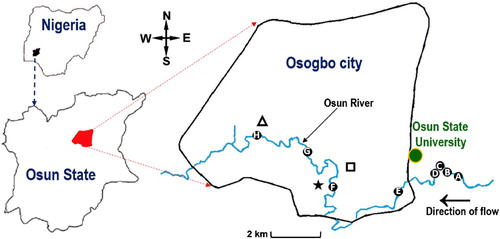
Table 1. The geographical coordinates of the sampling locations and average physico-chemical properties of Osun River.
2.3. River water sampling and heavy metals analysis
River water sampling was carried out on three different occasions between 2017 and 2018; specifically, in July (2017), February (2018) and July (2018). Samples were taken from eight (8) different points in the river (A–H; Figure ). The water was collected with a high-density polyethylene bucket thrown with a rope into sampling bottles, which were rinsed three times with river water before being filled. There was no precipitation at least 48 h before any sampling event. Physico-chemical properties of the river such as temperature, dissolved oxygen (DO), pH, conductivity, salinity and total dissolved solid (TDS) were measured with a field digital probe meter (YSI Quattro ISE). The geographical coordinates of the sampling points were measured with the GPS. Immediately after collection, samples were stored in clean 1 L polyethylene sample bottles and acidified to pH < 2 with nitric acid. They were stored in a refrigerator prior to analysis.
Five millilitres of HNO3/HCl (3:2) was added to 100 mL sample and digested at 130oC on a hot plate. After cooling, the digested sample was filtered with 0.45 mm membrane filter. The filtrate was made to 100 mL with de-ionized water and stored in clean polyethylene bottles for the analysis of heavy metals using atomic absorption spectrophotometer (AAS; model VGB 210 Bulk Scientific) as described in APHA [Citation7]. The heavy metals analysed in the river water were Ni, Zn, Cu, Pb, Cr, Mn, Fe, Cd and Co. To determine the concentrations of these heavy metals during the analysis, working calibration curves of the metals were prepared by the appropriate dilution of their commercially available Scharlau AAS standards (each metal = 1000 mg/L). Concentrations of the heavy metals present in the river water samples and the blank samples were determined (extrapolated) from their respective standard calibration curves. Analyses were run in duplicate to ensure the precision of the analytical procedure and instruments used.
3. Results
3.1. Physico-chemical properties
The measured salinity of the river was in the range of 0.06–0.17 ppt. The pH ranged 6.5–7.5, while the concentrations of total dissolved solids and in the river were 307–612 mg/L. The DO has an average value of 3.2 mg/L (range, 2.8–4.0 mg/L). Electrical conductivity was below 1000 µS/cm. Table presents detailed physico-chemical results.
3.2. Concentrations of heavy metals in Osun River
The results presented in Table show the range of metal concentrations measured in Osun River during studies in July (2017), February (2018) and July (2018) at the eight sampling locations. Co, Cr, Cd, Ni and Pb were of low concentrations. Range values of the concentrations were ≤0.04 mg/L (Co), ≤0.05 mg/L (Cr), ≤0.03 mg/L (Cd), 0.01–0.06 mg/L (Ni) and ≤0.08 mg/L (Pb). The heavy metals with elevated concentrations include Fe (0.01–4.47 mg/L), Zn (0.01–0.75 mg/L), Cu (0.02–0.36 mg/L) and Mn (≤0.41 mg/L). Table also shows results obtained in other studied rivers and some published standards. To better understand the trend of heavy metals distributions in Osun River between the pre-urban and urban settlements across Osogbo city, average concentrations of the detected metals (Ni, Fe, Cd, Pb, Zn, Cu and Mn) measured in July, 2017, February, 2018 and July, 2018 were plotted against the sampling points and are shown in Figure . On the average, Fe concentration in this study is equivalent to 76% of the total measured heavy metals. While 12% of the total heavy metals measured in the river was zinc, Cu and Mn accounted for 4% and 3.3%, respectively. Figure summarizes the average concentrations of the heavy metals in Osun River. The metal concentration (Figure ) is the average value of the concentrations obtained for each metal at the eight sampling locations during July (2017), February (2018) and July (2018) study events.
Figure 2: Distribution trend of the concentrations of major heavy metals at different locations in Osun River. Each value is an average concentration of the three measurements obtained in July (2017), February (2018) and July (2018) study events.
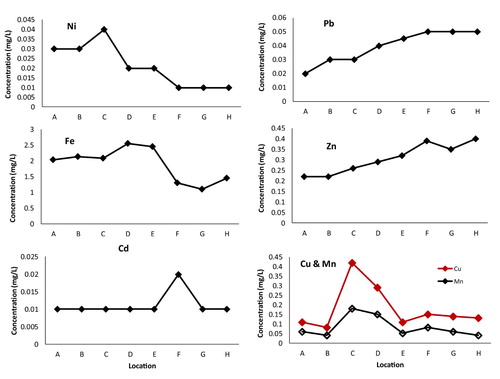
Figure 3. Concentrations of the measured heavy metals in Osun River. Results are expressed as mean ± SE. Metal concentration is the average value of the concentrations obtained for each metal at the eight sampling locations during July (2017), February (2018) and July (2018) study events.
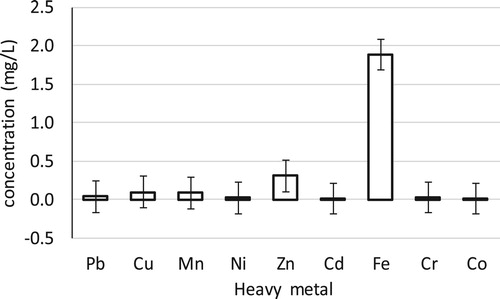
Table 2. Comparison of the average concentrations of heavy metals in Osun River with some guidelines for water.
4. Discussion
The average salinity in the river (0.09 mg/L) confirms it as a freshwater body. The pH results are consistent with those measured in rivers in other countries [Citation16,Citation17] and 6.5–8.5 specified for irrigation water and aquatic fauna [Citation9]. A low pH would cause more dissolution of metals in the river. Notwithstanding the river temperature, salinity and pressure which influence DO concentration in natural waters, the river DO was quite low (2.8–4.0 mg/L). This is undesirable as biological lives and functions could be adversely affected. Higher DO levels (5.0–6.0 mg/L) are needed to maintain a healthy aquatic ecosystem [Citation18]. During daytime, it is expected that algae photosynthesis in the river would produce oxygen. It was evident that the TDS in all the sampling points were not up to the maximum permissible level of 2000 mg/L recommended by FAO for irrigation water [Citation12].
Iron was the most abundant of all the measured heavy metals with an average concentration of 1.9 mg/L (Figure ). Fe is abundant in natural fresh waters and found at levels ranging from 0.5 to 50 mg/L [Citation15]. Swanlux farm is a large-scale palm-oil producing farm and would have appreciably contributed to the elevated concentration in the river. Hence, the high iron concentration in the river at D would, almost certainly, be due to the run-off and/or discharge of waste from the farm. Iron is a major component of palm fruits and its oil. The elevated iron concentration would be maintained, transported and measured at E due to their proximity. The metal concentration reduced drastically in the urban area of the river (Figure ). The reason for this is yet unknown. One possible pathway could be conversion to the insoluble Fe3+, thus reducing its aqueous availability and transportation of its soluble form to the downstream. It is necessary to state that Fe could be found in the river through natural deposits such as leaching of corroded metallic objects, and other anthropogenic activities.
Zinc was the second abundant heavy metal measured in the Osun River (Figure ), covering 12% and consistent with values obtained in Tembi River [Citation8]. The concentration of Zn ranged from 0.01 to 0.75 mg/L (average, 0.31 mg/L). Both natural and anthropogenic processes would be responsible for the 12% abundance (of the total measured heavy metals) of zinc in the river. Zn forms an integral part of soils and rocks. Rocks are located in more than 50% of the sampling points in this study. Sampling points B–G are littered with big rocks in the river. It is conceivable, therefore, that soil leaching and weathering of rocks would be important sources of high zinc concentration measured in the river. Other sources could include dissolution from zinc-galvanized materials and their burning, especially with its steady rise in concentration from the pre-urban settlement to the populated areas of the city.
Copper is one of the redox elements useful in all living organisms, especially in the respiratory enzyme complex. In the studied portions of Osun River, the average concentration of copper in Osun River was 0.1 mg/L (Figure ). The highest concentrations were measured at both Coker village (0.24 mg/L) and Swanlux Farm (0.14 mg/L) (average values of the three study events). Application of cocoa pesticides by farmers in these areas would be a major factor responsible for the high concentration of Cu in the river. Coker village and Swanlux Farm are both agricultural settlements where the use of agrochemicals such as pesticides and fertilizers on farmlands is inevitable. The use of copper-based fungicide by farmers is prevalent in Nigeria [Citation19].
Manganese is considered to be an essential element to the human body. The average concentration of manganese in the river was 0.08 mg/L. Like Cu, the concentrations of manganese are visibly higher at sampling locations C and D (i.e. Swanlux farm and Coker Village, respectively). In addition to dissolution of minerals in the soils and rocks, similar reason of use of agrochemicals could be a major source of the heavy metal at these locations. According to Figure , Cu and Mn have the same trend of distribution in the river, confirming that their presence would originate from the same source(s).
Lead is a toxic member of the heavy metals. Lead concentrations in the river were relatively low (<0.08 mg/L). There was a steady rise in Pb concentration as the river flowed from the pre-urban area to the city (Figure ). This was consequent to the increasing anthropogenic activities from the upstream to the downstream. The results also show that Osun River in the urban settlement contained Pb up to double of its concentration at the pre-urban settlement perhaps due to emissions from automobiles, electricity-generating sets and other anthropogenic activities. Lead-acid batteries, solder and alloys are all possible sources of lead. Lead concentrations in the river were up to 8 times higher than that specified for drinking water [Citation15]. Therefore, users of the river water in the pre-urban and urban settlements for domestic purposes should apply extreme caution as the Pb concentrations in both the settlements (average concentrations at the pre-urban and urban areas were 0.03 and 0.05 mg/L, respectively) are above the safe limit for drinking water [Citation15].
There seems to be little or no contribution of Ni by anthropogenic activities in the populated downstream part of the river (Figure ). This indicates that natural processes, such soil leaching, chemical weathering of rocks, etc., would be the dominant source of Ni in the river; nickel forms a major constituent of rocks. Cadmium stayed at 0.01 mg/L in most parts of the river, except at location F (Figure ) where a double concentration was measured. The concentration at this point, which is quite near Fountain University, could be due to nonpoint source pollution. Cd concentration in the river poses threat even at its low level.
Since Osun River is also used for domestic and agricultural purposes, the results in this study were compared with WHO standards for drinking water and standards for irrigation water (Table ). Also, to assess the pollution level by the heavy metals in Osun River, comparison was made with similar studies in other rivers and surface water as presented in Table . It is evident that the Osun River is not safe for drinking due to the higher level of Pb and Cd than the WHO permissible level for consumption [Citation15]. The results (Table ) also reveal some levels of heavy metal pollution in the river, especially when compared with average values of trace elements carried in solution by major unpolluted rivers in the world [Citation9]. However, concentrations of the heavy metals were within the permissible range for irrigation water. It should be reiterated that prolonged exposure to heavy metals such as lead, cadmium and copper can cause deleterious health effects in humans.
5. Conclusion
Except for Ni and Fe, concentrations of most of the heavy metals were lowest at the upstream (the pre-urban settlement). Kajola dam is a little far (∼ 2 km) from Kajola community where human activities could impact on the river; hence, the measured levels of heavy metals at these locations are justifiable. Iron was the predominant trace metal in the river and, though beneficial to the human body, its concentration at the Swanlux Farm shows the impact of the farm on the river. The general findings in this study which include detectable concentrations of Pb, Cd and the elevated concentrations of Fe, Zn and Cu, point to the fact that the natural matrix of Osun River is being altered by both natural and anthropogenic processes. The concentrations of the toxic heavy metals (Pb and Cd) in the river could be adjudged to pose some health threat, therefore, continuous evaluation and monitoring are essential in view of constant flow of human and industrial wastes into the river. More so, the aquatic fauna in the river are consumed locally such that those heavy metals could end up in the food chain.
Acknowledgement
The authors wish to thank Mr Ilias Olufemi Awoniyi of the Department of Biochemistry, Osun State University, Osogbo, Nigeria, for his technical support during the river water sampling.
Disclosure statement
No potential conflict of interest was reported by the authors.
ORCID
Adebanjo Jacob Anifowose http://orcid.org/0000-0002-2003-6591
Adedeji Waliyu Oyebode http://orcid.org/0000-0003-2204-9940
References
- Islam M, Ahmed M, Raknuzzaman M, et al. Heavy metal pollution in surface water and sediment: a preliminary assessment of an urban river in a developing country. Ecol Indic 2015;48:282–291. doi: 10.1016/j.ecolind.2014.08.016
- Martin J, Arana C, Ramos-Miras J, et al. Impact of 70 years urban growth associated with heavy metal pollution. Environ Pollut. 2015;196:156–163. doi: 10.1016/j.envpol.2014.10.014
- Sánchez-Chardi A, López-Fuster MJ, Nadal J. Bioaccumulation of lead, mercury, and cadmium in the greater white-toothed shrew, Crocidura russula, from the Ebro Delta (NE Spain): Sex- and age-dependent variation. Environ Pollut 2007;145(1):7–14. doi: 10.1016/j.envpol.2006.02.033
- Abdel-Ghani N, Elchaghaby G. Influence of operating conditions on the removal of Cu, Zn, Cd and Pb ions from wastewater by adsorption. Int. J. Environ. Sci. Technology. 2007;4:451–456. doi: 10.1007/BF03325980
- Alloway BJ, Ayres DC. Chemical principles of environmental pollution. London: Blackie Academic and Professional, An imprint of Chapman and Hall; 1997.
- NPC. Census report of the Federal Republic of Nigeria. National Population Commission, 2006.
- APHA. Standard methods for the examination of water and wastewater. 20th ed. New York: APHA, AWWA and WPCF; 1998.
- Shanbehzadeh S, Dastjerdi M, Hassanzadeh A, et al. Heavy metals in water and sediment: A case study of Tembi river. J Environ Public Health. 2014;3:1–5. doi: 10.1155/2014/858720
- WHO/UNESCO/UNEP. In: Chapman D, editor. Water quality assessment: a guide to the use of biota sediments and water in environmental monitoring. 2nd ed. London: F & FN Spon; 1996.
- Schiller A, Boyle E. Variability of dissolved trace metals in the Mississippi River. Geochim Cosmochim Acta. 1987;51:3273–3277. doi: 10.1016/0016-7037(87)90134-7
- Meybeck M. How to establish and use world budgets of riverine materials. In: Lerman A, Meybeck M, editors. Physical and chemical weathering in Geochemical Cycles. Dordrecht: Kluwer; 1988. p. 247–272.
- FAO. Water quality for agriculture. In: Ayers R, Westcot D, editors. FAO irrigation and drainage paper 29. Rome: Food and Agriculture Organization of the United Nations; 1994.
- New Jersey water supply, surface water quality and pollutant loadings. A Technical Report for the Raritan Basin Watershed Management Project, 2002.
- Brenner A, Hoekstra E. Drinking water quality standards and regulations. In: Ersoz M, Barrott L, editors. Best practice guide on metals removal from drinking water by treatment. London: IWA Publishing; 2012. p. 1.
- WHO. Guidelines for drinking-water quality: incorporating 1st and 2nd addenda. Vol.1 recommendations, 3rd ed. Geneva: World Health Organization; 2008.
- Anifowose AJ, Takeda K, Sakugawa H. Photoformation rate, steady-state concentration and lifetime of nitric oxide radical (NO) in a eutrophic river in Higashi-Hiroshima, Japan. Chemosphere. 2015;119:302–309. doi: 10.1016/j.chemosphere.2014.06.063
- Chidya R, Sajidu S, Mwatseteza J, et al. Evaluation and assesment of water quality in Likangala river and its catchment area. Physics and Chemisty of the Earth. 2011;36:865–871. doi: 10.1016/j.pce.2011.07.070
- Pearce G, Ramzan Chaudhry M, Ghulam S. A Simple Methodology for water Quality monitoring. Wallingford: Department for International Development, HR Wallingford; 1999.
- Mokwunye I, Babalola F, Ndagi I, et al. Farmers’ compliance with the use of approved cocoa pesticides in cocoa producing states of Nigeria. Journal of Agirculture and Social Research. 2012;12(2):44–60.