
Abstract
The eastern coast of the Red Sea is characterised by many coastal entrances that penetrate the sea. Its origins can be traced to the estuaries of ancient wadis that influenced the evolution of the geological environment, marine structures, and sea factors. The objective of this study is to discover the geomorphological development of Sharm Yanbu and to determine the factors of its development and the most important changes that occurred on the coast between 1990-2016. The study also aims to identify areas that have suffered a decline due to erosion and marine factors that have threatened tourism and economic development in the region. The risk of flooding in marine areas and surrounding sea floods during periods of high tide and storm waves is also examined to determine coastal ranges. Two Landsat images are used over a 26-years period to monitor changes in the coastline and identify the areas of decline through the satellite image analysis program. Radar data is also used to identify topography and surrounding areas, and to construct a pattern of occurrence of marine floods and identify areas likely to be covered by seawater in the future. The first factor is related to the geological formation and the structure that surrounds the sharm. The second factor is related to marine factors whose effects appear in the form of carving down and the dissolution of the limestone coastline to form grooves and trenches. The third factor relates to the topography of the low sloping coastal plain.
1. Introduction
Coastal areas are the most complex ecosystems across large and multiple margins of living and non-living resources [Citation1,Citation2]. It is also an important social and economic environment for the coastal cities of the world. It is worthy to note that coastal areas in many parts of the world are exposed to a series of natural hazards. Coastal erosion or sediment accumulation, anthropogenic pollution effect, and human activities surrounding coastal development that usually cause short-and long-term changes have contributed to the increased threat of decline in tourism and economic activities in the coastal areas [Citation3,Citation4]. Such changes can also affect human development, loss of life and property, danger in ports, alteration of the coastal social and economic environment, and a decline in the coastal area.
The coastline of any marine area is morphologically and dynamically unstable [Citation5,Citation6]. The different geological factors of erosion, sedimentation, deposition, earth movements, and estuaries may contribute to the construction of beaches by adding sediments and lifting processes, or beaches may eroded through drifting and transport processes. Furthermore, climatic factors increase or decrease the effect of sea currents and waves on the coasts through the effect of wind, temperature, and rain. Additionally, socioeconomic activities contribute to continuous changes in the development and construction of the littoral [Citation7,Citation8]. This study provides important data related to the identification of important changes that occurred on its site through the rehabilitation of its adjacent structures. This includes determining changes in the width, shape, and area of the beach and determines the rate of variables [Citation9–12]. The study of coasts is very important and useful for detecting the spatial changes that occurred during the geological time for the effectives and safe management of the coastal areas and their use in the socioeconomic development of the countries.
More than 60% of the world’s population resides in a coastal area [Citation6,Citation13]. Therefore, socio-economic activities are expanding significantly in all coastal regions of the world. As a result of the multiplicity of coastal ecosystems in the world, the principle of ecological balance in coastal areas is maintained through the distribution of nutrients and the transfer of energy through the day-to-day processes of those systems [Citation14].
The Red Sea coast is famous for the extension of the various coastal openings on its shores, taking on different local names such as Sharm, Khor or Marsa. Among them, sharm is most widely used. Many studies have been conducted on the sharms phenomenon along the Red Sea coast since the beginning of the twentieth century. Schmidt [Citation15] pioneered the research on the phenomenon of sharms propagation along the Red Sea coast. In addition, Butzer and Hansen [Citation16] interpreted the formation of sharms as a result of erosion processes during sea-level decline in the last glacial period, while Barodi [Citation17] examined the formation of the sharms on the eastern coast of the Red Sea and determined morphological characteristics and geomorphological development. He also explained that sharms are the estuaries of the submerged wadis, which are distributed from Jeddah in the south Gulf of Aqaba. In addition, recent studies have indicated an increase in temperature of about 0.74°C until 2006, and an increase in sea level of 10–20 cm between 1961 and 2006 worldwide [Citation18]. This means that high temperatures are accompanied by the melting of ice in the polar regions, leading to a rise in the level of seawater and oceans. Ahmad and Sultan [Citation19] also refer to the eustatic and isostatic changes in shorelines that lead to changes in the water level through expansion or decline during geological time, and further suggest that earthquakes play an important role in the formation of these changes. Nofal and Abboud [Citation20] observed the most important geomorphological changes that occurred on the coast of Ras Al-Shabaan on the Red Sea coast through remote sensing and the geographic information system (GIS). The result was the appearance of some new areas in Ras Al-Shabaan and the flooding of other areas as a result of the dissolution, erosion, and transport processes.
Sharms are influenced by various processes of marine erosion, where waves play an important role in sculpting the coast. There is no doubt that the coastal currents generated within sharms have a crucial role in the transfer of sediments. Tidal processes also play an important role through water increases, where parts of the coastal rocks become wet and cause it to dissolve because it is composed of calcareous formations. The main reason behind the efficiency of the sculpture and transport processes in sharms is rock type and structure, where previous processes are more likely to occur if the coasts are composed of rocky fragments or carbonate rocks that are easily affected by dissolution and transport. However, if high tide coincides with storm waves, there is a flood in the sea where the water level rises to cover large parts of the coastal plain. In short, the Sharm Yanbu region is directly affected by several variables, making it vulnerable to marine flooding and also to coastal erosion. This fact should be taken into account when developing plans for this region. The effect of previous marine factors on the change of coastlines in the study area and impact on the shape of these coasts were observed either by sculpting or sedimentation (see study Figures).
Recent studies have demonstrated the importance of remote sensing techniques and GIS systems in disaster management. The historical disasters of an area can, therefore, be explained through the database provided by remote sensing and GIS. Moreover, new maps of possible future risks are developed through historical information and possible vulnerabilities. Any area can be rehabilitated by organizing the information obtained for the potential damage as well as possible development of the post-survey area and evaluation of sites eligible for reconstruction using GIS. It can also be used to identify details of new situations and update data for reconstruction for prevention of future disasters.
With the help of GIS and remote sensing techniques, this study aims to: (1) identify the areas most vulnerable to marine flooding, as well as those most vulnerable to coastal erosion and its various effects on the coast and socioeconomic facilities. This will help potential planners and developers in the region to avoid inappropriate gaps in development processes or develop solutions to eliminate their hazards before they begin development processes; (2) identify and observe the density and rate of propagation urbanization and other development patterns along the Saudi Red Sea coast in general, and in the area of study in particular; and (3) discuss the possibility of exposure to marine floods due to the geology setting of the study area.
2. Study area
Figure illustrates the study area that lies between 24°9′12.77″–24°12′36.13″N latitude and 37°54′2.08″-37°59′56.59″E longitude. Sharm Yanbu, located northwest of the city of Yanbu, is approximately 15 km across the study area. Many shrubs and landscapes extend from north to south, which is characteristic of the unique morphological phenomena of the Red Sea coast of Saudi Arabia. Divided into two main branches, there is an average length of approximately 8 km and an average width of approximately 0.8 km. Each branch has a number of small dry wadis that are active seasonally and are important as they pour into the eastern branch, such as wadi Ozrah and wadi Ghraa. However, wadi Elkabet (considered the main wadi) pours into the western branch (Figure ). This area is considered a suitable area to predict coastal changes, whether in the sharm area or adjacent residential areas along the Yanbu coast. The sharm area is unstable because of the amount of annual sediment that comes with the flow of water through the seasonal wadis, besides the effect of waves and currents on coastal carbonate rocks.
Figure 1. Location, shape, and geological map of the study area.
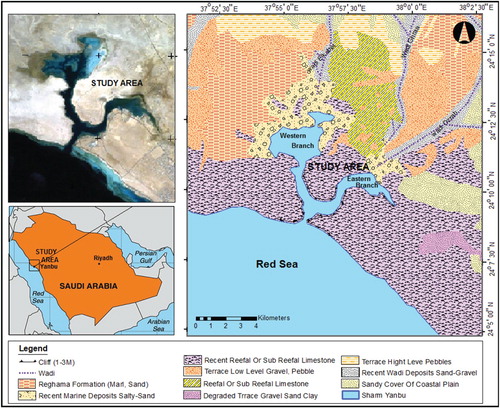
The geological map (Figure ) shows that the sharm is formed of Pleistocene limestone. The scattered remains of coral rocks in the sharm area indicate that this area was the Pleistocene Gulf – the largest of its kind along the eastern coast of the Red Sea. Barodi [Citation17] investigated the geomorphological development of the sharms and derived their origin on the basis of the estuary having submerged wadis that developed in two phases: the first is the oldest and synchronized with the gradual increase of sea level following the last glacial Ferm period, and the second was the most recent occurring before Flanders receding, where sea level rose three metres above its current level during the Tyranny of Flanders. This increase contributed to the immersion of seawater in sharm, which helped to expand the volume and diminish the growth of coral reefs. During the Late Pleistocene, there was a drop in sea level to its current level where the terrace was raised about 3 m above the current sea level. While later erosion processes removed large parts of the terrace. The growth of coral reefs also indicates that wadis deposits are being stopped.
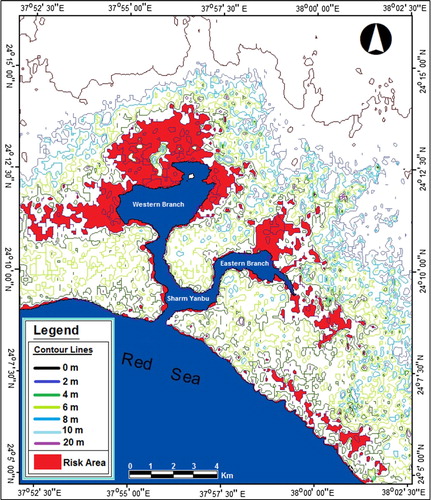
With the contour map (Figure ) it is possible to observe that the lowest zones in the level between 0 and 2 m surrounded all parts of the western branch of Sharm Yanbu. Contour map was obtained through the Digital Elevation Model (DEM) after the introduction of Shuttle Radar Topography Mission (SRTM) one arc second data to Envi and ArcGIS v.10.1 programme and processing by special analyst tools. The areas with the highest slopes are covered at the top of the eastern branch of Sharm Yanbu. The topographical effect of the Earth’s surface around the sharm area will undoubtedly take place when it is exposed to any kind of marine flood.
Figure 2. Contour map and risk areas of the study area.
The study area is located in a warm and dry desert climate with an average daily temperature of approximately 40°C. The speed and direction of the wind in the study area is characterized by instability with an increase in speed towards the north, where the wind system is affected by regional seasonal changes [Citation21] and where the wind often blows from the north or northwest, and the average speed is approximately 10 km/hr. The average height of sea waves striking the coral reef and breaking on the beach is about 30 cm to 1 m [Citation22].
3. Methodology
The methodology of this study includes three main processes: (1) image pre-processing; (2) image processing to determine coastal shifting rates; and (3) forecasting and drawing a flood risk map on the coast. To obtain the exact results of this study, we used Envi 5.3 and ArcGIS 10.1 software (Figure ). As for the field measurements, the effects of the progress and the regression of the sea were based on images. Figure shows some areas where sea regression occurred at Sharm Yanbu, and the impacts on threatened residential areas in Sharm Yanbu.
Figure 3. Flow chart of extracting shoreline from images and determination flood area.
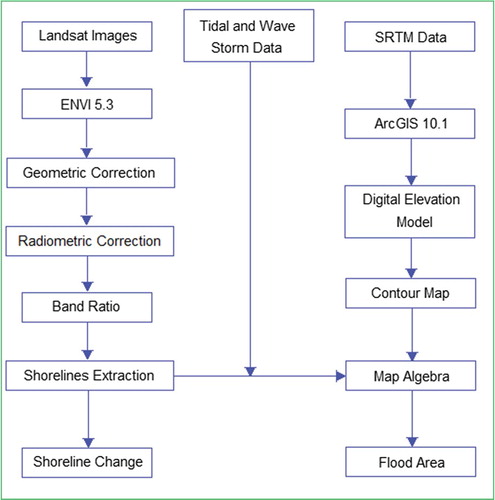
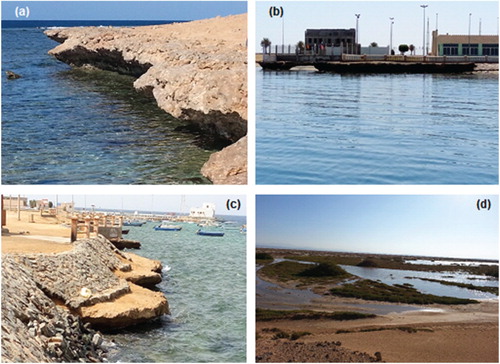
Figure 4. (a) Subsequent sculpting and dissolving processes in limestone groves in the eastern branch of sharm. (b) Corrosion erosion of buildings and roads. (c) The protection measures are being undermined due to the lower sculpture. (d) Sabkha lagging behind the invasion of sharm water for coastal areas.
3.1. Image pre-processing
Depending on the purpose of the study, pre-processing images are examined prior to any treatment to match them and to ensure that they more suitable for the purpose of the study (Table ). In this study, a band rationing technique was used leading to the extraction of coastal data, which means that Landsat images must be geometrically coincident and radiometrically harmonious. If such terms are not met, there are variations in the values of the relationships. This leads to the fact that reality is reflected in different places and has nothing to do with the effects of terrestrial coverage or landscape [Citation23,Citation24]. For example, we can obtain false values or proportions and changes in pixel values due to the redistribution process during the geometric correction process. Therefore, Landsat images are used prior to processing and the radiometric correction process is initiated to limit changes in unwanted pixel values.
Table 1. Shows the source of the satellite images used in this study and the date of acquired.
3.2. Geometric correction
The TM and Landsat-8 images of ortho-rectified products were used in this study in reference to the metadata information already present in the preliminary data of the World Geodetic System [Citation25] and the Universal Transverse Mercator (UTM) projection procedure. To obtain a high geometric quality for these images, the geo-referenced was based on a topographical map of 1982, with a scale of 1:50000.
The most modern topography of the Survey of KSA of 1982 (scale 1:50000 in digital format) was used as an essential maps for georeferencing the Landsat-5 TM image obtained in 1990 for UTM/Carthage/Zone 37 North projection. In addition, it was believed that the 1990 image was the main image from which the other views were sequentially georeferenced. Then the polynomial was sequentially converted from the first degree to samples of the closest and adjacent images by stabilizing the pixel values for all the images being processed.
3.3. Radiometric correction
By using radiometric correction for further resolution of the images used in this study, the contribution of the atmosphere is reduced and lighting, visibility angles, terrain impacts and sensor calibration are further reduced [Citation26]. Correcting the atmosphere is important for minimizing the effect of the radiation dispersion, which is inversely proportional to the length of the wavelength. Therefore, shorter waves are more scattered than longer waves, and calculated ratio is closer to actual ratio [Citation4,Citation26,Citation27]. A simple, powerful model was used to reduce the negative impacts of the atmosphere on the image by subtracting the dark object [Citation28], where the clean and deep water of the Red Sea was used to the west of the study area.
Later, the ENVI v.5.3 software was used for radiometric correction utilizing the atmospheric correction tool, where the sensors were remotely calibrated and combined with the solar radiation and the angular effect of this state. All parameters were also reviewed in the Landsat metadata documents used in the radiometric correction process, such as subtraction and gain, dawn, satellite viewing angles, light intensity, opacity, etc. In addition, the effect of the ground in the radiometric correction process was reduced to a minimum in the case of low terrain [Citation8,Citation29], and the relationship also shows a much lower slope than expected [Citation6,Citation26].
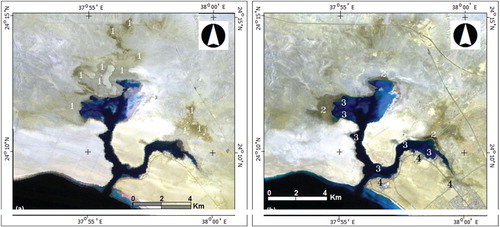
After making corrections and improvements to the satellite images used in this study, and through the integration of bands (1-3-4) we can, through Figure note the following:
The satellite image of 1990 (Figure (a)) shows the effects of sea floods of a large-scale in the study area, and these areas are indicated by number 1.
In the satellite image of 2016 (Figure (b)), new areas that have appeared in the form of wet sabkhas can be observed and are indicated by number 2. It is also possible to note the areas where sea retreats occurred and are indicated by number 3. Urban crawling zones can also be observed in the study area and are indicated by number 4.
Figure 5. Satellite images of the study area, after improvements and integration of bands (1-3-4). (a) image taken in 1990, the areas pointed by number 1 indicate the effects of marine flood waters. (b) image taken in 2016, the number 2 refers to wet sabkha areas, the number 3 refers to areas of sea retreat, and number 4 refers to areas of extension of urbanization and human expansion.
3.4. Shoreline extraction and shoreline change
In this study, the band ratio technique was used for the study of Sharm Yanbu coast through Landsat images to determine the characteristics of the current coast and to discover the changes that have occurred in the beach during the last 26 years. This technique has been used for rapid implementation without the need for an operator [Citation2,Citation30,Citation31]. The technique is also based on the use of infrared wavelength ranges that are absorbed by the water and strongly reflected by landscapes, vegetation, and soil, regardless of their type [Citation2,Citation32,Citation33].
To illustrate changes in the coastline by ENVI v.5.3, two images of a Landsat TM type (acquisition data May-1990) and Landsat Operational Land Imager (OLI) (acquisition time June-2016) [Citation34] were used for a significant time difference between them of approximately 26 years, followed by four steps that led to the extraction of changes that occurred on the coast. The first step begins with the selection and calculation of similarities and differences between the two images from 1990 and 2016 with band combination of 1, 3, and 4 as a result of their time difference (Figure ). A ratio of wavebands with Landsat data (bands: B5/B2) is used if the TM data is used and a ratio of wavebands (B6/B3) is used in the Operational Land Imager (OLI) technique [Citation2,Citation33,Citation35].
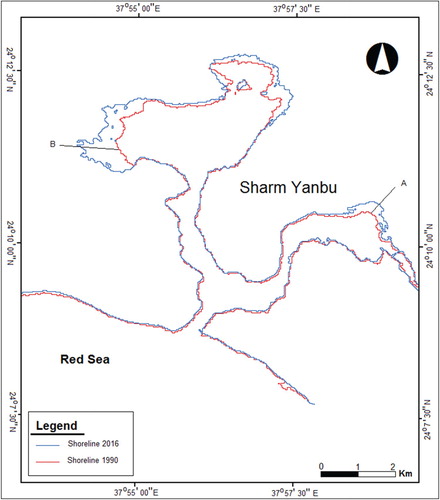
Figure 6. Changes in the shoreline between 1990 and 2016.
The second step is to re-categorise the ratios as those less than 1 are ranked based on water pixels and zero ratios are classified as background pixels. In the third step, the images are transferred to ArcGIS and converted from raster to vector, where the characteristics of the coasts are extracted and applied only once in binary images. Therefore, through ArcGIS, a simple model was used to obtain the change that took place in the Sharm Yanbu coastal area.
3.5. Coastal flood model
For the ideal planning of socio-economic activities in any coastal area within the framework of comprehensive local development, the establishment and study of coastal flood risk maps are very important preliminary steps in understanding and assessing the future and the projected state of danger for the region. Information is obtained from Landsat images that are used to establish coastal flood risk maps and identify coastal infrastructure that is vulnerable to specific frequency flooding in the region for the previous period [Citation4,Citation36].
A data study related to tide in the 2006–2016 period proved that the average increase in water level of approximately 60 cm is a small increase and does not lead to significant problems. It does however, impact on the carbonate rocks of the beach, increase dissolution processes, and causes undercutting in the areas of the furrows. In addition, the waves are weak near the coast, and data and field observations showed that the waves in normal conditions do not exceed the height of the coast at 40 cm, contrary to what has been observed since the high level of water inside the sharm. Therefore, it is necessary to measure the height of the water within the sharm through field investigations as there is no station to measure the marine factors within the sharm to identify the maximum water increase and the time of occurrence. In fact, examining the effects of water on the vertical slant areas, which are almost at a vertical angle in the sharm, found that the maximum water height is about 2 m. This occurs when the high tide coincides with the occurrence of storms, which leads to an increase in the water level in sharm. It is important to note that at the same time, the water level in the open sea next to the sharm is lower, where a record height of 160 cm is a result of the rise of water within the sharm. This is higher than the open sea due to its retention within the sharm and then rises to sharm level from the open sea.
ArcGIS 10.1 programme was used to analyse the vulnerability functions of risk elements and calculate the flooded area of the coast.
In addition, in this study, the following process was used for sweeps takes and for examining the evolution of coastal hazard maps; (1) identifying, acquiring, collecting, surveying and reviewing the tide frequency information available at the Yanbu tide station; (2) integration of maximum sea level elevations (tidal and wave storm); (3) data topography of the coastal plain derived from SRTM 1 Arc-second to determine flood areas using GIS; (4) use of ArcGIS v-10.1 (spatial analyst tools-map algebra) to calculate the flooded area of the coast.
4. Results and discussion
Sharm Yanbu is about 15 km away from the residential city but has become an integral part of it. However, the expansion of the road network around Sharm Yanbu and the selection of a large area on the east side for the construction of university faculties, as well as other university cities in this area, will result in an unprecedented pace of construction. Therefore, this study refers in part, to the discussion of changes in the coastline to determine the causes of withdrawals and to examine the area most prone to this decline. On the other hand, due to the low topography of the coastal plain and the low slope, the focus is to identify the areas that can be covered by the high level water in the sharm in order to alert to the dangers that surround this region, which is an important and direct objective of rapid and increasing human development.
In general, any change in the level of marine and ocean waters is one of the important factors in the development of coastal zones and may pose a serious threat to some aspects of the coast, such as the formation or destruction of bays and sharms. When water is trapped inside the bodies of these coastal phenomena, it leads to an unusually high water level and attacks parts of the coast that are normally not reachable by sea water. Undoubtedly, this is a danger to the areas of human activity on the coast, and also affects future plans for coastal development.
Coastal areas are dynamically unstable as they show the effects of many different physical processes such as tidal flooding, sea level rises or fall due to tectonic processes, erosion and sedimentation of wave action, and the action of the external water of valleys and water flows. Those valleys are dry and intermittent, where water flows in the form of floods or sudden flooding, adding an unknown amount of water or annual sediments that have a direct impact on coastal areas. These physical processes then play an important role in the remodelling of the coastline and the changing coastal landscape of beaches around the world. Since the coastline is the line that separates the body of water and the earth, it is most exposed to the action of unstable water. Therefore, these changes in coastline should be followed through annual aerial photographs, Landsat data and coastal re-mapping to observe the continuous coastal changes and development, and to assess the potential hazards that may occur in the near or distant future. In recent years, coast shifts have been automatically extracted from satellite optical images. The Landsat method, which is subject to evaluation [Citation30,Citation37,Citation38], controls the tracing of coastlines using the threshold technique [Citation4,Citation8,Citation33], which is considered to be the most widely used method, and is more commonly used as a method for the comparison of bands [Citation30,Citation33,Citation35,Citation39].
A study of tidal data recorded at the Yanbu Environmental Protection Station in the last ten years proved that the average rise in sea level during tide reaches 60 cm along the Yanbu coast. It is assumed that the marine factors of waves and tides have a weak impact on the coast in general, but for the area of study it is different for several considerations:
Sharm originated from rocks and carbonates reefs and is easy to dissolve.
The sharm is a marine channel that penetrates the land of the coast, which helps to maintain the water inside to a high level, especially when the occurrence of high waves in the case of storms and tides is combined.
It integrates the low level with the low slope of the coastal land around the two branches of shram.
All of the above provided important reasons for the study of the area, especially because of rapid urbanization in the sharm area.
Erosion processes and wave action affect sharm formation in the study area. The currents generated in sharm water play an important role in the movement, transport, and deposition of sediments. In addition, the tide works to dissolve the carbonated rocks of the coast. Therefore, flooding occurs if high tide coincides with the action of waves and storms, as large parts of the coastal plain are flooded with water. To address this problem and to discover the extent of threat to the coast and economic and social development, GIS techniques and remote sensing applications were used to monitor the coast and to examine how quickly it was reduced using two generations of Landsat satellite imagery within a period of 26 years. Thos also shows the coastal areas threatened by drowning in case of sea flood, based on the altitudes map of the region and the high level of water expected in the sharm.
Investigating the origin and development of Sharm Yanbu, it is clear that it is one of the weak areas of the coast that can be submerged by seawater from tides or waves. On the one hand, we find that the sea plain has a slight slope and low level (Figure ). In addition, we observe the increase in sea level during the combination of high tide with storm waves, which causes water to rise within it to about 2 m. The red colour in Figure shows the areas at risk from Sharm Yanbu, which are flooded by water through high tide or high waves and storms.
Many studies conducted on the study area in the 1990–2016 period showed that there was a decline in almost all sectors of the coast (Figure ), with a water covered area of 3.2 km2. So an area of 123 m2 from the coastal plain covered the water annually. This water intrusion may have helped to extend the two branches within the old and dry water tributaries, in addition to the simple general decline of the coastal plain and the components of limestone and reef, which helps to dissolve and accelerate the decline of the coast with time.
In general, it was observed that the withdrawal at the coast in the western branch of sharm is much larger than the eastern branch, which is consistent with the topography of the coastal plain around the western branch (characterized by little slope and level; Figure ). The maximum withdrawal was in the western branch of the sharm along sector A, where the coastline was 1.1 km, while the eastern branch reached the maximum decline of approximately 280 m along sector B (Figure ).
This variation is due to the shortening of the coast between the eastern sharm branches, which appears to be slightly lower, compared to the western branch. The eastern branch is surrounded by furrows of medium altitude and therefore the slope of the coast is due to carvings in these furrows (unlike the western section surrounded by land) and is relatively low with withdrawals a result of operations of immersion in the sea. In other words, it is possible to suggest that the decline of the coast in the western branch of the sharm is not a cut of the coastal rocks but is covered by water in the lower parts of the coastal plain. Over time, the dissolution processes of surface-coated surface rocks are gradually reduced and become part of it.
The coastline backtracking has been monitored in the field. It has been observed that some of the areas with high rates of erosion and dissolution were composed of limestone and reefs. Because the shore formations in the study area are limestone, it is difficult to separate the processes of dissolution from erosion. Both processes occur to coast rocks at the same time. Wave activity causes sculpting and erosion, while water level changes between tides through limestone formation, which contributes to dissolution processes. However, the role of dissolution in limestone formations is more likely than that of sculpture and erosion. Therefore, rocky caves appear and form on the beaches due to the intrusion of seawater into the coastal rocks and the processes of dissolution and undermining begin (Figure (a)). There is also water penetration on these beaches below parts of the main road and some infrastructures (Figure (b)), which was of course, far from the old coastline, but now suffer from the effects of water infiltration. Therefore, local authorities have resorted to protecting some parts of the coast by creating a natural rocky cover to protect it. However, seawater has also penetrated below it, eroding the rock and causing some of its parts to fall (Figure (c)). This also applies to some structures and tourist facilities that have been suffering from the problems of carving the coast. This problem may be overcome by carrying out non-scientific protection measures, however, this may be limited by the limestone formations of the coastal rocks that have dissolved in the seawater, which works to create cavities of different sizes below the protected areas, further leading to cracking and collapsing.
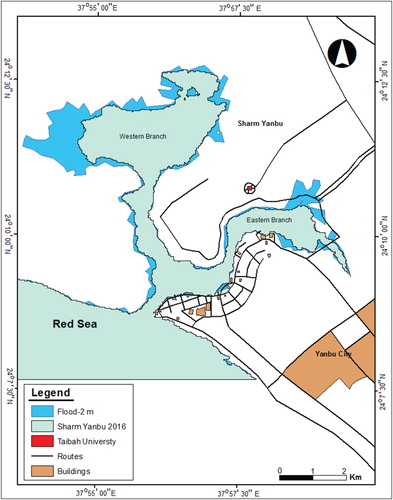
The rapid withdrawal of the coast and the large areas covered by seawater, beside the rapid urbanization of this dangerous area, were the main reasons behind this study to try to identify the real situation that occurs in the zone when the levels of water increase in sharms. Through the relationship between the topography of the coastal plain and the rising sea level when high tide and storm waves are combined (where the level of water trapped within the sharm is about 2 m), it was observed that water may exceed the coastline limit in many locations and may cover additional areas up to 1.8 km (Figure ). The extent of wetlands, marshes, and coastal sabkhas is a sign of the occurrence of floods in the sea with their ability to cover large parts of the coast. The extent of these sabkhas (Figure (d)) and marshes was observed in large parts of the coast, especially in the western branch of sharm. Therefore, it was observed through satellite photos that the boundaries of these sabkhas and marshes largely correspond to the limits reached when investigating the possibility of marine flooding at a water level height of 2 m.
Figure 7. Areas within the sharm that is likely to be flooded when the water level rises to 2 metres and more.
5. Conclusions
The current study employed remote sensing techniques and geographic information systems as a means of obtaining results that are useful for decision makers when considering design and development projects in the study area. The areas of sharm in general (and Sharm Yanbu, in particular), are attractive areas for tourism and residential and commercial development projects. The study area was observed in an area of horizontal urban extension, which is associated with low elevation areas, furrows, trenches, and cliffs overlooking sharms. It was recently observed that urban growth began to occur in the low coastal areas near the current coast. It was also observed that the buildings of Taibah University are located near the coast (Figure ), indicating the general orientation of the state development of the coastal zones surrounding the sharm, ignoring the future hazards which surround this area.
The study showed that there are certain issues related to coastal decline, especially in the western branch of Sharm Yanbu, where the rate of decline is greater than the eastern branch. This decrease in the coast of sharm is due to a number of factors. The first factor is related to the geological formation and the structure that surrounds the sharm, which is mainly composed of limestone (Figure ). The second factor is related to marine factors in the study area, whose effects appear in the form of bottom carving processes and the dissolution of the limestone coastline to form furrows and ditches (Figure ). The third factor is associated with the topography of the low sloping coastal plain (Figure ), which facilitates the coverage of seawater to large parts of the coast, especially the western branch of the sharm. The study was conducted to identify hazardous coastal areas that are expected to be flooded with tides and storm waves at the water level of 2 m (Figure ), which can be avoided when developing future plans.
Disclosure statement
No potential conflict of interest was reported by the authors.
ORCID
Ramadan Abd Elhamid Nofal http://orcid.org/0000-0003-0846-5446
Iyad Ahmed Abboud http://orcid.org/0000-0001-5182-9677
References
- Constanza R, D’Agre R, Groot DR, et al. The value of the world’s ecosystem services and natural capital. Nature. 1997;387:253–260. doi: 10.1038/387253a0
- Masria A, Nadaoka K, Negm A, et al. Detection of shoreline and land cover changes around Rosetta promontory, Egypt, based on remote sensing analysis. Land. 2015;4:216–230. DOI:10.3390/land4010216.
- Pardo-Pascual JE, Almonacid-Caballer J, Ruiz LA, et al. Automatic extraction of shorelines from Landsat TM and ETM multi-temporal images with subpixel precision. Remote Sens Environ. 2012;123:1–11. doi: 10.1016/j.rse.2012.02.024
- Kumaravel S, Ramkumar T, Gurunanam B, et al. An Application of remote sensing and GIS based shoreline change studies – a case study in the Cuddalore District, East Coast of Tamilnadu, South India. International Journal of Innovative Technology and Exploring Engineering (IJITEE). 2013;2(4):211–215.
- Bagli AS, Soile P. Morphological automatic extraction 393 of Pan-European coastline from Landsat ETM+ images. 5th International Symposium on GIS and Computer Cartography for Coastal Zone Management, Genova, Italy; Oct 2003.
- Ghosh MK, Kumar L, Roy C. Monitoring the coastline change of Hatiya Island in Bangladesh using remote sensing techniques. ISPRS J Photogramm Remote Sens. 2015;101:137–144. DOI:10.1016/j.isprsjprs.2014.12.009.
- Boak E, Turner I. Shoreline definition and detection: a review. J Coast Res. 2005;214:688–703. doi: 10.2112/03-0071.1
- Temiz F, Durduran SS. Monitoring coastline change using remote sensing and GIS technology: a case study of Acıgöl Lake, Turkey. IOP Conf Ser Earth Env Sci. 2016;44(042033). DOI:10.1088/1755-1315/44/4/042033.
- Dolan R, Fenster SM, Homes SJ. Temporal analysis of shoreline recession and accretion. J Coast Res. 1991;7:723–743.
- Smith AWS, Jackson LA. The variability in width of the visible beach. Shore Beach. 1992;60:7–14.
- Komar PD. Wave erosion of a massive artificial coastal landslide. Earth Surf Processes Landforms. 1998;23:415–428. doi: 10.1002/(SICI)1096-9837(199805)23:5<415::AID-ESP855>3.0.CO;2-T
- Moore LJ. Shoreline mapping techniques. J Coast Res. 2000;16:111–124.
- Doukakis E. Coastal vulnerability and risk parameters. Eur Water. 2005;11:3–7.
- UNEP (United Nations Environment Programme). The world environment 1972–1992: two decades of challenge. New York: Chapman & Hall; 1992.
- Schmidi W. Die scherms and der rotmeckuste von el-hedschas, pet. Mitt. 1923;69:118–121.
- Butzer KW, Hansen CL. Desert and river in Nubia. Madison: University of Wisconsin Press; 1968. p. 562.
- Barodi. Geomorphology of shram on the eastern coast of the Red Sea (Saudi Arabia). J Kuwaiti Geogr Soc. 1990;133:3–83. (in Arabic with English abstract).
- Pachauri RK, Reisinger A, Change C4. 2007: synthesis report. Contribution of working groups I, II and III to the fourth assessment report of the intergovernmental panel on climate change. Geneva: IPCC; 2007.
- Ahmad F, Sultan SAR. Tidal and sea level changes at Jeddah, Red Sea. Pak J Mar Sci. 1993;2:77–84.
- Nofal R, Abboud IA. Geomorphological evolution of marine heads on the eastern coast of Red Sea at Saudi Arabian region, using remote sensing techniques. Arabian J Geosci. 2016;9:1–15. doi: 10.1007/s12517-015-2234-4
- Patzert WC. Wind-induced reversal in Red Sea circulation. Deep Sea Res. 1974;21:109–121.
- Rao NVND, Behairy AKA. Nature and composition of shore–zone sediments between Jeddah and Yanbu, Eastern Red Sea. Mar Geol. 1986;70:287–305. doi: 10.1016/0025-3227(86)90006-X
- Song C, Woodcock CE, Seto KC, et al. Classification and change detection using Landsat TM data: when and how to correct atmospheric effects. Remote Sens Environ. 2001;75:230–244. doi: 10.1016/S0034-4257(00)00169-3
- Zhan X, Sohlberg RA, Townshend JRG, et al. Detection of land cover changes using MODIS 250m data. Remote Sens Environ. 2002;83:336–350. doi: 10.1016/S0034-4257(02)00081-0
- WGS. 1984. WGS 84: World Geodetic System 1984, used in GPS. Is WGS84 a coordinate system or projection system? Available from: https://epsg.io/4326.
- Mather PM, Koch M. Computer processing of remotely-sensed images: An introduction. 4th ed. UK: Wiley–Blackwell; 2011. p. 460.
- Shettya A, Jayappaa KS, Mitrab D. Shoreline change analysis of Mangalore coast and morphometric analysis of Netravathi-Gurupur and Mulky-Pavanje spits. Aquat Procedia. 2015;4:182–189. INTERNATIONAL CONFERENCE ON WATER RESOURCES, COASTAL AND OCEAN ENGINEERING (ICWRCOE 2015). DOI:10.1016/j.aqpro.2015.02.025.
- Chavez PS Jr. Image-based atmospheric corrections. Revisited and Improved. ISPRS J Photogramm Remote Sens. 1996;62:1025–1036.
- Hantson S, Chuvieco E. Evaluation of different 437 topographic correction methods for landsat imagery. Int J Appl Earth Obs Geoinf. 2011;13:691–700. doi: 10.1016/j.jag.2011.05.001
- Guariglia A, Buonamassa A, Losurdo A, et al. A multisource approach for coastline mapping and identification of shoreline changes. Ann Geophys. 2006;49:295–304.
- Chand P, Acharya P. Shoreline change and sea level rise along coast of Bhitarkanika wildlife sanctuary, Orissa: an analytical approach of remote sensing and statistical techniques. Int J Geomat Geosci. 2010;1:436–455.
- Alesheikh AA, Ghorbanali A, Nouri N. Coastline change detection using remote sensing. Int J Environ Sci Technol. 2007;4:61–66. doi: 10.1007/BF03325962
- Cui BL, Li XY. Coastline change of the Yellow River estuary and its response to the sediment and runoff (1976–2005). Geomorphology. 2011;127:32–40. doi: 10.1016/j.geomorph.2010.12.001
- https. 2017. [cited 2017 July 31]. Available from: https://earthexplorer.usgs.gov/, page last modified.
- Kuleli T. Quantitative analysis of shoreline changes at the Mediterranean coast in Turkey. Environ Monit Assess. 2010;167:387–397. doi: 10.1007/s10661-009-1057-8
- Samanta K. Modelling coastal flood hazard using ArcGIS spatial analysis tools and satellite image. Int J Sci Res. 2012;3:961–967.
- Lambeck K, Antonioli F, Anzidei M, et al. Sea level change along the Italian coast during the Holocene and projections for the future. Quat Int. 2010; online:8.
- Hereher ME. Mapping coastal erosion at the Nile Delta western promontory using Landsat imagery. Environ Earth Sci. 2011;64:1117–1125. doi: 10.1007/s12665-011-0928-9
- Thao PTH, Duan HD, To DV. Integrated remote 460 sensing and GIS for calculating shoreline change in Phan-Thiet coastal area. International Symposium Geoinformatics for spatial infrastructure development in earth and Allied Sciences; 2008 Dec 4–6; Hanoi, Vietnam. p. 6.