
 ?Mathematical formulae have been encoded as MathML and are displayed in this HTML version using MathJax in order to improve their display. Uncheck the box to turn MathJax off. This feature requires Javascript. Click on a formula to zoom.
Abstract
Growth and characterization of nonlinear optical (NLO) crystal of (((4-aminophenyl)sulphonyl)oxy)zinc(II)chloride (4-ASZC), based on zinc chloride with sulphanilic acid by the slow evaporation method has been studied and reported in this paper. The single crystal X-ray diffraction study confirmed the monoclinic system with centrometric space group P21. The sharp Bragg’s peak in powder X-ray diffraction analysis identifies the crystalline nature. Optical properties, such as low cut-off wavelength (251 nm), optical band gap (Eg = 4.40 eV), reflectance (R), extinction coefficient (K) and refractive index (n), are calculated from the UV-vis-NIR spectrum. The presence of functional groups are confirmed by the FT-IR spectroscopy. The placement of protons and carbons was determined by the NMR technique. The photoluminescence study shows the green light emission. The grown crystal is thermally stable up to184°C. The NLO efficiency is 0.5 times greater than that of standard KDP. The mechanical properties were analysed. The dielectric constant (ϵ), dielectric loss (ϵ′), imaginary dielectric constant (ϵ″), AC conductivity (σac) and Cole–Cole graphs were plotted. The surface morphology and the particle size of the crystal were determined by the FESEM technique.
1. Introduction
Nonlinear optical semi-organic materials play a wide role in fast-developing fields such as optoelectronics, optical modulation, optical switching frequency shifting, signal processing, sensor, and optical data storage for the development of technologies in telecommunication and information process [Citation1–5]. This nonlinear optical materials are very important for the current researchers due to its commercial importance for producing the second and third harmonic generation and have been studied over the past three decades [Citation6–8]. The special types of organometallic molecules and bulk size crystals have been examined for their optical properties [Citation9,Citation10].
In the review of literature of sulphanilic acid and its base crystals: methylammonium sulphanilate [Citation11], tetrabutylammonium 4-aminobenzenesulphonate 2/3hydrate [Citation12], piperazine1-4-diium bis(4-aminobenzenesulphonate) [Citation13], sulphanilic acid doped L proline and L-lysicine [Citation14], sodium sulphanilate dehydrate (SSDH) [Citation15,Citation16], lithium sulphanilate hydrates (LS) [Citation17], potassium carbonate sulphanilic acid [Citation18], lithium sulphate, zinc sulphate, cadmium sulphate [Citation19] [Bi6O6(OH)](NH2C6H4SO3)4 [Citation20], sulphanilic acid monohydrate [Citation21], N,N-thiocarbonyl bis(4-aminobenzene sulphonamide) with barium chloride [Citation22], and shiff-based sulphanilic acid-based crystals, sulphanillic acid single crystal, bis(4-aminobenzenesulphonato-kappa N)bis(2,2′-biimidazole-kappa N-2,N′)copper(II)-dihydrate [Citation23–30] have been studied and reported. Organic-based materials showed excellent mechanical and thermal responses compared with inorganic-based materials because of π-electron delocalization [Citation31,Citation32]. Similarly, pure sulphanilic acid has shown centrosymmetric properties, but when embedded with metals/metal ion it becomes a non-centro symmetric material, demonstrating nonlinear optical activity.
Intermolecular communications are responsible for crystal packing and gaining knowledge in this enables us to design new crystals with specific physical and chemical properties [Citation33,Citation34]. Intermolecular interactions, such as hydrogen bonding (π – π interaction), ion pairing, supramolcecular interaction, acid base adducts, donor and acceptor interactions, are famous for making aggregates of molecules [Citation35]. Hydrogen bonding interactions are very important to the organic and inorganic species because they aggregate and control self-assembly, in most of the cases sulphanilic acid-based compounds have hydrogen bonds. Sulphanilic acid (SAA) compound is widely used in the field of radiation therapy, biological, biomedical, supercapacitor and drug delivery application [Citation14–16]. It is also used as a monomer for the preparation of various copolymers and shows a conductivity, bio-imaging, humidity sensor application [Citation15,Citation36,Citation37]. The sulfanilate anion can act as a hydrogen bond donor and acceptor due to its aminogroup and protonated sulphonate moiety [Citation21]. Similarly, sulfanilate anions can easily co-ordinate with transition metals through both the amine and the sulphonate groups [Citation22].
In the present investigations of proton transfer, single crystals of (((4-aminophenyl)sulphonyl)oxy)zinc(II) chloride(4-ASZC) were grown by the slow evaporation solution technique. The grown crystal is characterized by single crystal X-ray diffraction, powder X-ray diffraction, Fourier transform infra red Spectroscopy (FT-IR), UV-Visible, Photoluminescence (PL), Nuclear magnetic resonance (NMR), thermal properties (TGA-DTA), dielectrical properties, nonlinear optical properties (NLO), Mechanical properties, Field effect scanning emission microscopy (FESEM) and Energy Dispersive Atomic X-ray Spectrometer (EDAX). All the obtained results are reported and discussed.
2. Experimental methods
2.1. Material synthesis and characterization
The compound sulpanilic acid (SAA) (98%) and zinc chloride (99%) were purchased from Sigma-Aldrich and Merck Chemicals Company, respectively. These chemicals were used without purification and the grown crystals were subjected to single crystal X-ray diffraction studies using an ENRAF NONIUS CAD4 diffractometer with MoKα radiation (λ = 0.71073 A°) to determine the unit cell dimensions and crystal system. The powder samples were analysed by using BRUCKER, Germany (model D8 Advance) X-ray diffractometer with cuk alpha (wavelength = 1.5405 ) radiation. It was scanned over the range 10–80° at a scan rate of 1°/min. Infrared spectra were recorded using Alpha Bruker ATR-FT-IR with a resolution of 2 cm−1 and the measurements were carried out at room temperature. 1H & 13C NMR spectra of the crystals were run on a Bruker FT-NMR spectrophotometer operating at 400 MHz at room temperature using dimethylmethoxide (DMSO) as a solvent and tetramethylsilane (TMS) as an internal reference. The optical transmission spectrum was recorded using DOUBLE BEAM UV-Vis Spectrophotometer in the region 200–1200 nm. The excitation and emission spectra of crystal were recorded using the Cary Eclipse spectrophotometer. The thermal stability of the crystals was estimated using a thermogravimetric analysis (TGA), with the Dupont 951 thermogravimertic analyzer. The sample weight was 8–10 mg. The work was performed from 30 to 800°C at the heating rate of 20°C min−1 in a nitrogen atmosphere with a gas flow rate of 100 ml min−1. The Vicker’s hardness test was carried out on the grown crystal using SHIMADZU HMV microhardness tester fitted with a diamond pyramidal indenter. The dielectric constant and the dielectric loss of grown 4-ASZC crystal were estimated using HIOKI 3532-50 LCR HITESTER. The elemental analysis was done using the Oxford INCA EDAX.
2.2. Solubility
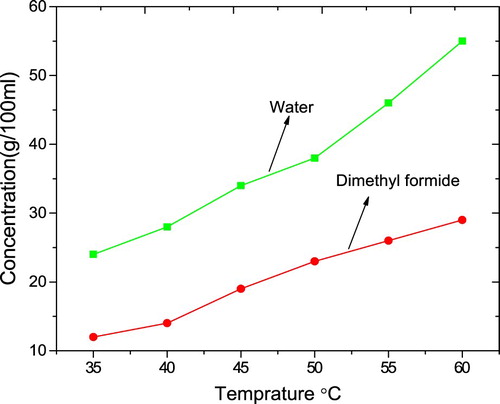
The solubility studies were carried out using water (polar solvent) and dimethyl formide (non-polar solvent) in the ranges from 35°C to 60°C. The solubility increases gradually with the increase of temperature, as indicated by the graph Figure . From the graph, it is understood that 4-ASZC possesses a positive temperature coefficient. It is concluded that the magnitude of water solubility is slightly higher compared with that of dimethyl formide due to N–O–H bond break in high temperature and the formation of ionic bond [Citation36,Citation37].
Figure 1. Solubility curve of 4-ASZC crystal.
2.3. Growth of 4-ASZC crystal based on zinc metal with SAA
Zinc metal-based novel crystals were synthesized using the slow evaporation solution technique at a room temperature and the short procedure is presented in Table . The estimated amounts of sulphanilic acid, zinc chloride and de-ionized water were taken in a 400 ml round bottom flask and stirred by a constant magnetic stirrer to ensure homogenous mixing of solutions. The stirred reaction mixture is heated up to 40°C for 2 h, after which the temperature is slowly reduced to room temperature. Subsequently, the reaction mixture was stirred for 10 h at room temperature. The saturated solution was filtered four times with 4-micron pore size filter paper. The prepared clear solution was poured in to a beaker and covered. The high degree of purification of synthesized crystal was achieved by the successive re-crystallization process with aluminium foil sheet and housed for slow evaporation of the solvent. After 65 days, the solvent was evaporated and good quality transparent crystals are obtained. The bulk crystal has formed with a dimension 8 × 6 × 1.5 mm. Figure shows the as-grown crystal of 4-ASZC scheme and Figure is shown as a photograph of the grown crystal. The crystal parameters are listed in Table .
Figure 2. Scheme of grown 4-ASZC crystal.
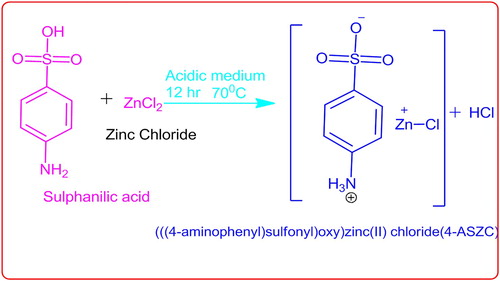
Figure 3. Photograph of grown 4-ASZC crystal.

Table 1. Growth of 4-ASZC crystal.
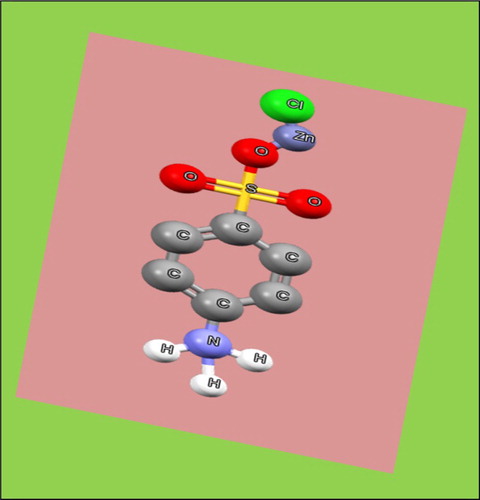
The grown 4-ASZC crystal consists of nitrogen (N), hydrogen (H) and oxygen (O) which make a new hydrogen bond like N–H–O [Citation34,Citation36]. Similarly, zinc metal ion (Zn2+) formed a new coordinate bond with oxygen (O) like a bidentate ligand (Zn2+–O–S) [Citation37]. The formation of the chain and the bonding process was possible because of the embedded zinc metal ion to the zwitter ionic compound of SAA. The ORTEP structure of 4-ASZC crystals is shown in Figure .
Figure 4. ORTEP structure of 4-ASZC crystal.
3. Results and discussion
3.1. Single crystal analysis
The unit cell parameter of the grown 4-ASZC single crystal is given in Table along with the previously reported data. It shows 4-ASZC is in a monoclinic form with non-centro symmetric space group P21.
Table 2. Unit cell parameters’ pure sulphanilic acid and embedded 4-ASZC grown crystal.
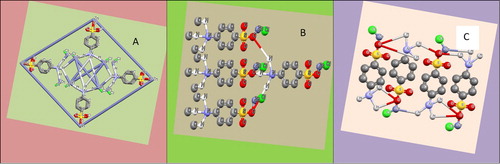
From the stereo dimensional frame work of the structural analysis, it is found that there are two strong interactions of hydrogen bonds N–H–O and H–O–H with an average length equal to 0.89 A° and 0.82 A°, respectively [Citation38,Citation39]. The proton transfer sulphonate anions interact with the opposite charged sulphanilic acid of anilinium cations to form the stacking structure along the crystallography forms shown in Figure (a,b) and structure 5(c). The crystal structure is established by the intramolecular hydrogen bond to form a three-dimensional network. The whole system of crystal is neutral due to the crystal system in zwitter ionic nature [Citation36]. Hence it is concluded that the formation of N–H–O type of hydrogen bond interaction is the most possible one.
Figure 5. The stacking structure of 4-ASZC crystal.
3.2. Powder X-ray diffraction analysis
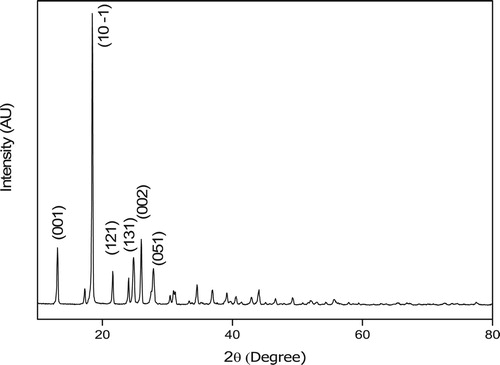
In the present examination, powder XRD analysis of the sample was carried out by subjecting the fine powder of 4-ASZC crystals to intense X-rays of λ = 1.5418 at a scan speed of 5° per minutes in steps, over a 2θ range of 10°–80° and is shown in Figure . The sample is pure crystalline in nature which is established from the sharp peaks at the diffraction 2θ angles 13°(001), 18°(10-1), 21°(121), 24°(131), 26°(002) and 27°(051).
Figure 6. Powder XRD pattern of grown 4-ASZC crystals.
3.3. Optical transmission studies
The optical property material is widely used for studying the atomic structure, dielectric properties, electrical properties, energy band structure, impurity levels, localized defects, lattice vibrations, metal predictions and certain magnetic excitations [Citation40]. The recorded optical spectrum is shown in Figure (a) for transmission spectra and Figure (b) for absorption spectra. From the spectrum, the cut-off wave length of the sample isat 251 nm.
Figure 7. (a) UV-visible NIR Transmission spectrum (b) UV-visible absorption spectrum.
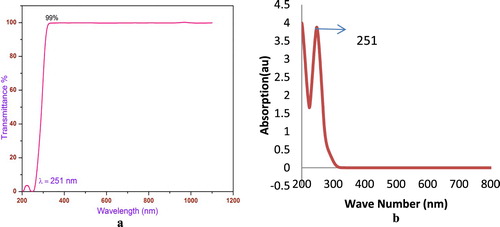
The sharp, high-intensity peak confirms the formation of a new band between oxygen of sulphanilc acid and zinc chloride through zinc metal oxide O–Zn2+ [Citation41–43]. Very low cut-off wavelength is a superior property for processing NLO activity and device application [Citation43].
3.3.1. Determination of band gap and optical constant for 4-ASZC crystal
This data obtained from UV-Visible spectrometer are widely used to determine the band structure and the type of electron transition of grown crystal [Citation40]. The optical absorption coefficient (α) was calculated from the measured transmittance (T) spectrum using the following equation.
(1)
(1) Here, T is the transmittance and t is the thickness of the crystal. As an optical band gap energy material, the crystal fulfils the following relation for high photon energies (hν).
(2)
(2) where Eg is the optical band gap energy A is a constant. h is the plank’s constant and v is the friquencey of the incident photon. The Tauc’s plot for the variation of (α. hν)2 versus photo energy (hν) is shown in Figure . Optical band gap energy was estimated by the extrapolation of the linear part and it is Eg = 4.40 eV. The wide band gap and large transmittance in the UV-Vis region clearly indicate the nature of the dielectric materials [Citation23]. Previously reported UV cut-off wavelength and band gap energy of sulphanilic acid based crystals are compared in Table . In the table, the band gap energy and cut-off wavelength of grown crystal is slightly varied from the reported work.
Figure 8. Tauc’s plot of 4-ASZC crystal.
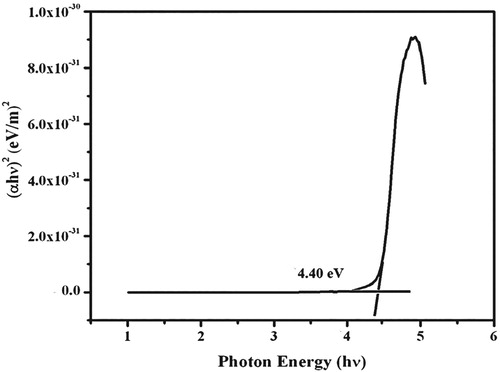
Table 3. Comparisons of UV cut-off wave length and band gap for sulphanilic acid-based crystal.
The optical parameters are determined using the following theoretical formula [Citation41]. The extinction coefficient (K) is given by
(3)
(3)
The reflectance (R) in terms of absorption coefficient (α) and the refractive index (n) in terms of reflectance (R) can be calculated from the following equations [Citation40,Citation41].
(4)
(4) The refractive index ‘n’ is obtained by using the reflectance data (R) given as
(5)
(5) From Equations (4) and (5), the refractive index (n) can also be derived as
(6)
(6)
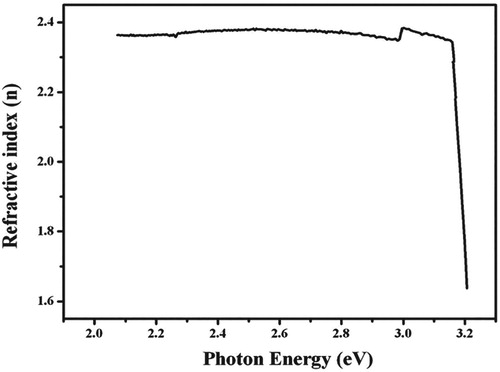
From the absorption spectra, the linear optical constants for example extinction coefficient, reflectance and refractive index of 4-ASZC crystal were calculated. The variation of reflectance, extinction coefficient and refractive index as a function of photon energy are plotted in Figures , respectively. The diagram of the extinction coefficient and reflectance show the dependency on the photon energies. The refractive index is 1.66.
Figure 9. The plot of reflectance (R) versus photon energy.
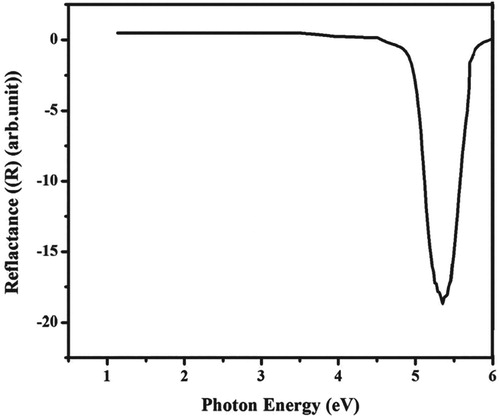
Figure 10. The plot of extinction coefficient (K) versus photon energy.
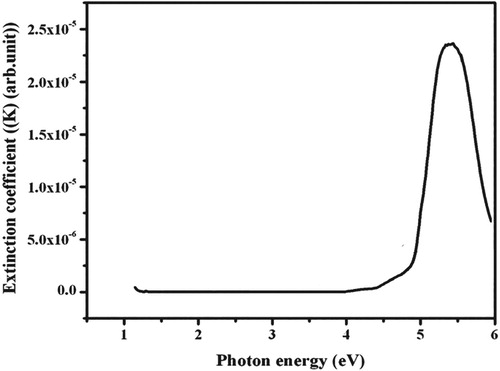
Figure 11. The plot of refractive index (n) versus photon energy.
3.4. FT-IR spectral studies
The FT-IR analysis of zinc chloride embedded with SAA crystal was carried out between 4000 and 400 cm−1. The spectrum of vibrational data is shown in Figure and important functional groups are presented in Table . The peaks at 3697 and 3455 cm−1 are signature for N–H vibration that indicates all the NH2 converted into N–H in the lattices. The peaks observed at 2904 and 1096 cm−1 are assigned to C–H of phenyl ring and S=O stretching vibration, respectively. The presence of intramolecular hydrogen bond between sulphanilic acid and amine group is observed in the range of 2228to 2652 cm−1. The asymmetric bending vibration of anilinium ion (–NH3+) occurs at 1598 cm−1. The asymmetric vibration of SO3− gives the peaks at the range of 1314 and 1367 cm−1. The C–N stretching vibration occurs at 1210 cm−1. The peak at 556 cm−1 is due to torsional oscillation of NH3+. The symmetric structure of C=S stretching vibrations at 817 cm−1 is shifted to low-frequency region at 678 cm−1. This study confirmed the presence of Zn2+ metal in the grown crystal [Citation42–46].
Figure 12. The vibrational spectrum of 4-ASZC crystal.
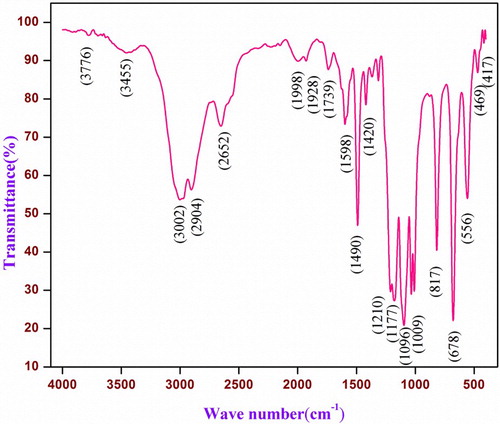
Table 4. The functional group and vibrational assignment peak of 4-ASZC.
3.5. Proton and carbon NMR spectra
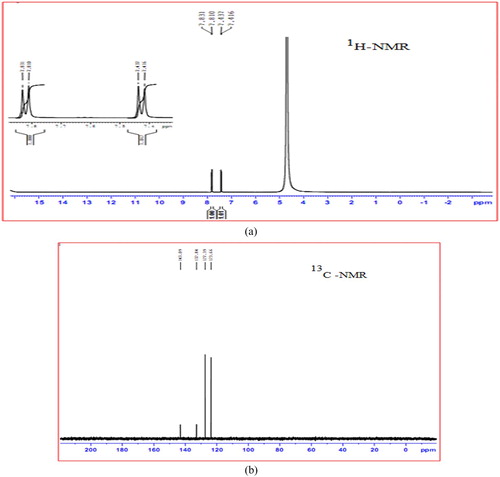
1H NMR spectra of 4-ASZC crystal were taken to investigate the environment of different protons, as shown in Figure (a). The sharp singlet intense peaks obtained at 4.45 ppm are due to the presence of hydrogen atom of NH3+ ion. The two separate doublet peak appeared at 7.0–7.8 ppm in the ortho, meta aromatic protons. The 13C NMR spectrum of 4-ASZC crystal is given in Figure (b). The important peaks appeared at 123–143 ppm correspond to aromatic carbons. A signal appeared at d = 143 allocated to the carbon atom of C2 and C6 and the medium intensity peak shown at 132 ppm is attributed to C3 and C5 carbon atom of the sulphanilic moiety. The 4-ASZC crystal moiety appears as a resonance signal at the 143 ppm character of C1 and C4 carbon bearing (SO3 and NH2).
Figure 13. (a) 1H-NMR Spectrum of grown 4-ASZC crystal. (b) 13C NMR spectrum of grown 4-ASZC crystal.
In this present study, photoluminescence (PL) measurement is an important tool for determining the crystalline quality of a system and its extension fine structure [Citation42]. The PL spectral details of pure and doped crystal are shown in Table . Figure exhibits PL emission spectrum recorded in the range of 150–900 nm with an emission wavelength of 593nm. The emission peaks were seen at 517 and 593 nm, demonstrating the emission from green to red light. A higher intensity ratio specifies better purity and crystallinity of 4-ASZC. The broadening of emission band is due to lattice vibrations in the 4-ASZC crystal. The strong PL emission indicates its potential application in optoelectronic device and lighting technologies [Citation40,Citation47].
Figure 14. PL emission spectrum of 4-ASZC crystal.
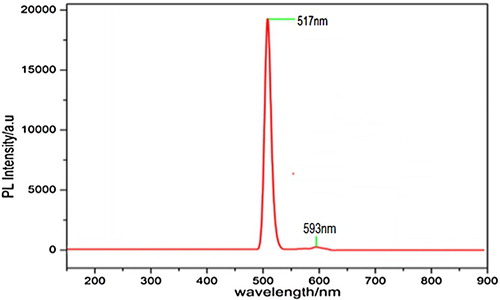
Table 5. The PL spectrum of pure and doped crystals.
3.6. SHG efficiency spectra
The measurement of the second harmonic generation (SHG) efficiency was found out by the powder technique and developed by Kurtz and Perry [Citation48–50]. For the SHG efficiency measurements, the output of a Q-switched Nd:YAG laser was used to generate about 2·8 mJ/pulse at 1064 nm fundamental radiation. A single shot mode of 8 ns laser pulse, rotation rate of 10 Hz with a spot radius of 1 mm was used. The input laser beam was allowed to pass through an IR reflector and then directed on the micro-crystalline powdered sample packed in a capillary tube of diameter 0·154 mm. The light emitted by the samples was measured by a photodiode detector and an oscilloscope. For the Nd:YAG laser, the fundamental beam of 1064 nm generates the second harmonic signal of 532 nm (green light).
The measurement of output pulse from 4-SAZC crystal is given in Table . Pure sulphanilic acid monohydrate crystal does not appear in the green signal due to the cetrosymmetric crystal, but metal embedded SAA crystals show good SHG efficiency because of non-centrosymmtric materials. The enrichment of SHG efficiency for 4-SAZC crystal is due to the optically active Zn2+ metal which modified the structure into non-centro symmetry. The SHG efficiency of the 4-SAZC sample is 0.5 times that of standard KDP crystal. Thus the grown crystal has good NLO property.
Table 6. SHG output signal of 4-ASZC crystal.
3.7. Thermal analysis of 4-ASZC crystal
A comparative study of the thermal stability of sulphanilic acid-based crystal [Citation14–23] reveals that the doping increases the melting point of the pure sulphanilic acid crystal. Hence the 4–ASZC crystal was subjected to TG/DTA analysis to examine the change in thermal stability. The obtained thermogram is shown in Figure .
Figure 15. TG-DTA curves of 4-ASZC crystal.
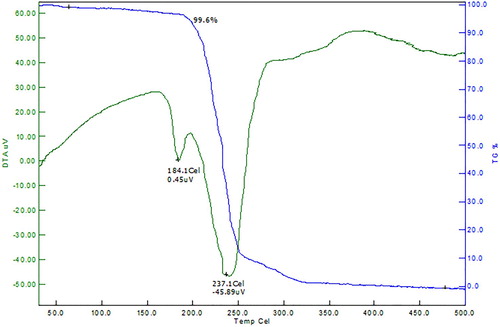
The grown crystal 4-ASZC shows two-stage decomposition; initially, the negligible amount of weight is lost (0.4%) at 184°C and completely decomposed (99.6%) at 237°C. So this indicates the grown crystal is thermally strong up to 180°C, the fraction of decomposition of the crystal at 184°C is due to the breakage of intramolecular hydrogen bonding between sulphanilic acid and amine group and the remaining grown crystal part is fully decomposed at exothermic peak 237°C. The grown crystal is 100% water-free crystal because there is no peak in the TGA graph at the boiling point of water. It is concluded that the crystal has a high melting point and exhibits high thermal stability by the addition of Zn2+ metal.
3.8. Mechanical study of 4-ASZC crystal
It is important to find the hardness of the crystal. The network of the crystal, purity and nature of the bonded influences its hardness. The Vickers microhardness tests are the globally accepted techniques for the measurement of structural and mechanical properties of the crystal. This method is a non-destructive one and will quickly yield quantitative information about the strength of materials. The experiment was carried out using SHIMADZU HMV microhardness tester fitted with the diamond pyramidal indenter [Citation51–56]. Figures and are the obtained Vickers microhardness graphs of the grown 4-ASZC crystal.
Figure 16. Hardness Hυ versus load (P) for 4-ASZC crystal.
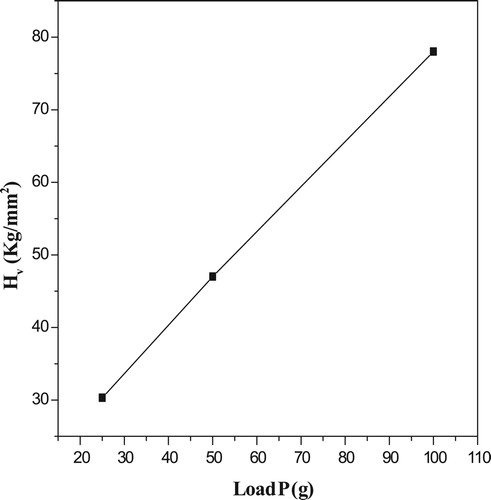
Figure 17. The plot of log p and log d for 4-ASZC crystal.
The indentation time was kept constant for 10s and the microhardness measurement was taken between the different applied load (P) ranging from 25 to 100 g. The average diagonal length was calculated. The Vicker’s hardness number was determined using the formula
(7)
(7)
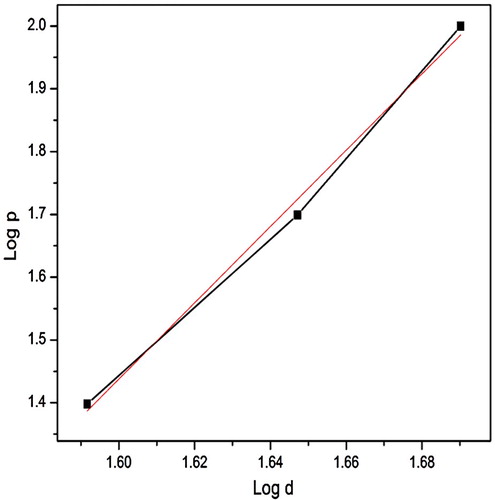
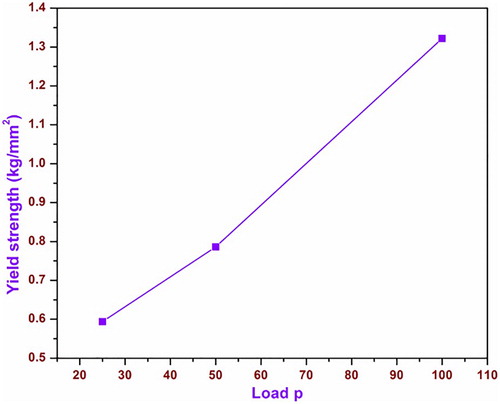
A graph was plotted between Hυ versus load (P) as shown in Figure . It is concluded that Hυ increases with the applied load, which is known as the reverse indentation size effect (RISE). For an indentation load of 100 g, a crack was noted on the crystal surface around the indent and it is due to the release of inside stress locally initiated by indentation. The work hardening coefficient (n) was computed (6.0) from the slope of a straight line between log p and log d from Figure . It indicates that the grown crystal belongs to the soft nature of material. The yield strength of the material can be elucidated by the relation [Citation56–58].
(8)
(8) where n′ = n + 2, σy is the yield strength of the material, Hv is the hardness number and n is the work hardening coefficient. The graph drawn for load P versus yield strength is shown in Figure .
Figure 18. The graph between load P and yield strength.
It is shown that yield strength increases with the expansion of load, and it is concluded that the grown crystal has moderate high mechanical strength. As indicated by Wooster’s, the stiffness constant (C11) for single crystal can be found by the relation
(9)
(9) A graph is plotted between load P and stiffness constant, as represented in Figure . Stiffness constant increases with load. The calculated stiffness constant C11, yield strength σy and Vickers’s hardness value for different loads are compiled in Table .
Figure 19. The graph between load P and stiffness constant.
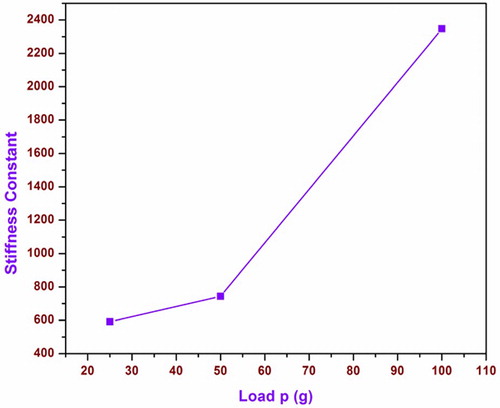
Table 7. The mechanical properties of 4-ASZC crystal.
3.9. Dielectric studies of 4-ASZC crystal
The dielectric constant with dielectric loss of the grown crystal 4-ASZC was calculated by the universally accepted equation [Citation59–63].
(10)
(10)
(11)
(11) here d is the thickness similarly A is the area of the sample.
Figures and display the variety of dielectric constant and dielectric loss, respectively, as a function of frequency at various temperatures. It is concluded from Figure that the dielectric constant decreases with the increase in frequency from 50 Hz to 5 MHz and then becoms almost constant. The comparative pattern is estimated for different temperatures. It is furthermore seen that the estimation of dielectric constant increments with temperature. Such variation at higher temperatures may be credited to the accumulation of charge carriers at the electrodes. The decreases of dielectric constant at low-frequency region may be because of space charge polarization. Figure exhibits that as the frequency increases, the dielectric loss decreases exponentially and then becomes constant. The low value of dielectric loss affirms that the sample possesses lesser imperfections.
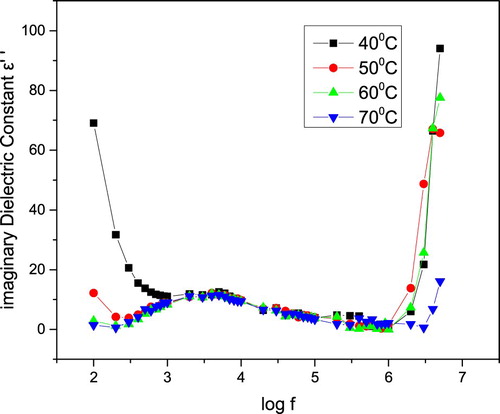
The variation of the imaginary part of dielectric constant with frequency is shown in Figure . The imaginary part of dielectric constant is found to be strongly temperature dependent because of low temperature and high frequency. Similarly, at high temperature and low frequency break-up the hydrogen bond in the crystal system exists.
Figure 20. Variation of dielectric constant with a frequency in 4-ASZC crystal.
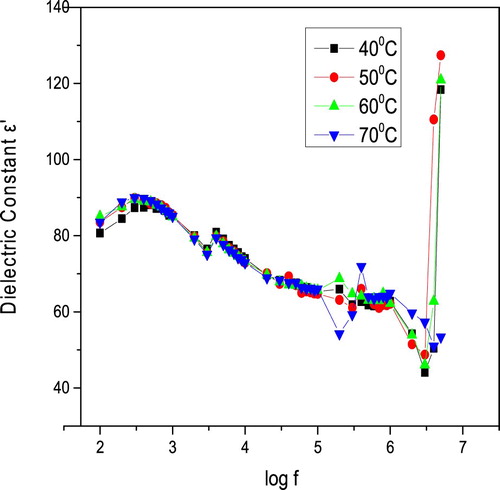
Figure 21. Variation of dielectric loss with a frequency in 4-ASZC crystal.
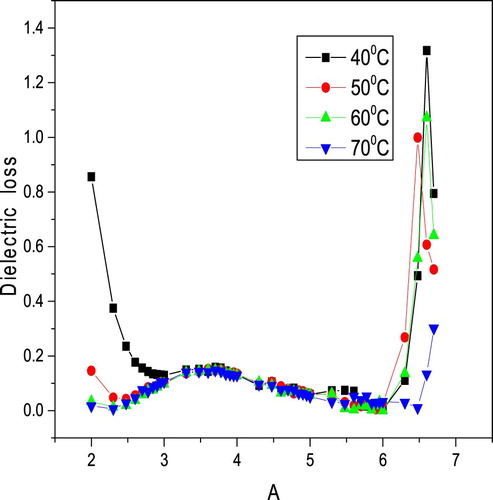
Figure 22. Variations between imaginary dielectric constant with a frequency in 4- ASZC crystal.
The alternating current (AC) conductivity σac is calculated using the equation [Citation48–50],
(8)
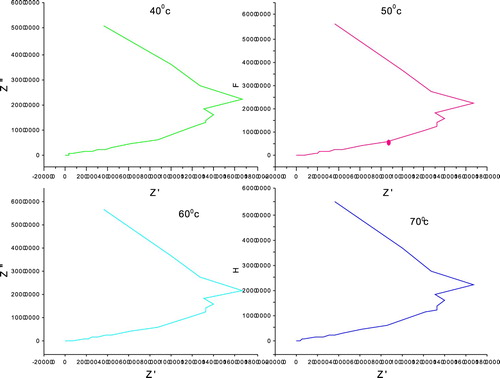
(8) where tan δ is the dielectric loss estimated directly from the impedance analyzer and F is the frequency of the applied AC field (Hz). The graph is plotted with AC conductivity (σac) verses log f and it is shown in Figure . It was observed that the crystal has very low conductivity in the low-frequency region up to 40 kHz for all temperatures. Thereafter, the AC conductivity was found to be increasing feebly up to 4 MHz. This indicates the dielectric breakdown frequency of this material. The value of the total electrical resistance is evaluated from the Cole–Cole plots shown in Figure , plotted between Z″ = Z cos Θ (real part of impedance) and Z″ = Z sin Θ (imaginary part of impedance). From these plots, the bulk resistance measured was found to be decreased with increasing temperatures, resulting in the enhancement of electrical conductivity at higher temperatures.
Figure 23. ac conductivity (δac) versus log f for 4-ASZC crystal.
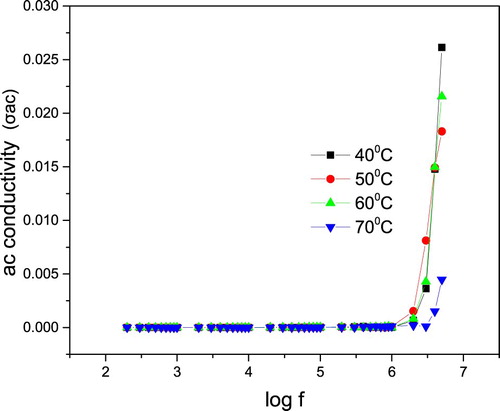
Figure 24. Cole–Cole plots of 4-ASZC crystal.
3.10. FESEM study of 4-ASZC
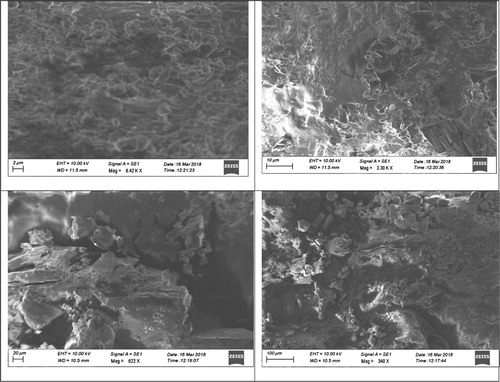
In order to analyse the nature and surface morphology, FESEM analysis was employed and the grown crystal was cut into few mm. The FESEM images of 4-ASZC crystal captured in four various magnifications are shown in Figure . The images show zinc metal ion incorporated in to 4-ASZC grown crystal, which suggests the existence of particle boundaries and the surface smoothness appears. This figure shows the presence of few cracks on the crystal surface.
Figure 25. FESEM images of zinc-embedded 4-ASZC crystal.
3.11. EDAX analysis of 4-ASZC crystal
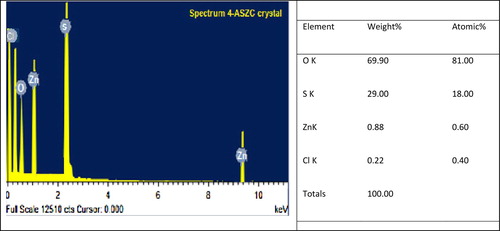
The basic investigation about the compounds present in a material is carried out by using the Oxford INCA Energy Dispersive Atomic X-ray Fluorescence Spectrometer (EDAX) [Citation50]. This technique is widely used in the quantitative analytical method and the EDAX spectra of 4-ASZC crystal are shown in Figure . Although the presence of zinc chloride embedded 4-ASZC crystals was confirmed using the EDAX analysis, it is difficult to be quantified due to the small amount of crystal zinc metal atoms and limitation of the analysis to measure chloride composition. However, the presence of zinc metal and chlorine atom is shown and it is confirmed with the 4-ASZC crystal lattice. The atomic percentage and weight percentage of elements present in the crystal lattices are shown in the corresponding table.
Figure 26. EDAX spectrum and data of 4-ASZC crystal.
4. Conclusion
The successfully grown 4-ASZC crystal is based on SAA with zinc chloride, a semi-organic single crystal was accomplished by the slow evaporation technique from an aqueous solution. A slight change in the lattices parameters and volume of the crystal was discovered in 4-ASZC crystal and it is monoclinic with space group Pc12. The UV cut-off wavelength 251 nm and this transparent nature in the entire visible region of UV-Vis-Nir spectrum reveal the grown crystal is the potential candidate for NLO applications. Optical band gap (Eg = 4.40 eV) reflectance (R), extinction coefficient (K) and refractive index (n) are of 4-ASZC crystal as found using UV-Vis-Nir spectrum data. The FT-IR spectrum uncovers the formation of anilinium ion and formation of hydrogen bond N–H–O in the 4-ASZC crystal. From the photoluminescence studies shown in green light emission and the optical property materials are confirmed. The chemical structure and molecular arrangement position of the grown crystal were established by 1H and 13C NMR spectrum, respectively. The SHG of the powdered 4-ASZC has crystal that is around 0.5 times that of unadulterated KDP. The thermal behaviour of the grown crystal is shown with a melting point at 184°C and stable up to 237°C. From the mechanical studies, stiffness constant (C11), yield strength (δy), hardness (Hv) and hardening coefficient (n) are calculated and the corresponding graphs are plotted. From this study, the grown crystal shows high conduction at higher temperature with low frequency. The surface morphology and the particle size of the crystal were determined through the FESEM technique. The elemental analysis was carried out by energy-dispersive X-ray dispersion and it confirms the presence of Zn metal.
Acknowledgements
The authors would like to thank Professor Dr R. Jayavel, Director, Centre for Nanotechnology, Anna University, Chennai, and IIT-Madras for his constant support to the analysis of single crystal XRD studies and B. S. Abdur Rahman University, Vandalur, Chennai for providing the instruments for characterization.
Disclosure statement
No potential conflict of interest was reported by the authors.
ORCID
E. Vinoth http://orcid.org/0000-0002-6342-9854
S. Vetrivel http://orcid.org/0000-0003-0307-039X
S. Gopinath http://orcid.org/0000-0003-3807-8340
J. Suresh http://orcid.org/0000-0003-0472-3030
Reference
- Zyss J, Berthier G. Nonlinear optical properties of organic crystals with hydrogen-bonded molecular units: The case of urea. J Chem Phys. 1982;77:3635. doi: 10.1063/1.444266
- Wang Y, Eaton DF. Optically non-linear organic molecules cyclodextrin inclusion complexes. Chem Phys Lett. 1985;120(1–5):441–444. doi: 10.1016/0009-2614(85)85637-2
- Debrus S, Ratajczak H, Venturini J, et al. Novel nonlinear optical crystals of noncentrosymmetric structure based on hydrogen bonds interactions between organic and inorganic molecules. Synth Met. 2002;127:99–104. doi: 10.1016/S0379-6779(01)00607-5
- Tabei H, Kurihara T, Kaino T. Recrystallization solvent effects on second-order nonlinear optical organic materials. App Phy Lett. 1987;50:1855–1857. doi: 10.1063/1.97716
- Jonie Varjula A, Vesta C, Justin Raj C, et al. Growth and characterization of a new semi-organic nonlinear optical sodium Paranitro phenolate paranitrophenol dihydrate single crystal. Mater Lett. 2007;61:5053–5055. doi: 10.1016/j.matlet.2007.04.012
- Rajesh NP, Kannan V, Ashok M, et al. A new nonlinear optical semi-organic material: cadmium thiourea acetate. J Cryst Growth. 2004;262:561–566. doi: 10.1016/j.jcrysgro.2003.10.064
- Xue D, Zhang S. Effect of hydrogen bonds on optical nonlinearities of inorganic crystals,chemical. Physics Letters. 1999;301(5–6):449–452.
- Yu D, Xue D, Ratajczak H. Bond-valence parameters for characterizing O– H2O hydrogen bonds in hydrated borates. J Mol Struct. 2006;792:280–285. doi: 10.1016/j.molstruc.2005.11.047
- Sivavishnu D, Srineevasan R, Johnson J, et al. Optical, band gap energy and mechanical properties of semiorganic nonlinear optical material: 2-aminopyridine potassium dihydrogen orthophosphate lithium chloride (2APKDPL) crystal. Materials Science for Energy Technologies. 2018;2589–2991:30080–6.
- Jayaprakash P, Peermohamed M, Krishnan P, et al. Growth, spectral, thermal, laser damage threshold, microhardness dielectric, linear and nonlinear optical properties of an organic single crystals: L-Phenylalanine DL –Mandelic acid. Physica B. 2016;503:25–31. doi: 10.1016/j.physb.2016.09.010
- Schreue J. Crystal structure of methylammonium sulfanilate, (CH3NH3)H2NC6H4SO3. Z KristallogrNCS. 1999;214:317–318.
- Cai Y, Sun N. Crystal structure of tetrabutylammonium 4-aminobenzenesulfonate 2/3 hydrate, C22H42N2O3S · 2/3 H2O. Z Kristallogr NCS. 2016;231(1):227–829.
- Sathish kumar K, Rangjith S, Sudhakar S, et al. Crystal structure of piperazine-1,4-diium bis(4-amino-benzene-sulfonate), acta crystal. MN. 2018;E71:01084–01085.
- Caroline M. L, Mani G, Kumaresan S, et al. Growth, spectral and thermal properties of sulphanilic acid single crystals in the presence of L-proline and L-lysine monohydrochloride dihydrate as dopants, optoelectronics and Advanced materials. Rapid – Communication. 2015;9–10:1239–1244.
- Mythili P, Kanagasekaran T, Khan SA, et al. Irradiation effects of sodium sulphanilate dihydrate single crystals. Nuclear Instru Phys Research B. 2008;266:1754–1758. doi: 10.1016/j.nimb.2008.01.071
- Mythili P, Kanagasekaran T, Sharma SN, et al. Growth and characterization of Sodium sulfanilate dihydrate (SSDH) crystals for NLO applications. J Cryst Growth. 2007;306:344–350. doi: 10.1016/j.jcrysgro.2007.05.025
- Anantharaja M, Gopalakrishnan R. Studies on lithium sulphanilate hydrate (LS) single crystal and its characterization. Int J Chem Tech Research. 2014;6:222–235.
- Prabhavathi N, Jayanthi L. Influence of K2CO3 on the growth and properties of sulphanilic acid crystal. Chemical Science Review and Letter. 2016;19:290–296.
- Anantharaja M, Parthasarathy M, Gopalakrishnan R. Comparative studies on growth and characterization of sodium sulphanilate dihydrate single crystals from conventional solution growth and unidirectional growth method of Sankaranarayanan-Ramasamy. Inter J Chem Tech Research. 2013;5:2636–2644.
- Zahariev A, Kaloyanov N, Girginov C, et al. Synthesis and thermal decomposition of [Bi6O6(OH)2](NH2C6H4SO3)4. Thermochim Acta. 2012;528:85–89. doi: 10.1016/j.tca.2011.11.003
- Senthil pandian M, Ramasamy P. Sodium sulfanilate dihydrate (SSDH) single crystals grown by conventional slow evaporation and Sankaranarayanan–ramasamy (SR) method and its comparative characterization analysis. Mater Chem Phys. 2012;132:1019–1028. doi: 10.1016/j.matchemphys.2011.12.057
- Vinoth E, Vetrivel S, Mullai U, et al. Growth, spectral and optical properties of N,N’ -thiocarbonyl bis(4-aminobenesulfonamide) with barium chloride: a semi-organic nonlinear optical crystal. J adv phy. 2018;7:1–8.
- Rathika Thaya Kumari C, Nageshwari M, Jayaprakash P, et al. Investigation on growth, optical, thermal, mechanical, dielectric, LDT studies of sulphanilic acid monohydrate: A promising third-order nonlinear optical material. J Nonlinear Optical Physics and Materials Containing. 2017;26:1750020–20. doi: 10.1142/S0218863517500205
- Banu A, Golzar Hossain GM. A new polymorph of sulfanilic acid monohydrate. Acta Cryst. 2006;62:02252–02253.
- Hempel A, Camerman N, Mastropaolo D, et al. A schiff base formed from sulfanilic acid and dimethylformamide. Acta Cryst. 1999;C55:697–698.
- Gharde RA, Chunarkar DT. Growth and characterization of sulphanillic acid single crystal from vapor. Inter J Sci and Tech Research. 2013;3:109–111.
- Liu B, Yan W, Dai Y-c, et al. Crystal structure of bis(4-aminobenzenesulfonato-kappa N)bis(2,2 ‘-biimidazole-kappa N-2,N ‘)copper(II)-dihydrate (1:2), [Cu(C6H6N4)(2)(C6H6O3NS)(2)]center dot 2H(2)O, C24H28CuN10O8S2. Z Kristallogr NCS. 2013;228:229–230.
- Conner BHO, Maslen EN. The crystal structure of α-sulphanilamide. Acta Cryst. 1965;18:363–366. doi: 10.1107/S0365110X65000828
- Rae AIM, Maslen EN. The crystal structure of sulphanilic acid monohydrate. Acta Cryst 1962;15:1285–1291. doi: 10.1107/S0365110X62003370
- Anbusrinivasan P, Pandian GV. Determination of nucleation temperature, meta stable zone width spectral analysis of sulphanilic acid grown from ethanol-water as growth medium. Ultra Chem. 2012;8:83–90.
- Henchiri R, Ennaceur N, Cordier M, et al. Synthesis, X-Ray crystal structure and highly nonlinear optical properties of inorganic-organic compound: 1,4-Diazbicyclo-octane oxonium trinitrates single crystal. J Phys Chem Solids. 2017;106:58–64. doi: 10.1016/j.jpcs.2017.02.011
- Nicoud JF, Twieg RJ. Nonlinear optical properties of organic molecules and crystals, Quantum Electronics. Principles and Applications. Vol. 1 (b), Academic 22 Press. Inc, 1987. pp. 227–296.
- Jin S, Yan P, Wang D, et al. Salt and co-crystal formation from 6-bromobenzo thiazol-2-amine and different carboxylic acid derivatives. J Mol Struct. 2012;1016:55–63. doi: 10.1016/j.molstruc.2012.02.036
- Zhen Y, Da Z, FuChen Y, et al. Hydrogen-bonding interactions between 1-butyl-2,3-dimethylimidazolium tetrafluoroborate and dimethyl sulphoxide. J Mol Struct. 2018;1164:70–76. doi: 10.1016/j.molstruc.2018.03.042
- Muthuraja P, Joselin Beaula T, Sethuram M, et al. Hydrogen bonding interactions on 1H-1,2,3-triazole based crystals: Featuring experimental and theoretical analysis. Curr Appl Phys. 2018;18:774–784. doi: 10.1016/j.cap.2018.03.005
- Arjunan V, Mariusz K, Marchewka K, et al. Synthesis, vibrational and quantum chemical investigations of hydrogen bonded complex betaine dihydrogen selenite. Spectrochemica Acta Part A: Mol Biomol Spectrosc. 2012;96:744–758. doi: 10.1016/j.saa.2012.07.054
- Murugesan A, Meenarathi B, Palanikumar S, et al. Synthesis characterization and applications of poly(sulphanilic acid) based tri-block copolymer. Adv Polym Technol. 2016;35:21522–21531. doi: 10.1002/adv.21522
- Vinoth E, Vetrivel S, Suresh T, et al. A new class semi-organic nonlinear optical materials: mono(4-sulfo benzene aminium) tri nickel(II) bis(dihydrogen phosphate) for photonic applications. Mater Sci Energy Technol. 2019;2:234–245.
- Vetrivel S, Suresh T, Gopinath S, et al. A New metal-organic nonlinear optical material: L-asparagine indium chloride (LAIn) for photonics application. Chin J Phys. 2018;56:2773–2781. doi: 10.1016/j.cjph.2018.10.007
- Liu JN, Wu BW, Zhang B, et al. Synthesis and characterization of metal complexes of Cu(II), Ni(II), Zn(II), Co(II), Mn(II) and Cd(II) with tetradentate Schiff bases. Turk J Chem. 2006;30:41–48.
- Kumari L, Li WZ. Synthesis, structure and optical properties of zinc oxide hexagonal microprisms. Cryst Res Technol. 2010;45:311–315. doi: 10.1002/crat.200900600
- Srinivasa Rao N, Rao MVB. Structural and optical investigation of ZnO Nanopowders synthesized from zinc chloride and zinc Nitrate. Am J Mater Sci. 2015;5(3):66–68.
- Balakrishnan T, Ramamurthi K. Growth, structural, optical, thermal and mechanical properties of glycine zinc chloride, single crystal. Mater Lett. 2008;62:65–68. doi: 10.1016/j.matlet.2007.04.072
- Barfeie H, Grivani G, Eigner V, et al. Copper(II), nickel(II), zinc(II) and vanadium(IV) Schiff base complexes: Synthesis, characterization, crystal structure determination, and thermal studies. Polyhedron. 2018;146:19–25. doi: 10.1016/j.poly.2018.02.012
- Kumar H, Rani R. Structural and optical characterization of ZnO Nanoparticles synthesized by Microemulsion Route. Int Lett Chem, Phys Astron. 2013;19:26–36.
- Sinha N, Bhandari S, Yadav H, et al. Performance of crystal violet doped triglycine sulfate single crystals for optical and communication applications. CrystEngComm. 2015;17:5757–5767. doi: 10.1039/C5CE00703H
- Caroline M. L, Sankar R, Indirani RM, et al. Growth, optical, thermal and dielectric studies of an amino acid organic nonlinear optical material: l-Alanine. Mater Chem Phys. 2009;114:490–494. doi: 10.1016/j.matchemphys.2008.09.070
- Ghazaryan VV, Fleck M, Petroson AM. Crystal Structures and Vibrational Spectra of Novel Compounds with Dimeric Glycine Glycinium Cations. J Mol.struct. 2010;977:117–129. doi: 10.1016/j.molstruc.2010.05.022
- Senthil S, Pari S, Sagayaraj P, et al. Studies on the electrical, linear and nonlinear optical properties of meta nitroaniline, an efficient NLO crystal. Physica B; 2009;404:1655–1660. doi: 10.1016/j.physb.2009.01.042
- Desai CC, Rai JL. Microhardness studies of SnI2 and SnI4 single crystals. BullMater sci 1983;5:453–457.
- Meyer E. Contribution of the knowledge of hardness and hardness testing. Z Ver Deut Ing 1908;52:645–835.
- Xiantao Jiang, Liangjing Zhang, Shunxiang Liu. 2018. Adv. Optical Mater. 16 (2018) 1800561-1800571.
- Onitsch EM. The present status of testing the hardness of materials. Mikroskopie. 1956;95:12–14.
- Durairaj N, Kalainathan S, Krishnaiah MV. Investigation on uniderctional growth of 1,3,5–Triphenylbenzene by sankaranarayanan-Ramasamy method and its characterization of lifetime, thermal analysis, hardness and etching studies. Mat Chem Phys. 2016;181:529–537. doi: 10.1016/j.matchemphys.2016.06.090
- Pan JS, Zhang XW. Structure and dielectric behavior of Pb (Mg1/3Nb2/3)O3 –Pb (Ni1/3Nb2/3) O3–Pb (Zn1/3Nb2/3) O3–PbTiO3 ferroelectric ceramics near the morphotropic phase boundary. Acta Mat. 2006;54(5):1343–1348. doi: 10.1016/j.actamat.2005.11.003
- Surekha R, Gunaseelan R, Sagayaraj P, et al. L-Phenylalanine L-Phenylalaninium bromide a new non linear optical materials RSC. Cryst Engg Comm. 2014;16:7979. doi: 10.1039/C4CE00718B
- Jiang X, Zhang L, Liu S, et al. Ultrathin metal-organic framework: an emerging broadband nonlinear optical material for ultrafast photonics. AdvOptical Mater. 2018;6:1800561–1800571.
- Hanumantharao R, Kalainathan S, Bhagavannarayana G, et al. An extensive investigation on nucleation, growth parameters, crystalline perfection, spectroscopy, thermal, optical, microhardness,dielectric and SHG studies on potential NLO crystal-ammonium hydrogen L-tartarte. Spectrochim Acta A: Mol Biomol Spectrosc. 2013;103:388–399. doi: 10.1016/j.saa.2012.10.044
- Srineevasan R, Rajasekaran R. Growth and optical studies of 2-aminopyridine bis thiourea zinc sulphate (2-APTZS) single crystals for NLO applications. J Mol Struct. 2013;1048:238–243. doi: 10.1016/j.molstruc.2013.05.052
- Krishnakumar V, Nagalakshmi R. Crystal growth and vibrational spectroscopic studies of the semiorganic non-linear optical crystal-bisthiourea zinc chloride. Spectrochim Acta, Part A. 2005;61:499–507. doi: 10.1016/j.saa.2004.04.014
- Kumar S, Sinha N, Yadav H, et al. Growth, structural, dielectric, ferroelectric and mechanical properties of L-Prolinium tartarate single crystal. J Mater Sci 2016;51:7614–7623. doi: 10.1007/s10853-016-0040-3
- Hierle R, Badamn R, Zyss J. Growth and characterization of a New material for nonlinear Optics: Methyl-3-nitro-4-pyridine-1-oxide (POM). Cryst Growth. 1984;69:545–554. doi: 10.1016/0022-0248(84)90366-X
- Vijayan R, Rameshbabu R, Gopalakrishnan R, et al. Growth and characterization of benzimidazole single crystals: a nonlinear optical material. Cryst Growth. 2004;262:490–498. doi: 10.1016/j.jcrysgro.2003.08.082