
Abstract
For the first time voltammetric methods have been applied and optimized for prifinium bromide (PRF) determination in pharmaceutical formulation. Cyclic voltammetry (CV) study has shown that PRF is an electroactive compound with quasi-revisable voltammograms. Optimization of voltammetric parameters indicated that platinum is the proper working electrode and (KNO3 1 M) is the proper supporting electrolyte. All applied voltammetric methods have shown high precession and accuracy. Square wave voltammetry (SWV) has shown the best limit of detection and limit of quantitation of 45.6 and 58.1 µg mL−1, respectively. Recoveries of SWV are 99.06% and 98.60% for 0.30 and 0.60 mg mL−1, respectively, using PRF tablet Riabal® 30 mg. CV with relative standard deviation values of 0. 135 and 0.322 of intra-day repeatability and inter-day reproducibility, respectively, has the best precision.
1. Introduction
Prifinium bromide (PRF) is a quaternary ammonium compound (Figure ), IUPAC name of this compound is 3-(diphenylmethylene)-1,1-diethyl-2-methylpyrrolidinium bromide. PRF is an anticholinergic and antimuscarinic agent that is used in the treatment of irritable bowel syndrome [Citation1] and irritable colon syndrome [Citation2]. The number of articles dealing with the determination of PRF is quite few, Sa’sa et al. used the reversed-phase High Performance Liquid Chromatography (RF-HPLC) method for the determination of PRF in six different pharmaceutical formulations [Citation3]. Lataifeh and Wedian developed the HPLC method for the quantitation of PRF combined with Paracetamol in the pharmaceutical dosage form, the limit of detection (LOD) for PRF with the HPLC method was 0.75 μg mL−1 and its limit of quantification was 2.30 μg mL−1 [Citation4]. Tokuma et al. developed the HPLC-UV method for PRF analysis in human serum and urine. Detection limit of PRF is 0.5 ng mL−1 of prifinium ion for serum samples and 5 ng mL−1 for urine [Citation5].
Abu-Nameh studied the spectroscopic method, for the determination of PRF in Pharmaceutical Preparations, which showed the dynamic range at concentrations of 0.149074–0.447222 mg mL−1 [Citation6]. Standard methods, used for pharmaceutical compounds assay in pharmaceutical companies, rely basically on chromatographic and spectroscopic methods. These methods have some disadvantages such as sample preparation and analysis time, high instrumental and running cost, method analysis waste disposed to the environment. Electrochemical determinations of pharmaceutical compounds become a comparable alternative to chromatographic and spectroscopic methods [Citation7,Citation8]. Potentiometric membrane ion selective electrodes have been applied for in vitro and in vivo assays of pharmaceutical products [Citation9,Citation10]. Voltammetric analysis methods are simple and rapid, in addition to high accuracy and precession [Citation7–11]. Furthermore, voltammetric methods required lower instrumental and operation cost. According to the chemicals used and disposed to the environment in the pharmaceutical compound analysis, voltammetric methods are considered greener methods than chromatographic and spectroscopic methods. In the present work voltammetric methods have been used and optimized for PRF quantitation in pharmaceutical formulation.
2. Results and discussion
2.1. Method development and optimization
2.1.1. Optimization of working electrode
Cyclic voltammetry (CV) has been used to study the electroactivity of PRF and optimize working electrode and supporting electrolytes. Figure voltammograms indicated that PRF is an electroactive compound involved in redox reaction. Platinum (Pt) and glassy carbon (GC) electrodes have been studied in this work, cyclic voltammograms in Figure (b,c) illustrated that Pt is a better working electrode than the GC electrode since Pt electrode has shown sharper anodic and cathodic peaks than the GC electrode with higher difference between the supporting electrolyte and PRF anodic and cathodic currents (Figure (b,c)).
Figure 1. Chemical structure of PRF.
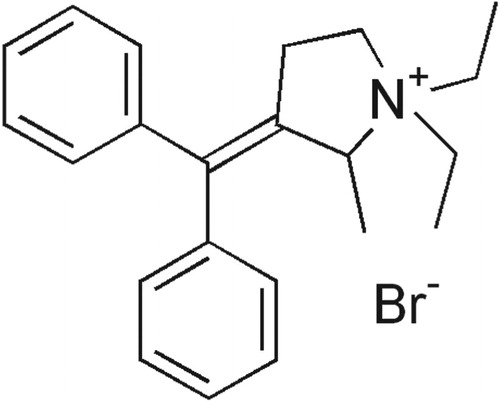
Figure 2. Comparison between cyclic voltammograms (a) Pt working electrode, Na2SO4 (1 M) supporting electrolyte (blue line), PRF 1 mg mL−1 in Na2SO4 (1 M) (red line). (b) GC working electrode, KNO3 (1 M) supporting electrolyte (blue line), PRF 1 mg mL−1 in KNO3 (1 M) (red line). (c) Pt working electrode, KNO3 (1 M) supporting electrolyte (blue line), PRF 1 mg mL−1 in KNO3 (1 M) (black line).
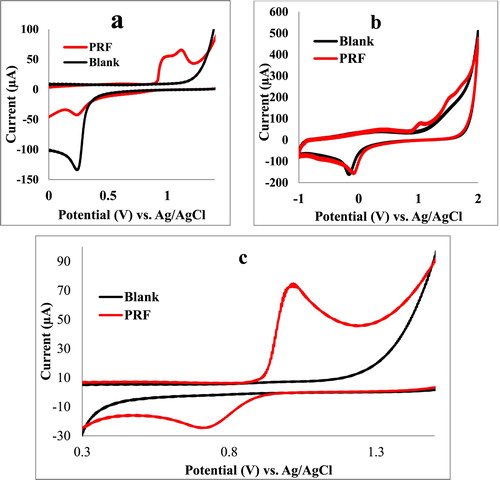
2.1.2. Optimization of supporting electrolytes
Two supporting electrolytes were studied in this work Na2SO4 (1 M) and KNO3 (1 M). Cyclic voltammograms in (Figure (a,c)) indicated that when KNO3 (1 M) is used as a supporting electrolyte it showed a higher anodic and cathodic current peak for PRF than when Na2SO4 (1 M) is used (Figure (a,c)). It can be concluded that PRF has shown quasi-reversible voltammograms when Pt is used as a working electrode and KNO3 (1 M) as a supporting electrolyte.
2.1.3. Optimization of voltammetric methods
Pt working as an electrode and KNO3 (1 M) as a supporting electrolyte have been used for voltammetric method optimization of the PRF analysis. Cyclic voltammograms of pure PRF pharmaceutical formulation samples (0.2–1.0 mg mL−1) (Figure ) have shown a quasi-reversible redox cycles with oxidation current peak at 1.02 V and reduction current peak at 0.71 V. Calibration curve slope indicated high sensitivity of the method with a good correlation R2 of 0.9827 (Table ). Both differential pulse and square wave voltammograms of Figures and have shown sharp current peaks at 0.98 V, but according to the calibration curve slope square wave voltammetry (SWV) has the highest sensitivity compared to other voltammetric methods (Table ). Furthermore, SWV has the best correlation coefficient R2 of 0.9909. In addition, SWV showed lowest LOD and limit of quantitation (LOQ) of 45.6 and 58.1 µg mL−1, respectively.
Figure 3. CV study of PRF (0.2–1.0 mg mL−1), Pt working electrode, KNO3 (1 M) supporting electrolyte, scan rate 0.1 V s−1, each concentration has been done triplicate.
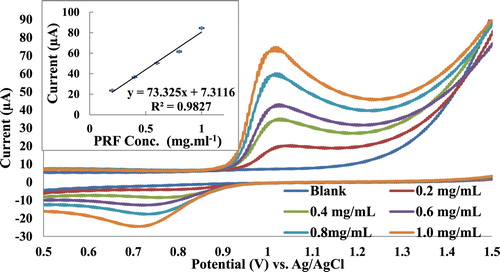
Figure 4. DPV study of PRF (0.2–1.0 mg mL−1), Pt working electrode, KNO3 (1 M) supporting electrolyte, each concentration has been done triplicate.
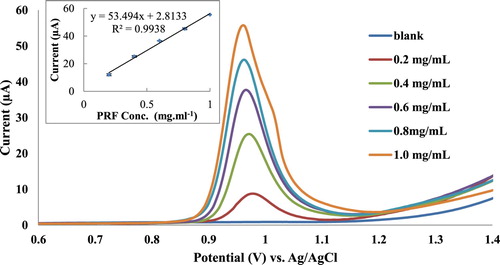
Figure 5. SWV study of PRF (0.2–1.0 mg mL−1), Pt working electrode, KNO3 (1 M) supporting electrolyte, each concentration has been done triplicate.
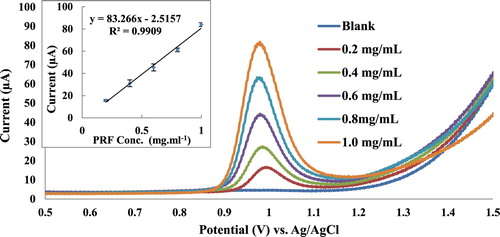
Table 1. Linearity of PRF (0.20–1.00 mg mL−1, KNO3 1 M).
2.2. Precision
Intra-day repeatability and inter-day reproducibility have been studied for PRF voltammetric analysis (Table ). Repeatability was tested by triplicate analyses of pure preparations of PRF (0.60 mg mL−1, KNO3 1 M) within the same day. Reproducibility was tested for PRF voltammetric analysis for three consecutive days. Table has shown that CV with relative standard deviation (RSD) values of 0. 135 and 0.322 of intra-day and inter-day, respectively, has the best precision method. Furthermore, both intra-day repeatability and inter-day reproducibility fall within the accepted range for all applied voltammetric methods.
Table 2. Precision of PRF (0.60 mg mL−1, KNO3 1 M).
2.3. Accuracy
The accuracy of voltammetric techniques was measured using 0.30 and 0.60 mg mL−1 prepared from PRF tablet Riabal® 30 mg. The voltammetric determination was carried out three times for each concentration level. Recovery in Table reflects the accuracy of the applied voltammetric methods. Recovery values in Table have indicated that SWV has the best accuracy. Furthermore, the accuracy of all applied methods falls within the desired range.
Table 3. Accuracy and precision of commercial preparation of PRF (Riabal® 30 mg) Pt electrode (KNO3 1 M).
3. Materials and methods
3.1. Materials and reagents
The standard pharmaceutical formulation of PRF was obtained from Hikma pharmaceuticals (Jordan). A commercial PRF Riabal® 30 mg tablet, manufactured by The Arab Pharmaceutical Manufacturing Company, Jordan, was bought from the Jordanian local market. Potassium nitrate (KNO3, ACS reagent, Fluka), Sodium sulphate anhydrous (Na2SO4 Janssen Chemica). Supporting electrolytes of 1.0 M KNO3 and 1.0 M Na2SO4 were prepared using Milli-Q water.
3.2. Standard solutions
Standard stock solutions of 1.0 mg mL−1 PRF were prepared by dissolving 100 mg of PRF standard pharmaceutical formulation powder in the 100 mL supporting electrolyte solution. Supporting electrolytes were used to prepare stock solutions and in the dilution of stock solutions to prepare the standard working solutions. Sample solutions using The Riabal® 30 mg tablets were weighed and grounded by a mortar and a pestle and a water bath sonicator was used to dissolve a certain mass of tablet powder in the supporting electrolyte solution. Next, undissolved substance was removed by applying a simple filtration method. Supporting electrolytes were used for washing the filter paper used in the filtration; then they were used to complete solution volume to the mark.
3.3. Apparatus
All voltammetric methods were carried out using the potentiostat (Metrohm Autolab) PGSTAT 204. Ag/AgCl (3 M KCl) was used as reference electrode. A GC or Pt was applied as a working electrode and a Pt sheet as a counter electrode.
4. Conclusion
Voltammetric analysis of PRF in pharmaceutical formulation has indicated that it is an electroactive compound. All the applied voltammetric methods have shown accuracy and precession within the accepted range. According to the study results SWV is the recommended method since it has shown the best sensitivity, recovery, LOD, LOQ and R2.
Disclosure statement
No potential conflict of interest was reported by the author.
ORCID
Abdulaziz N. Amro http://orcid.org/0000-0002-0490-9284
References
- Sasaki D, Suzuki A, Yoshida Y, et al. Treatment of irritable bowel syndrome with prifinium bromide. Clin Ther. 1985;7(2):190–198.
- Piai G, Mazzacca G. Prifinium bromide in the treatment of the irritable colon syndrome. Gastroenterology. 1979;77(3):500–502. doi: 10.1016/0016-5085(79)90012-X
- Sa’sa SI, Jalal IM, Khalil HS. Determination of prifinium bromide in six pharmaceutical formulations by reverse-phase HPLC. J Liq Chromatogr. 1988;11(2):447–462. doi: 10.1080/01483918809349951
- Lataifeh A, Wedian F. Development and validation of HPLC method for simultaneous quantification of prifinium bromide/paracetamol combination in pharmaceutical formulations. Jordan J Chem. 2014;9(3):217–227. doi: 10.12816/0026402
- Tokuma Y, Tamuraand Y, Noguchi H. High-performance liquid chromatographic determination of prifinium quaternary ammonium ion in human serum and urine. J Chromatogr B Biomed Sci Appl. 1982;231:129–136. doi: 10.1016/S0378-4347(00)80516-2
- Abu Nameh E. Simple and validated spectrophotometric method for determination of prifinium bromide in pharmaceutical preparations. Aust J Basic Appl Sci. 2013;7:746–750.
- Siddique MR, Alothman ZA, Rahman N. Analytical techniques in pharmaceutical analysis: a review. Arab J Chem. 2017;10:s1409–s1421. doi: 10.1016/j.arabjc.2013.04.016
- Gupta VK, Rajeev J, Keisham R, et al. Voltammetric techniques for the assay of pharmaceuticals – a review. Anal Biochem. 2011;408:179–196. doi: 10.1016/j.ab.2010.09.027
- Gupta V K, Nayak A, Agarwal S, et al. Bottom of form recent advances on potentiometric membrane sensors for pharmaceutical analysis. Comb Chem High Throughput Screen. 2011;14(4):284–302. doi: 10.2174/138620711795222437
- Yola M L, Gupta V K, Eren T, et al. A novel electro analytical nanosensor based on graphene oxide/silver nanoparticles for simultaneous determination of quercetin and morin. Electrochim Acta. 2014;120:204–211. doi: 10.1016/j.electacta.2013.12.086
- Fedder M, Amro A, Bin Oun S, et al. Voltammetric determination of glycopyrrolate in a pharmaceutical formulation. Turk J Chem. 2018;42:1736–1743. doi: 10.3906/kim-1801-37