
 ?Mathematical formulae have been encoded as MathML and are displayed in this HTML version using MathJax in order to improve their display. Uncheck the box to turn MathJax off. This feature requires Javascript. Click on a formula to zoom.
Abstract
Acetylated materials have been applied successfully in oily water remediation with some degree of success. Many of these materials which have been acetylated are, however, from seasonal fruits and other plant parts. This work reports the successful acetylation of silica extracted from diatomaceous earth by refluxing silica and acetic anhydride using 1% N-bromosuccinimide as a catalyst. The functionalization was confirmed by the presence of absorption bands at 1406 cm−1 (C–O) and 1568 cm−1 (C=O) on an IR spectrum and the presence of C, Si, and increased amount of O on the EDX spectrum. The synthesized materials were applied in the optimization of the removal of oil from synthetic oily wastewater using response surface methodology giving a percentage oil removal of 99.7%. The optimum conditions for oil removal were as follows; 7867 mg/L oil concentration, with adsorbent dosage of 0.001 g and a duration of 21.6 h, and the adsorption capacity under these conditions was found to be 1039 mg/g. The outcomes proved that acetylated silica is an excellent material for oil adsorption and can therefore be used in oil spill clean-ups.
1. Introduction
Many economies of the world are becoming increasingly dependent on oil. As a result, there is increased exploration, transportation and consumption of oil with an associated risk of oil spills at each stage. These spills lead to stress on the environment, causing death to marine organisms, leading to shortage of water and giving it a top spot on the environmental issues list [Citation1–3]. Research in recent years has been geared towards finding the best method to reverse the impacts of pollution arising from oil exploration and use especially in the area of oily water remediation. Methods which have been employed include mechanical methods such as skimming and in situ burning [Citation4], the use of oil dispersants [Citation5], bioremediation methods [Citation6] and the use of oil sorbents [Citation7].
However, the use of adsorbent materials is becoming increasingly popular because of the ease of use, affordability and effectiveness of these materials [Citation7–9]. Adsorbent materials can either be synthetic organic polymers, inorganic materials or organic natural polymers [Citation4]. Synthetic organic polymers like polyurethane usually have high adsorption potential but are non-biodegradable [Citation4]. Inorganic materials like organoclays are biodegradable but have low adsorption capacities [Citation10,Citation11]. Organic adsorbents, on the other hand, are relatively cheap, easily accessible and have been shown to have high adsorption capacities [Citation12,Citation7].
Silica, a major component of the ubiquitous diatomaceous earth [Citation13], can also be mined from ores and has been extracted from agricultural wastes like rice husk [Citation14–17], sugarcane bagasse [Citation18,Citation19], palm ash [Citation20] and corn cob [Citation21,Citation22]. It has found application in several areas such as solar energy systems and water filtration. Silica has proven to be an excellent adsorbent and has been applied in the treatment of water contaminated with gasoline and diesel [Citation23–28]. There have also been studies using silica functionalized with petroleum vacuum residues in the treatment of oily water and oily brines at different pH values [Citation29]. Two major drawbacks of these studies however were pH adjustments and the use of mechanical shakers to aid adsorption which are not achievable in actual oil spills. The search for a cost-effective and practicable adsorbent is still on with many researchers coming up with different materials.
In a bid to find the perfect adsorbent, this study looks at the modification of silica with acetyl groups, the optimization of oil removal from synthetic oily wastewater using the central composite design of the response surface methodology software without the application of mechanical shakers/ stirrers or pH adjustment so as to make it applicable in actual field treatments.
2. Materials and methods
2.1. Chemicals and reagents
Silica previously extracted from diatomaceous earth [Citation30] was used after drying to a constant weight. Acetic anhydride, acetone, ethanol and ethyl acetate were of analytical grade and obtained from Rochelle Chemicals (Johannesburg, South Africa). N-bromosuccinimide was also of analytical grade and obtained from Sigma–Aldrich (St Louis, USA). Sodium dodecyl sulphate was obtained from Sigma–Aldrich (St Louis, USA) and vacuum pump oil was obtained from Telstar technologies (Barcelona, Spain). Milli-Q water from Millipore S. A.S (Molsheim, France) (18.2 µS/cm at 25°C) was also used in all dilutions. Telstar Lyoquest-55 freeze dryer (Shangai, China) was used to freeze dry all samples, spectroquant UV spectrophotometer from Merk Group (Germiston, South Africa) was used for total organic carbon testing. Tea bags were obtained from retail outlets in Thohoyandou, South Africa and ALPHA FT-IR spectrophotometer from Bruker Pty (Sandton, South Africa) was used in functional group analysis.
2.2. Acetylation of silica
Acetylation was done by modifying the methods of Nwadiogbu et al. [Citation31] and Nwadiogbu et al. [Citation32]. To 1 mmol of the pre-prepared silica, 5 mmol of acetic anhydride was added. This mixture was refluxed over an oil bath at 100°C for 30 h using 1% N- bromosuccinimide as catalyst. After which, the resulting solution was decanted while still hot. The solute was then washed with 2 mL each of acetone, ethanol and water and freeze-dried.
2.3. Characterization
The resulting residue from acetylation was characterized using a Bruker Alpha IR spectrophotometer (Randburg, South Africa). Scanning electron microscope and energy dispersion X-ray spectroscope (EDX) FEI Nova NanoSEM 230 with field emission gun, (Eindhoven, Netherlands) was used to examine the morphology and elemental composition of the prepared adsorbent and silica before modification. An FEI T20 absorption electron microscope (TEM )with a CCD camera embedded (2048X2048) was used for further morphological evaluation.
2.4. Preparation of synthetic oily wastewater
Synthetic oily wastewater (SOWW) was prepared using the method described by Shoba et al. [Citation33]. Vacuum pump oil was mixed with sodium dodecyl sulphate (90:1, v/w) in 1 L of water, sonicated for 5 min at an amplitude of 75% and cycle of 0.5 to obtain a homogenous solution. This oily wastewater was used in the optimization experiments.
2.4.1. Response surface optimization of oil removal
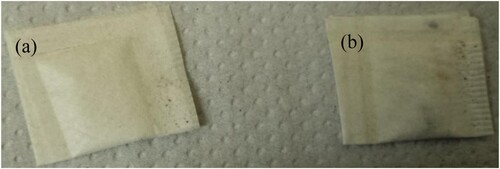
Optimization was done by placing variable amount of adsorbent (0.001–0.004 g) in a tea bag, whose tea leaves had previously been emptied out (Figure ). The bag was then sealed using a plastic sealer and placed in the SOWW (192–9250 mg/L), it was allowed to stand undisturbed for a pre-set time (16–60.5 h) which was also varied. After this, the solution was filtered and the total organic carbon was measured for the initial SOWW and adsorbent treated SOWW using a spectroquant UV spectrophotometer. The equilibrium adsorption was calculated from Equation (1) and percentage removal from Equation (2).
(1)
(1)
(2)
(2) where Ci and Cf are the oil concentrations (mg/L) before and after treatment with adsorbent respectively; V (L) is the volume of the solution, m (g) is the mass of the adsorbent and Qe is the equilibrium adsorption capacity per milligram dry weight of the adsorbent.
Figure 1. (a) sealed empty tea bag (b) sealed tea bag containing adsorbents.
2.5. Experimental design
Experiments for optimization of oil removal without shaking were done by varying the weight of the adsorbent, oil concentration and contact time using the central composite design in the response surface methodology (RSM) software. The range of optimized parameters are listed in Table .
Table 1. Range of optimized parameters.
3. Results and discussion
3.1. Characterization of synthesized adsorbent
Figure represents the infra-red spectra for silica and acetylated silica. The absorption band at 1406.18 cm−1 was due to C–O, the absorption band at 1568.37 cm−1 was due to C=O and the band at 1042 cm−1 was most likely due to Si–O. The absence of peak at 1715 cm−1 showed that there were no unreacted acetic anhydride and the absence of peaks around 1840–1760 cm−1 indicated that the acetylated products are free from acetic acid by-products. These results are in line with what was observed by Nwadiogbu et al. [Citation34] who illustrated that the presence of the carbonyl bands are key to successful acetylation when they reported the acetylation of corn cobs. El Boustani et al. [Citation35] also observed same peaks when they studied the effect of acetylation on the fibres of flax and wood pulp using sulphuric acid as catalyst. Onwuka et al. [Citation36] had similar findings as well during the acetylation of cocoa pods, pride of Barbados pods and empty oil palm fruit bunch.
Figure 2. FT-IR spectra of raw silica and acetylated silica.
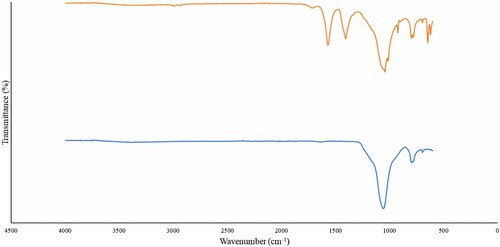
Figure is the XRD spectra of silica and the modified silica. The plots for both the raw silica and acetylated silica had identical diffraction patterns with no new peaks formed. As can be seen from the plots, sharp peaks present at 2θ = 26 indicated that the material was crystalline. It is also worthy of note, that acetylation did not change the crystalline nature of silica suggesting that acetylation occurred on the surface of silica. This is contrary to observations made by Nwadiogbu et al. [Citation32] who discovered that acetylation led to the conversion of crystalline phases into amorphous phases. This disparity can however be explained by the fact that their material was mainly cellulose and as they correctly opined, acetylation of cellulose materials leads to a decrease in crystallinity [Citation37]. Dong et al. [Citation38], however reported similar findings to those obtained in this study when they prepared acetylated cellulose nanocrystals using phosphoric acid as solvent.
Figure 3. XRD plots of raw and acetylated silica.
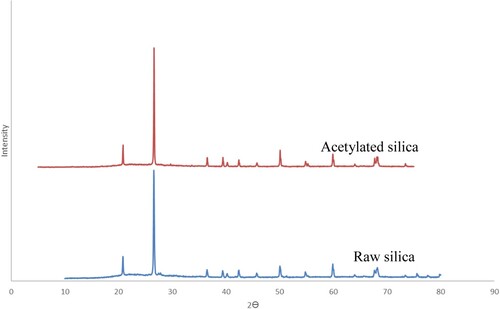
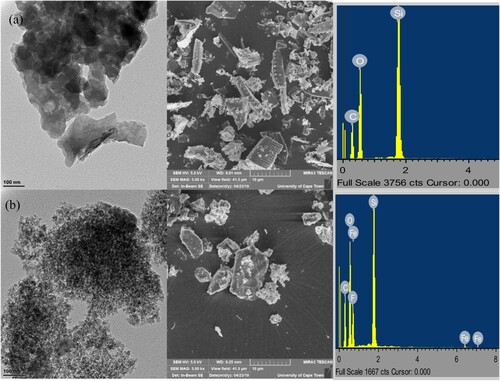
Figure (a) shows the TEM, SEM and EDX pictographs of the unmodified silica and the corresponding acetylated silica (Figure (b)). It was evident that the external pores visible on the surface SEM images of the former were no longer present on the surface of the acetylated silica but have been replaced with a bit of wrinkles and grooves most likely because of the conversion of hydroxyl groups on the surface of silica to more bulky acetyl groups leading to a closure of most of the external pores indicating successful functionalization [Citation39]. The EDX indicated that the unmodified silica had silicon, oxygen and carbon which most likely came from the coating material and the acetylated silica has increased intensity of oxygen and carbon as a result of the introduction of acetyl groups. TEM images shows that the acetylated silica particles were aggregated. This same trend has been observed by other researchers [Citation40,Citation41].
Figure 4. TEM, SEM and EDX micrographs of (a) raw silica (b) acetylated silica.
3.2. RSM experiments and model fitting
Quadratic model of the central composite design of the response surface methodology (RSM), a statistical software that allows for estimation of interactions including quadratic effects, was used for modelling experiments. Three reaction parameters were varied as indicated in Table : namely, initial oil concentration (mg/L), adsorbent dosage (g) and contact time (h). The actual percentage removal as calculated using Equation (2) are presented in Table which had 20 runs and pictorial representation of the optimization experiments presented Figure . It was seen that changes in the optimized parameters were reflected as changes in colour intensity of the SOWW in Figure .
Figure 5. Pictures of adsorbent treated synthetic oily wastewater (Experimental conditions are as presented in Table 2).
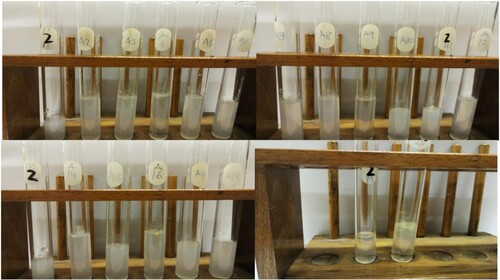
Table 2. RSM design and the actual values of responses.
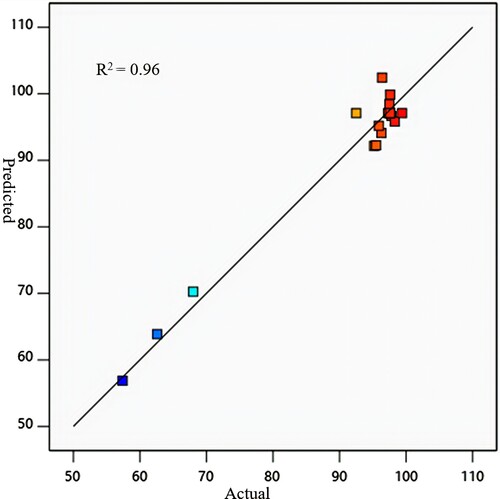
The model predictions for percentage removal of oil from SOWW was compared with the values obtained from experiments and plotted in Figure to obtain a straight line with most of the points close to the line. The coefficient of determination R2 was 0.99 indicating that predicted and actual values were in good agreement and that the quadratic polynomial model chosen was sufficient to represent the design space, and was able to explain the relationship between the responses and significant variables [Citation18,Citation42,Citation43].
3.3. Regression model and analysis of variance (ANOVA)
In order to investigate the significance of the model and the model terms, analysis of variance (ANOVA), an essential test used to determine the adequacy and significance of a model was carried out (Table ). ANOVA determines the significance or otherwise of a model by dividing the variation of the results into two sources, distinguishing model variations from experimental error. It is then able to determine and show if variation from the model is significant when compared to the variation due to residual error with the aid of the Fisher’s F-test value also known as F-value (ratio between the mean square of the model and the residual error) [Citation44,Citation45]. P-value is another tool used in ANOVA that helps determine if a model term is significant or not. The smaller the p-value, the more significant the factor is. Generally the smaller the p-value, the less likely the observed trends occurred by chance [Citation46].
It was discovered that the quadratic polynomial model used to represent percentage adsorption was significant (p-value .05 and high F-value). The lack of fit p-value was found to be greater than .05 indicating that the model fits and further confirmed that the model chosen was adequate to show how concentration, adsorbent dosage, and contact time affected the percentage removal of oil. Only initial oil concentration, adsorbent dosage and contact time and their interaction influenced the percentage oil removed Figure .
Table 3. ANOVA for model and model terms.
Figure 6. Comparison between values predicted by response surface methodology (RSM) model and experimentally determined values.
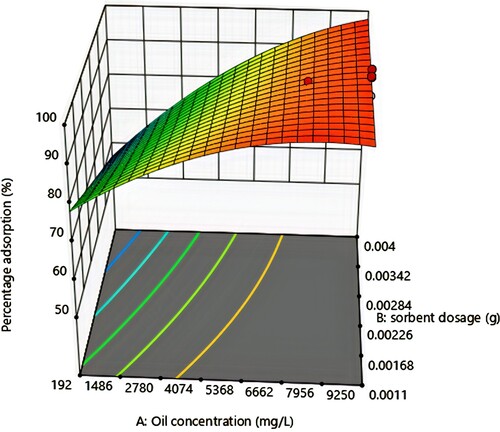
3.4. Effect of oil concentration and sorbent dosage
As seen from the response surface plot in Figure , percentage adsorption increased steadily up to 99%, which was the maximum with an increase in initial oil concentration and then decreased to 93% with a further increase in initial oil concentration. When initial oil concentration was increased, the oil droplets increased and passed into the pores of the adsorbent easily, hence the initial increase in percentage adsorption [Citation47,Citation48,Citation49]. A point was reached however, when the size of the oil droplets equalled the size of the adsorbent pores. At this point, there was maximum or effective adsorption but as the size of the oil droplets became greater than the size of the adsorbent pores, less oil was adsorbed and there was a subsequent decrease in percentage adsorption. Also, as adsorbent dosage was increased, percentage adsorption increased slightly. The reason for this observed trend was as a result of the introduction of new binding sites on the adsorbents [Citation50,Citation51].
Figure 7. Response surface plots for the effect of changes in oil concentration and adsorbent dosage on percentage adsorption.
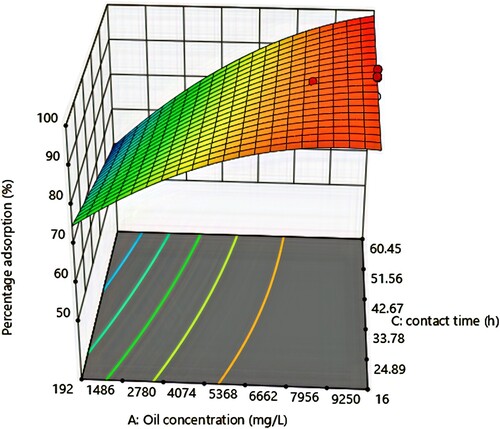
3.5. Effect of oil concentration and time
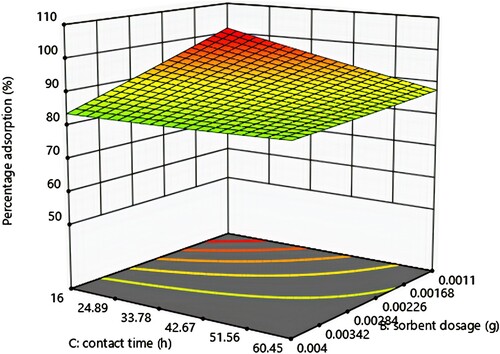
As can be seen from the response surface plots in Figure , percentage oil removal increased with time, this was because there was an increased chance of positive interaction between the adsorbent and oil as the adsorbent stayed longer in contact with the solution [Citation50]. The effect of oil concentration is as discussed in section 3.4.
Figure 8. Response surface plots for the effect of changes in initial oil concentration and contact time on percentage adsorption.
3.6. Effect of adsorbent dosage and time
The response surface plot for effect of adsorbent dose and time on percentage adsorption in Figure shows an increase in percentage adsorption with time. With adsorbent dosage, percentage adsorption increased, a maximum was reached, and it decreased. As the dosage was increased, more binding sites were made available and as time was increased, there was more time for the oil molecules to interact with the binding sites. Therefore, at higher dosages, more oil was adsorbed since there are more empty binding sites [Citation51].
Figure 9. Response surface plots for the effect of changes in contact time and adsorbent dosage on percentage adsorption.
6. Conclusion
Acetylated silica has been synthesized by use of acetic anhydride producing a material with a wrinkled, groove-like surface. Response surface optimization revealed that oil adsorption using this material depended largely on initial oil concentration, adsorbent dosage and contact time. The optimum conditions for the removal of oil from SOWW using acetylated silica were as follows: 7867 mg/L oil concentration, with adsorbent dosage of 0.001 g and a duration of 21.6 h with a desirability of 1.00. The percentage oil adsorption was found to be 99.3%, meaning that 99% of oil contained in an oily wastewater sample was adsorbed by the acetylated silica under these conditions and the adsorption capacity under these conditions was found to be 1039 mg/g. On-going studies also show that mechanical pressure applied on the adsorbent followed by oven drying at 60°C released the adsorbed oil giving the adsorbent a potential for reuse. Oil adsorption using acetylated silica was carried out without pH adjustments or stirring/shaking making the material applicable in the treatment of field wastewater.
Disclosure statement
No potential conflict of interest was reported by the author(s).
Additional information
Funding
References
- Asadpour R, Sapari NB, Hasnain Isac M, et al. Further study of adsorption of crude oils onto acetylated corn silk and its kinetics and equilibrium isotherm. Int J Eng. 2019;32:229–235.
- Asadpour R, Sapari NB, Isa MH, et al. Acetylation of oil palm empty fruit bunch fiber as an adsorbent for removal of crude oil. Environ Sci Pollut Res. 2016;23:11740–11750.
- Azzam R, Madkour T. Molecular design, synthesis and analysis of new hydrophobic seafoams with augmented uptake capacity. Int J Energy Environ. 2008;2:56–65.
- Adebajo MO, Frost RL, Kloprogge JT, et al. Porous materials for oil spill cleanup: a review of synthesis and absorbing properties. J Porous Mater. 2003;10:159–170.
- Angelova D, Uzunov I, Uzunova S, et al. Kinetics of oil and oil products adsorption by carbonized rice husks. Chem Eng J. 2011;172:306–311.
- Zahed MA, Aziz HA, Isa MH, et al. Optimal conditions for bioremediation of oily seawater. Bioresour Technol. 2010;101:9455–9460.
- Asadpour R, Sapari NB, Tuan ZZ, et al. Application of sorbent materials in oil spill management: a review. Caspian J Appl Sci Res. 2013;2:46–58.
- Liu J, Wang X. A new method to prepare oil adsorbent utilizing waste paper and its application for oil spill clean-ups. BioResources. 2019;14:3886–3898.
- Vocciante M, Finocchi A, D’Auris ADF, et al. Enhanced oil spill remediation by adsorption with interlinked multilayered graphene. Materials (Basel, Switzerland). 2019;12:2231.
- Asadpour R, Sapari NB, Isa MH, et al. Enhancing the hydrophobicity of mangrove bark by esterification for oil adsorption. Water Sci Technol. 2014;70:1220–1228.
- Carmody O, Frost R, Xi Y, et al. Adsorption of hydrocarbons on organo-clays – implications for oil spill remediation. J Colloid Interface Sci. 2007;305:17–24.
- Annunciado T, Sydenstricker T, Amico S. Experimental investigation of various vegetable fibers as sorbent materials for oil spills. Mar Pollut Bull. 2005;50:1340–1346.
- Bessho M, Fukunaka Y, Kusuda H, et al. High-grade silica refined from diatomaceous earth for solar-grade silicon production. Energy Fuels. 2009;23:4160–4165.
- Carmona VB, Oliveira RM, Silva WTL, et al. Nanosilica from rice husk: extraction and characterization. Ind Crops Prod. 2013;43:291–296.
- Fernandes IJ, Calheiro D, Sánchez FAL, et al. Characterization of silica produced from rice husk ash: comparison of purification and processing methods. Mater Res. 2017;20:512–518.
- Rafiee E, Shahebrahimi S, Feyzi M, et al. Optimization of synthesis and characterization of nanosilica produced from rice husk (a common waste material). Int Nano Lett. 2012;2:29–33.
- Todkar BS, Deorukhkar OA, Deshmukh SM. Extraction of silica from rice husk. Int J Eng Res Dev. 2016;12:69–74.
- Adebisi JA, Agunsoye JO, Bello SA, et al. Extraction of silica from sugarcane bagasse, cassava periderm and maize stalk: proximate analysis and physico-chemical properties of wastes. Waste Biomass Valor. 2019;10(3):617–629. doi:10.1007/s12649-017-0089-5.
- Harish PR, Arumugam A, Ponnusami V. Recovery of silica from various low cost precursors for the synthesis of silica gel. Pharm Lett. 2015;7:208–213.
- Pa FC, Chik A, Bari MF. Palm ash as an alternative source for silica production. MATEC Web Conf. 2016;78:01062.
- Ogunfowokan AO, Ezenwafor TC, Imoisili PE. (2011). Synthesis of nanoporous silica membrane from corn hob ash (Zea mays) by sol-gel method, Nigerian materials congress (NIMACON 2011), Akure, pp. 1–7.
- Okoronkwo EA, Imoisili PE, Olubayode SA, et al. Development of silica nanoparticle from corn cob ash. Adv Nanopart. 2016;05:135–139.
- Alkindy MB, Naddeo V, Banat F, et al. Synthesis of polyethersulfone (PES)/GO-SiO2 mixed matrix membranes for oily wastewater treatment. Water Sci Technol. 2020;81(7):1354–1364. doi:10.2166/wst.2019.347.
- Gilak S, Mosavian M, Rohani Bastami T. Functionalized magnetite/silica nanocomposite for oily wastewater treatment. Adv Environ Res. 2015;4:69–81.
- Ning RY. Reactive silica in natural waters – a review. Desalin Water Treat. 2010;21:79–86.
- Noamani S, Niroomand S, Rastgar M, et al. Carbon-based polymer nanocomposite membranes for oily wastewater treatment. npj Clean Water. 2019;2:20.
- Syed S, Alhazzaa M, Asif M. Treatment of oily water using hydrophobic nano-silica. Chem Eng J. 2011;167:99–103.
- Zhang L, Lin Y, Wu H, et al. An ultrathin in situ silicification layer developed by an electrostatic attraction force strategy for ultrahigh-performance oil–water emulsion separation. J Mater Chem A. 2019;7:24569–24582.
- Franco Ariza C, Martínez M, Benjumea P, et al. Water remediation based on oil adsorption using nanosilicates functionalized with a petroleum vacuum residue. Adsorpt Sci Technol. 2014;32:197–208.
- Izevbekhai OU, Gitari WM, Tavengwa NT. (2019). Optimization of silica extraction from diatomaceous earth using response surface methodology, 20th WaterNet/WARFSA/GWPSA Symposium, Indaba Hotel, Spa & Conference Centre Fourways, Johannesburg, South Africa, pp. 1–10.
- Nwadiogbu JO, Okoye PAC, Ajiwe VI, et al. Hydrophobic treatment of corn cob by acetylation: kinetics and thermodynamics studies. J Environ Chem Eng. 2014;2:1699–1704.
- Nwadiogbu JO, Ajiwe VIE, Okoye PAC. Removal of crude oil from aqueous medium by sorption on hydrophobic corncobs: equilibrium and kinetic studies. J Taibah Univ Sci. 2018;10:56–63.
- Shoba B, Jeyanthi J, Vairam S. Synthesis, characterization of cellulose acetate membrane and application for the treatment of oily wastewater. Environ Technol. 2020;41(12):1590–1605. doi:10.1080/09593330.2018.1543353.
- Nwadiogbu JO, Ajiwe VIE, Okoye PAC. Removal of crude oil from aqueous medium by sorption on hydrophobic corncobs: equilibrium and kinetic studies. J Taibah Univ Sci. 2016;10:56–63.
- El Boustani M, Brouillette F, Lebrun G, et al. Solvent-free acetylation of lignocellulosic fibers at room temperature: effect on fiber structure and surface properties. J Appl Polym Sci. 2015;132:1–8.
- Onwuka JC, Agbaji EB, Ajibola VO, et al. Thermodynamic pathway of lignocellulosic acetylation process. BMC Chem. 2019;13:79.
- Kosaka PM, Kawano Y, Salvadori MC, et al. Characterization of ultrathin films of cellulose esters. Cellulose. 2005;12:351–359.
- Dong F, Yan M, Jin C, et al. Characterization of type-II acetylated cellulose nanocrystals with various degree of substitution and its compatibility in PLA films. Polymers (Basel). 2017;9:346–360.
- Onwuka JC, Agbaji EB, Ajibola VO, et al. Treatment of crude oil-contaminated water with chemically modified natural fiber. Appl Water Sci. 2018;8:86–90.
- Onwuka JC, Agbaji EB, Ajibola VO, et al. Kinetic studies of surface modification of lignocellulosic Delonix regia pods as sorbent for crude oil spill in water. J Appl Res Technol. 2016;14:415–424.
- Wang J, Zheng Y, Wang A. Effect of kapok fiber treated with various solvents on oil absorbency. Ind Crops Prod. 2012;40:178–184.
- Olawale O, Akinmoladun AI, Oyawale FA, et al. Application of response surface methodology for optimisation of amorphous silica extracted from rice husk. Int J Sci Eng Res. 2012;3:2229–5518.
- Syuhada N, Mohd Ghazi R, Ismail N. Response surface methodology optimization of oil removal using banana peel as biosorbent. Malaysian J Anal Sci. 2017;21:1101–1110.
- Kasiri MB, Modirshahla N, Mansouri H. Decolorization of organic dye solution by ozonation; optimization with response surface methodology. Int J Ind Chem. 2013;4:3–10.
- Segurola J, Allen NS, Edge M, et al. Design of eutectic photoinitiator blends for UV/visible curable acrylated printing inks and coatings. Prog Org Coat. 1999;37:23–37.
- Sawyer S. Analysis of variance: the fundamental concepts. J Man Manip Ther. 2009;17:27E–38E.
- Carlos G, Juan C, Wang S, et al. (2001). Oil-water separation in liquid-liquid hydrocyclones (LLHC) – experiment and modeling, pp. 1–10.
- Ishak KEHK, Ayoub MA. Predicting the efficiency of the oil removal from surfactant and polymer produced water by using liquid–liquid hydrocyclone: comparison of prediction abilities between response surface methodology and adaptive neuro-fuzzy inference system. IEEE Access. 2019;7:179605–179619.
- Sahu O, Singh N. 13 – significance of bioadsorption process on textile industry wastewater. In: Shahid ul I, Butola BS, editors. The impact and prospects of green chemistry for textile technology. Cambridge, United Kingdom: Woodhead; 2019. p. 367–416.
- Hassan AA, Naeem HT, Hadi RT. A comparative study of chemical material additives on polyacrylamide to treatment of waste water in refineries. IOP Conf Ser: Mater Sci Eng. 2019;518:062003.
- Rahdar S, Taghavi M, Khaksefidi R, et al. Adsorption of arsenic (V) from aqueous solution using modified saxaul ash: isotherm and thermodynamic study. Appl Water Sci. 2019;9:87–95.