
 ?Mathematical formulae have been encoded as MathML and are displayed in this HTML version using MathJax in order to improve their display. Uncheck the box to turn MathJax off. This feature requires Javascript. Click on a formula to zoom.
Abstract
Electromagnetic wave is a viable means of introducing energy into reservoirs for the recovery of residual oil. However, previous studies have not considered the precise frequency of the electromagnetic (EM) wave. These studies focused on EM heating, not considering the efficiency dependence of EM transmitter and EM propagation on the EM properties of the medium. Thus, sandstone effective permittivity was experimentally measured, and electrical conductivity calculated for different saturation stages encountered in the nanofluid enhanced oil recovery process. The effective permittivity at the resonant frequency of the sandstone increased from 10.94 to 19.1 with a simultaneous frequency shift from 1.2 to 0.6 GHz due to the inclusion of magnetite nanofluid. This implies that the maximum transfer of EM energy for stimulation and activation of injected nanofluid can be achieved by irradiating the EM wave of this frequency within the reservoir for mobilization of the residual oil.
1. Introduction
Electromagnetic (EM) method of enhanced oil recovery (EOR) involves the induction of electrical current from antennas or the passage of electrical current between electrodes in the producing reservoir. These methods of introducing EM waves to the reservoir can either be achieved at the surface or depth [Citation1]. EM wave stimulation of residual oil relies on preferential absorption of EM energy by dipolar materials having free or bound charges like electrons or ions. Electromagnetic properties of materials are divided into three categories: conductive, capacitive, and inductive. Most reservoir rocks do not possess any measurable inductive properties and are described electrically by the conductive and capacitive properties [Citation2,Citation3]. The frequency-dependent conductive and capacitive properties can be denoted by complex conductivity (σ*) and complex permittivity (ε*), respectively [Citation4]. The complex permittivity is given as
(1)
(1) where the real part represents total electric energy storage, and the imaginary parts represent total electric energy loss [Citation5] resulting from the applied EM field. The relationship between the complex permittivity and conductivity is given as [Citation6].
(2)
(2)
The relative dielectric constant is a ratio of observed dielectric permittivity of a material to the permittivity of free space. Dielectric permittivity arises as a result of electric displacement which is the emergence of oppositely charged particles at the two ends of a discontinuous circuit. The variations of relative permittivity and conductivity with frequency can be explained in terms of the polarization with frequency [Citation7]. At lower frequencies, the oscillations of the electric field are easier to follow, indicating that the sample is better polarized, leading to higher relative permittivity. At a higher frequency range, the polarization is weakened because the changes in the electric field are too rapid for the charges to follow, thereby decreasing the relative permittivity [Citation8]. As the polarization weakens with increasing frequency, the charges become more active in moving along the electric field, and therefore the conductivity increases. Interfacial polarization might be dominant at higher frequencies, while other types of polarization which include electrical double layer polarization are present at lower frequencies. The electrical double layer polarization is caused by the electrochemical interactions of the rock mineral-water system, which gives rise to additional polarization that leads to an increase in the relative permittivity and a reduction in the conductivity [Citation9–11].
Reservoir rock usually exhibits intrinsic (at the molecular level) and structural (bulk state) anisotropy [Citation12]. Due to the heterogeneity of the reservoir, several dielectric models have been proposed to explain the permittivity of mixtures from the known dielectric constants and volume fractions of the constituents. In a lossy material, the dielectric constants of the constituents are complex numbers. This leads to complex effective permittivity, with the imaginary part representing absorption losses of the mixture. The earliest representation of relative permittivity of porous material with fluid as inclusion is given by the Clausius-Mossoti approximation [Citation13]. Other suitable multiphase mixing formula with n dielectrically different materials (e.g. brine, oil, nanoparticle, etc.) with permittivity ε1, ε2 … εn embedded in a background material (e.g. sandstone) of permittivity ε have also been proposed [Citation14].
Several studies have been carried out on nanoflooding experiments using different electromagnetic methods such as radio frequency (RF), microwave, and downhole heating methods for EOR [Citation15]. After the introduction of ferrofluid for surfactant EOR flooding by Kothari et al. [Citation16], several researchers have utilized magnetic nanoparticles for core flooding processes. It has been reported that the amplitude of the interfacial displacement of nanofluids increases with higher nanoparticle magnetization [Citation17]. Ferrofluids exhibit magnetorheological effects which could enhance multiphase fluid mobility required for improved recovery factors in EOR under the application of external EM field [Citation18]. Hence, magnetic nanofluid composed of brine and Fe3O4 nanoparticles is used in this study due to the remarkable magnetic properties of the Fe3O4 such as high saturation magnetization. EM wave has also been applied in EOR, with and without nanofluid injection, to improve recovery from residual phase [Citation19–21].
However, these studies have not considered the precise frequency and power level of the EM wave. Majority of these studies arbitrarily select frequencies to achieve their objective of EM heating, not taking into cognizance that EM transmitter efficiency and ensuing EM propagation are largely dependent on the EM properties of the propagating medium. This is essential as the transfer of EM energy to reservoir materials depends on their molecular composition and fluid content [Citation22,Citation23]. As the EM properties of porous media are affected by pore distribution [Citation20], this study first provides a preliminary analysis of the pore diameter distribution in the sampled sandstone (Berea). The permittivity variation of the reservoir rock is explored at different fluid saturations to evaluate changes in reservoir EM properties with a change in fluid composition. The impact of this variation in dielectric permittivity, loss tangent and conductivity on EM propagation and polarization within the reservoir are likewise presented.
2. Methodology
2.1. Materials
Anhydrous ferric chloride (FeCl3), ferrous chloride tetrahydrate (FeCl2.4H2O), citric acid monohydrate (C6H8O7.H2O) and Ammonium hydroxide (NH4OH, 30 wt% NH3 in water), were purchased from R & M chemicals. All chemicals used were analytical grade and used as received without further purification. Berea sandstone sample (USA) which is composed of 88.9 wt% quartz, 3.9 wt% clay, 3.4 wt% feldspar, 2.2 wt% carbonate, 0.5 wt% evaporites and 1.1 wt% other minerals [Citation24] was used in this experiment.
2.2. Experimental
A conventional co-precipitation method according to our previous study [Citation25] was used to synthesize Fe3O4 nanoparticles, with modification in the ratio of iron precursors. Firstly, 0.22 M Fe3+ and 0.11 M Fe2+ (molar ratio 1:2) were dissolved in 100 mL deionized water at room temperature. The mixture was then heated at 80°C under vigorous stirring for 15 minutes. Then, 10 mL of 30% NH4OH was added rapidly into the solution to raise the pH of the solution to a value of 9.5 and cause precipitation of Fe3O4. The solution was continuously stirred vigorously for another 30 min with the temperature maintained at 80oC to cause precipitation of Fe3O4. The precipitate washed several times with deionized water to remove impurities and finally dried in an oven at 70oC for 5 hours. The reaction formula is as follows.
(3)
(3)
(4)
(4) 11,000 ppm brine solution was prepared by dissolving 1.1 g of NaCl in 100 ml of distilled water and sonicating for 5 minutes. 0.05 g of Fe3O4 nanoparticles were dispersed in 100 ml of brine and sonicated for 1 hour for proper dispersion. For the dielectric measurements, three sandstone samples were saturated separately with: oil, oil and brine, and lastly brine, oil, and Fe3O4 nanofluid. Electrical conductivity of the formation fluid; oil, brine, Fe3O4 nanofluid and 60% brine + 40% oil were measured at 26°C using a portable electrical conductivity meter (EC meter CM-31P) as 10−5 mS/m, 2.05 S/m, 2.19 S/m and 3 × 10⁻⁴ mS/m respectively.
2.3. Petrophysical measurements
The porosity and permeability of the sample are 21% and 230 mD respectively. Mercury porosimetry and thin section analysis were conducted to analyze the pore size distribution of the sandstone sample. The Mercury porosimetry method makes use of the pressure-saturation data to produce pore size distribution based on the equation.
(5)
(5) where d is the pore diameter (μm), σ the Hg-air surface tension (48o mN/m), Pc the capillary pressure (kPa), and θ the Hg-air contact angle (140o). A 10 mm thick sample of the sandstone was cut and impregnated with blue dye (for pore discrimination), the sample was then glued to the surface of a rectangular glass slide using epoxy. The glued sample was dried under UV light for proper bonding. The sample was subsequently trimmed to an approximate size of 2 mm using a Buehler PetroThin thin sectioning system. The sample was finally cleaned and polished using Metkon polisher (Forcipol 300 1 V) to achieve a thin and even surface ready for microscope visualization.
2.4. Characterization
X-ray diffraction spectrometer (XRD, PANalytical, X’pert3 Powder) with Cu Kα radiation (λ = 0.15406 nm, 40 mA, and 45 kV) was used to characterize the phase compositions and crystallinity of the Fe3O4 nanoparticles. The broadening of diffraction peaks is known to be influenced by internal strains and crystallite size of the particles. The average crystallite size of the samples was calculated with the Debye-Scherrer equation , where λ represents the wavelength of the X-ray radiation, β is the line of broadening at half the maximum intensity (FWHM) and θ is the Bragg's angle. Fourier transform infrared spectroscopy (Perkin Elmer) was used to confirm the presence of the functional groups in the sample. The thin section image was observed with the aid of a Leica polarizing microscope (DM750P).
2.5. Electromagnetic properties measurements
The real and imaginary parts of the complex permittivity of the dry sandstone sample, the saturating fluid (oil, brine, and nanofluid) and the saturated samples were measured using Keysight Network Analyzer (ENA E5071C) with dielectric probe kit within the frequency range of 1.0 MHz to 4.0 GHz which has a measurement range of 300 kHz–20 GHz. The output data from the network analyzer are the real and imaginary permittivity, loss tangent, and scattering parameter (S11). The frequency-dependent conductivity σac (S/m), was computed from the measured complex relative permittivity values as
(6)
(6) where εo = 8.85 × 10⁻¹² Fm−1 is free space permittivity and ω = 2πf is the angular frequency. Since relative permittivity of lossy materials is formulated as
(7)
(7) This was done to estimate the dielectric properties of the reservoir under the different saturation stages encountered during the nanofluid core flooding process.
3. Results and discussion
3.1. XRD and FTIR analysis
To confirm the formation of Fe3O4 nanoparticles, the XRD pattern presented in Figure a was used to study the crystal structure of the synthesized nanoparticles. The XRD spectrum exhibit diffraction which corresponds to the (111), (220), (311), (400), (422), (511), (440), and (533) crystal planes of Fe3O4. These peaks match with an earlier report (JCPDS file no. 19-0629) in the crystallographic database. From the XRD pattern, the average crystal size of the Fe3O4 nanoparticles was calculated as 32.5 nm from the (311) peak using the Scherrer equation.
Figure 1. XRD pattern and FTIR spectrum of Fe3O4 nanoparticles.
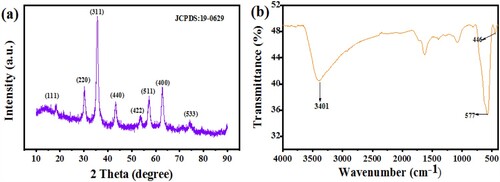
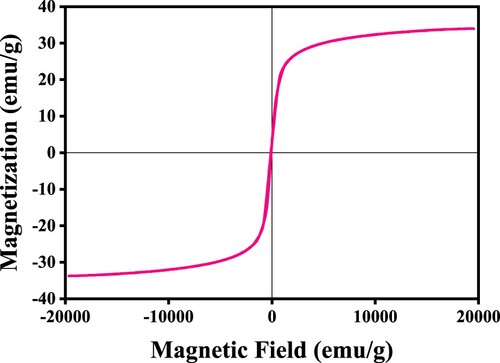
FTIR analysis presented in Figure b shows a strong peak at 577 cm−1 and a weak one at 448.31 cm−1, both of which can be ascribed to the stretching of Fe-O stretching mode. The broad peak around 3401 cm−1 is the vibrational characteristics of the hydroxyl functional group (-OH) [Citation26]. The other absorption peaks located at approximately 1560 and 1050 cm−1 emanates from the nitro compound (N-O) and primary alcohol (C–O) stretching, respectively. These analyses confirm the sample as Fe3O4. Figure shows the magnetic hysteresis curve of the magnetite nanoparticles. The sample has a saturation magnetization of 33.9 emu/g and coercivity value of 17.7 emu/g. The hysteresis curve indicates that the magnetite sample is ferromagnetic and therefore can absorb electromagnetic waves [Citation27].
Figure 2. Hysteresis curve of the Fe3O4 nanoparticles.
3.2. Pore size distribution
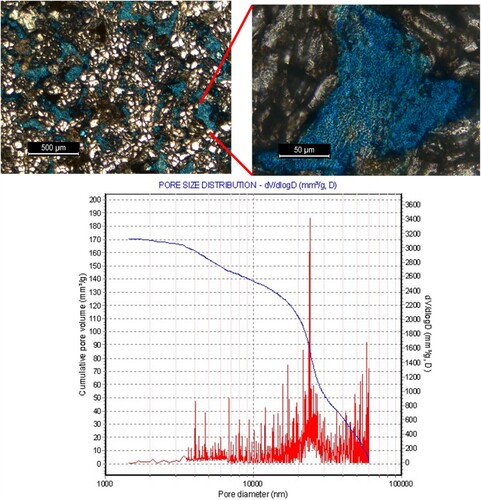
A combination of mercury porosimetry and thin section analysis was conducted on the core rock sample to have an insight into the pore structure and mineral content distribution. Figure shows the thin section image depicting a visual representation of the pore size distribution of the sample. The sandstone is composed majorly of quartz (white-colored grains), with the presence of accessory clay minerals and iron inclusions. The sandstone is characterized by intergranular pores as indicated by the blue colour (Figure a), which are the dominant pore type. The pores are randomly distributed but connected in some places. Also observed are grain suturing and abutting of grains into each other, which possibly accounts for the relative absence of mesopores. From the pore distribution data (Figure b), the sample is dominated by micropores with an average diameter of 14 μm and a cumulative pore volume up to 170 mm3/g. The micropores also exhibit a modal pore diameter of approximately 24 μm. This means that nanoparticles with sizes up to hundreds of nanometers can penetrate and flow through the pores, without blocking or reducing the pore throats. It is clear from the petrophysical data that despite the heterogeneous composition of the rock, the pores are fairly connected. The dielectric permittivity of the saturated rocks is affected and limited by the effective pores which determine the volume fraction of the saturating fluids.
Figure 3. (a) Thin section image showing pore space indicated by blue epoxy, (b) magnified image of pore space, and (c) Pore size distribution of Berea sandstone sample from mercury porosimetry.
3.3. EM response and resonant frequency of the sandstone
The respective dielectric permittivity, loss, and calculated electrical conductivity at each resonant frequency are presented for the different fluid saturation cases. As generally known, the real part of the permittivity ε′ represents the electric energy storage ability, while the imaginary part ε′′ denotes electric dissipation [Citation28]. The dielectric permittivity and EM response of fluid containing rocks are known to be governed by three polarization mechanisms. These are electric double layer polarization (within a broad frequency range below 10 MHz), interfacial polarization (dominant within 10 kHz to 10 MHz), and the dipolar polarization which stretches over the gigahertz frequency range [Citation11].
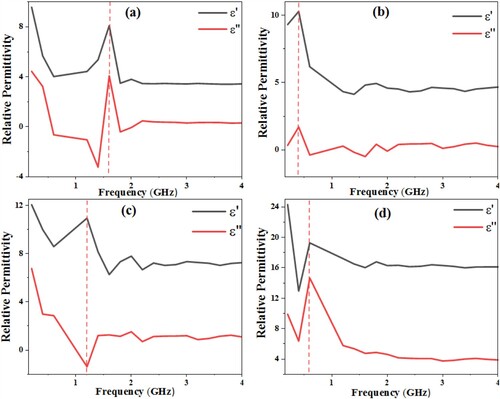
Figure shows the experimentally measured frequency-dependent complex permittivity of the Berea sandstone at different fluid saturation stages. As anticipated, there is considerable variation in the measured permittivity values due to significant distinction in the response of the injected fluids molecules to applied EM wave. The dry sandstone (Figure (a)) has the lowest ε′ value, which increases with the injection of crude oil, brine, and Fe3O4 nanofluid respectively (Figure b–d). The high dielectric value 19.1 of the sample containing Fe3O4 nanofluid and oil (Figure (d)) over a wide frequency range can be attributed to dipolar polarization due to the presence of many strong dipole particles of the nanoparticle. This is in agreement with the fact that the high permittivity response of rocks is primarily sensitive to water content [Citation29], (brine and nanofluid in this case). Since the relative permittivity of brine (72.6) and Fe3O4 nanofluid (74.2) are much higher than that of the dry mineral grains of the host rock (4.1). Since dielectric permittivity is directly related to the polarizability of the reservoir medium, it can be presumed that the polarizability of the medium will be improved during EM irradiation due to the inclusion of polar molecules of the nanoparticle and brine. Thus, allowing for maximum energy transfer to reservoir material for stimulation and mobilization of trapped oil. The result (Figure a–d) also indicates a decrease in the required frequency of the EM transmitter for EM-assisted nanoflooding, as portrayed by the shift of the dielectric permittivity peak values towards lower frequency (600 MHz).
Figure 4. Real and imaginary dielectric permittivity of (a) dry sandstone (b) oil-saturated sandstone (c) sandstone saturated with 40% oil and 60% brine (11,000 ppm) and (d) sandstone saturated with 40% oil and brine (11,000 ppm) with Fe3O4 nanofluid.
Electromagnetic response of the rock sample can be explained using the Debye equation [Citation30,Citation31] as evidenced by the multiple relaxations observed within the measured frequency range.
(8)
(8)
(9)
(9) where ε∞ is the high-frequency limit relative permittivity, τ is the polarization relaxation time, εs is the static permittivity, ω (ω = 2πf) represents the angular frequency, and σ is the conductivity. A general trend is observed for all the different saturation scenarios where the relative permittivity values decrease with increasing frequency. This trend can be explained by the polarization mechanisms which causes the permittivity response of the constituent molecules to increase with decreasing frequency. The permittivities decrease at high frequencies as the relaxation frequency is approached. This explains the diminishing trend of the permittivity value towards higher frequency as other polarization besides dipolar polarization fades out.
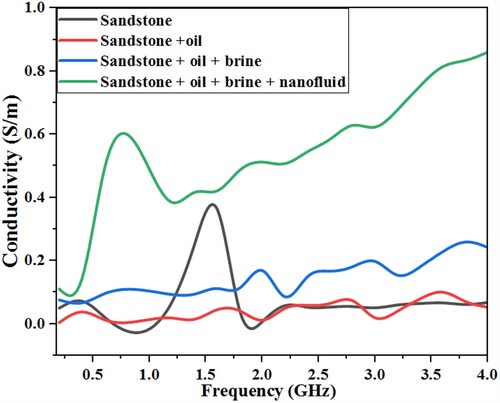
The dielectric constant value of the dry sandstone is closer to when saturated with oil as compared to other fluids (brine and nanofluid), this is reasonable since oil has small dielectric value. However, there is an obvious increment in permittivity value (to 8.1) for the sample saturated with 60% brine and 40% oil. The frequency-dependent conductivity calculated from the measured permittivity value using equation (6) is presented in Figure . The frequency-dependent electrical conductivity can be seen to display contrasting trends to the dielectric permittivity, increasing with increasing frequency. The sandstone saturated with brine, oil, and magnetite nanofluid has the highest frequency-dependent conductivity due to the abundance of ions and charges contributed by the saturating fluid, and possible Na+ hopping [Citation32].
Figure 5. Calculated frequency-dependent electrical conductivity.
Evaluation of the dielectric loss of the formation can be made from Figure . The figure presents the dielectric loss tangent which is the ratio of the lossy reaction to the lossless reaction of the medium to external applied EM wave. Since loss tangent is generally less than unity for the whole measure range, the medium can be regarded as a low loss (where tan δ ≈ δ). Therefore, the decay of propagating electromagnetic power P in the medium can be evaluated with [Citation23], where P0 is the initial power, δ is the loss tangent, k is the EM wavenumber and z is the propagation distance. The effect of these losses must be considered in designing EM transmitting antenna for effective hydrocarbon extraction from unconventional reservoirs [Citation33]. The results of the relative dielectric permittivity measurement of the sandstone samples are summarized in Table .
Figure 6. Dielectric tangent loss at different formation fluid saturation scenario.
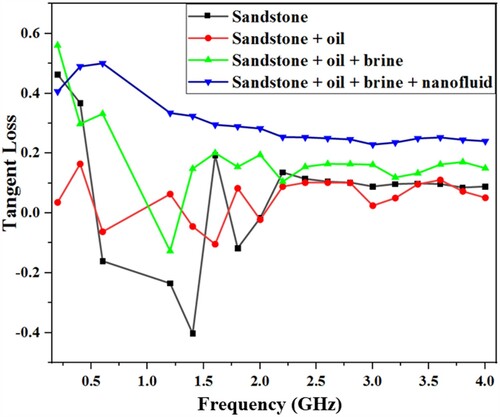
Table 1. Measured electric properties of sandstone with different fluid saturation.
4. Conclusion
The dielectric response, electrical conductivity, and resonant frequency of Berea sandstone saturated with oil, brine, and nanofluid have been determined within a frequency range of 1 MHz to 4.0 GHz. The significant variation of these values can be attributed to the additional dipole polarization due to the presence of brine and nanofluid. The presence of connected micropores was found to play an important role in the dielectric response of the rock, as it determines the volume fraction of the saturating fluid. The resonant frequency of the reservoir, when saturated with oil, brine, and Fe3O4 nanofluid, is 600 MHz (with ε′ = 19.1) within the measured frequency range. This implies that the maximum transfer of EM energy for stimulation and activation of injected nanofluid can be achieved by irradiating the EM wave of this frequency within the reservoir for mobilization of the residual oil. This also suggests that a lesser EM power level would be required at this natural frequency compared to other frequencies within the measurement range. Identification of the dielectric peaks and estimation of dielectric dispersion range of the saturated rock is vital in tuning the frequency of applied EM wave to reservoir resonant frequency for nanoparticle activation.
Disclosure statement
No potential conflict of interest was reported by the author(s).
References
- Chilingar GV, Haroun M. Electrokinetics for petroleum and environmental engineers. New Jersey: John Wiley & Sons; 2014.
- Sherman MM. Interpretation of dielectric permittivity measurements in the 20-to 50-MHz frequency range. SPE Formation Eval. 1990;5(01):76–80. doi: 10.2118/17605-PA
- Adebayo LL, Wahaab FA, Lawal SK. Application of conventional geophysical method in investigating and characterizing landfills. Pet Coal. 2019;61(4):725–731.
- Schön JH. Physical properties of rocks: Fundamentals and principles of petrophysics. Leoben: Elsevier; 2015.
- Wahaab FA, Adebayo LL, Adekoya AA, et al. Physiochemical properties and electromagnetic wave absorption performance of Ni0. 5Cu0. 5Fe2O4 nanoparticles at X-band frequency. JAllC. 2020;836:155272.
- Lesmes DP, Morgan FD. Dielectric spectroscopy of sedimentary rocks. J Geophys Res Solid Earth. 2001;106(B7):13329–13346. doi: 10.1029/2000JB900402
- Yahya N, Ali AM, Wahaab FA, et al. Spectroscopic analysis of the adsorption of carbon based nanoparticles on reservoir sandstones. J Mater Res Technol. 2020;9(3):4326–4339. doi: 10.1016/j.jmrt.2020.02.058
- Amin M, Khan AD. Polarization selective electromagnetic-induced transparency in the disordered plasmonic quasicrystal structure. J Phys Chem C. 2015;119(37):21633–21638. doi: 10.1021/acs.jpcc.5b06154
- Lyklema SDJ, Shilov EC. The relaxation of the double layer around colloidal particles and the low-frequency dielectric dispersion: Part I. Theoretical considerations. Electrochem. 1983;143(1-2):1–21.
- Revil A, Skold M. Salinity dependence of spectral induced polarization in sands and sandstones. GeoJI. 2011;187(2):813–824.
- Revil A. Effective conductivity and permittivity of unsaturated porous materials in the frequency range 1 mHz–1 GHz. Water Resour Res. 2013;49(1):306–327. doi: 10.1029/2012WR012700
- Ebadati A, Davarpanah A, Mirshekari B. Stimulated-based characterization recovery enhancement feedback of oil-rim reservoirs. Energy Sources Part A. 2018;40(21):2528–2541. doi: 10.1080/15567036.2018.1503759
- Olhoeft G. Low-frequency electrical properties. Geophysics. 1985;50(12):2492–2503. doi: 10.1190/1.1441880
- Sihvola AH, Kong JA. Effective permittivity of dielectric mixtures. ITGRS. 1988;26(4):420–429.
- Sahni A, Kumar M, Knapp RB. “Electromagnetic heating methods for heavy oil reservoirs,” Lawrence Livermore National Lab., CA (US), 2000.
- Kothari N, Raina B, Chandak KB, et al. “Application of ferrofluids for enhanced surfactant flooding in IOR,” in SPE EUROPEC/EAGE Annual Conference and Exhibition, 2010: Society of Petroleum Engineers.
- Divandari H, Hemmati-Sarapardeh A, Schaffie M, et al. Integrating synthesized citric acid-coated magnetite nanoparticles with magnetic fields for enhanced oil recovery: Experimental study and mechanistic understanding. J Pet Sci Eng. 2019;174:425–436. doi: 10.1016/j.petrol.2018.11.037
- Fang FF, Choi HJ, Seo Y. Sequential coating of magnetic carbonyliron particles with polystyrene and multiwalled carbon nanotubes and its effect on their magnetorheology. ACS Appl Mater Interfaces. 2010;2(1):54–60. doi: 10.1021/am900577w
- Belhaj AF, Elraies KA, Janjuhah HT, et al. Electromagnetic waves-induced hydrophobic multiwalled carbon nanotubes for enhanced oil recovery. J Pet Explor Prod Technol. 2019;9(4):2667–2670. doi: 10.1007/s13202-019-0653-6
- Alnarabiji MS, Yahya N, Nadeem S, et al. Nanofluid enhanced oil recovery using induced ZnO nanocrystals by electromagnetic energy: Viscosity increment. Fuel. 2018;233:632–643. doi: 10.1016/j.fuel.2018.06.068
- Lee K, Adil M, Zaid HM, et al. Wettability, interfacial tension (IFT) and viscosity alteration of nanofluids under electromagnetic (EM) waves for enhanced oil recovery (IFT) applicationsEngineering Design Applications. Switzerland: Springer; 2019. p. 305–311.
- Obalalu AM, Wahaab FA, Adebayo LL. Heat transfer in an unsteady vertical porous channel with injection/suction in the presence of heat generation. J Taibah Univ Sci. 2020;14(1):541–548. doi: 10.1080/16583655.2020.1748844
- Ali H, Soleimani H, Yahya N, et al. Absorption of electromagnetic waves in sandstone saturated with brine and nanofluids for application in enhanced oil recovery. J Taibah Univ Sci. 2020;14(1):217–226. doi: 10.1080/16583655.2020.1718467
- Zhan X, Schwartz LM, Toksöz MN, et al. Pore-scale modeling of electrical and fluid transport in Berea sandstone. Geophysics. 2010;75(5):F135–F142. doi: 10.1190/1.3463704
- Adebayo LLS, Soleimani H, Yahya N, et al. Investigation of the broadband microwave absorption of citric acid coated Fe3O4/PVDF composite using finite element method. Appl Sci. 2019;9(18):3877. doi:10.3390/app9183877.
- Cai W, Wan J. Facile synthesis of superparamagnetic magnetite nanoparticles in liquid polyols. J Colloid Interface Sci. 2007;305(2):366–370. doi: 10.1016/j.jcis.2006.10.023
- Adebayo LL, Soleimani H, Yahya N, et al. Recent advances in the development OF Fe3O4-BASED microwave absorbing materials. Ceram Int. 2020;46(2):1249–1268. doi: 10.1016/j.ceramint.2019.09.209
- Jha BK, Oni MO. Electromagnetic natural convection flow in a vertical microchannel with Joule heating: exact solution. J Taibah Univ Sci. 2018;12(5):661–668. doi: 10.1080/16583655.2018.1494423
- Olhoeft GR. Electrical properties of rocks. Phys Prop Rocks Miner. 1981;2:257–297.
- Wen B, Cao M-S, Hou Z-L, et al. Temperature dependent microwave attenuation behavior for carbon-nanotube/silica composites. Carbon N Y. 2013;65:124–139. doi: 10.1016/j.carbon.2013.07.110
- Wu N, Lv H, Liu J, et al. Improved electromagnetic wave absorption of Co nanoparticles decorated carbon nanotubes derived from synergistic magnetic and dielectric losses. Phys Chem Chem Phys. 2016;18(46):31542–31550. doi: 10.1039/C6CP06066H
- Choudhury TR, Basu A. AC conductivity and dielectric relaxation studies of sandstone: A correlation with its thermoluminescence. J Ovionic Res. 2008;4(6):35–42.
- Wahaab FA, Yahya N, Shafie A, et al. Determination of optimum frequency for electromagnetic-assisted nanofluid core flooding. Appl Sci. 2019;9(21):4608. doi: 10.3390/app9214608