
 ?Mathematical formulae have been encoded as MathML and are displayed in this HTML version using MathJax in order to improve their display. Uncheck the box to turn MathJax off. This feature requires Javascript. Click on a formula to zoom.
Abstract
The present study was planned to explore the relationship between soil chemistry with bacterial population of Bt and non-Bt cotton and their phenotypic and molecular characteristics. The pre-plant soil and rhizospheres of Bt and non-Bt cotton were collected and analyzed for some soil parameters and bacterial population. The bacterial isolates were analyzed for their morphological, biochemical, and molecular characteristics. Bacterial population showed a significant (p < 0.05) positive correlation with clay content, electrical conductivity, organic matter, total nitrogen, and available phosphorus and potassium negative with correlation with pH. Bt cotton showed a non-significant effect on the soil parameters, significant decrease in bacterial population, change in the morphological and biochemical characteristics of rhizobacteria and replacement of four bacterial species with five new ones suggests the potential effect of Bt cotton on its rhizoflora. The rhizosphere of non-Bt cotton cultivated in the fertile agriculture field was found to be the best for bacterial growth.
1. Introduction
The rhizosphere is a thin layer of soil that surrounds the plant roots, presents a primary location of nutrient uptake, and populated with microflora [Citation1,Citation2]. It is a rich source of nutrients for colonizing bacteria due to the release of a variety of biologically active compounds from plant roots [Citation3]. The root exudates affect the availability of nutrients in the rhizosphere which affects the population and metabolic activities of rhizoflora In return, the nutrient uptake by plants is influenced by the presence of rhizosphere microbes [Citation4–6]. The rhizobacteria have been found to enhance plant growth and reduce biotic and abiotic stresses [Citation7]. Pseudomonas and Bacillus genera are predominant among plant growth-promoting rhizobacteria in the rhizosphere that alleviate plant stresses due to their unique characteristics, diversity, and relationship to plant roots [Citation8]. Bacillus species are one major type of spore-producing rhizobacteria that stimulate plant growth and health by secreting certain metabolites. Bacillus species can solubilize soil phosphorus, enhance nitrogen fixation, and produce siderophores that promote the growth of plants but suppresses the pathogens [Citation7].
Genetically modified (GM) plants possessing Bacillus thuringiensis (Bt) genes with insecticidal properties are being preferred by the researchers to increase the crop production. However, there exist some biosafety issues on the commercial utilization of Bt varieties [Citation9]. The debate surrounding Bt cotton cultivation is most important for developing countries. Bt cotton has diverse benefits, however public concerns exist of its in vitro and in vivo studies [Citation10]. There is a growing concern about the cultivation of Bt cotton referral to its effects on general soil health and microbial populations [Citation11]. Bt cotton is known to produce and release toxins in the rhizosphere through root secretions after crop harvesting, ploughing and defoliation. The microorganisms receive root exudates and affect directly by Bt toxins released in the soil [Citation12]. Bt toxin is released into the soil through three main pathways: (i) root exudates, (ii) plant residues plowed into soil after crop harvest, and (iii) pollen grains falling [Citation13]. In the soil, it does not change its conformation and remains active. It is adsorbed on clay particles, forms organic-mineral complex or make linkage with the components of humic acid and protected from the microbial degradation [Citation14]. Bt toxin is capable of maintaining its active form for a long time. It influences the soil microbial diversity as well as its metabolic functions [Citation15]. Soil physicochemical properties are affect by the release of Bt toxins [Citation16].
Bt crops affect nutrient cycling and change the chemistry of the rhizosphere [Citation17]. Nutrient dynamics are influenced by diverse means during microbial life span based on time and space relevance [Citation18]. The change in soil pH directly influences the microbial activity which leads to a drastic change in enzyme activities in the soil [Citation19]. Some reports reveal that more enzymatic activities in the soil can be due to more organic matter besides existing nutrients in Bt than non-Bt cotton plants [Citation20]. Bt plants are capable to alter microbial dynamics, ecosystem functions, and soil biodiversity and have impacts on the physicochemical characteristics of soil [Citation21]. However, some studies report that Bt cotton has no negative effect on soil nutrients, bacterial population, colony morphologies, and the metabolic and biochemical activities of microbes [Citation9,Citation16,Citation22].
Since Bt cotton dominates in cotton grown areas in Pakistan; it is imperative to find out the effects of Bt rhizosphere on associated soil characteristics and bacterial flora. Limited data is available on the impact of Bt cotton on soil dynamics and bacterial microbiomes. Most of the outcomes of previous studies are controversial and need further assessment of biosafety for Bt cotton crops particularly for the influence of Bt toxins on the soil microbes. The critical experimental studies are required on plant growth-promoting rhizobacteria as they play important role in plant growth. This study was aimed to assess the potential effects of soil parameters on bacterial population and that of Bt cotton on the phenotypic and molecular characteristics of its rhizobacteria.
2. Materials and methods
2.1. Selection of fields
Three different fields including (i) fertile agriculture filed (FAF) [Chak 1-Faiz (30°01'85.7"N 71°50'71.6"E; alt. 119 m)], ii) cotton research field (CRF) [Central Cotton Research Institute (CCRI) (30°15'09.2"N 71°44'46.6"E, alt. 122 m)] and iii) a non-agricultural filed (NAF) [College of Textile Engineering, Bahauddin Zakariya University, Multan (30°23′30.2′′N 71°56′57.0′′E, alt. 125 m)] located in the cotton belt of district Multan, Southern Punjab, Pakistan were selected for experimental trials.
2.2. Cultivation of cotton
Seeds of Bt and non-Bt cotton varieties were obtained from gene pool of Central Cotton Research Institute (CCRI), Multan for research trials. The seeds were labelled and certified by the institute as Bt: Cyto-178 and non-Bt: Cyto-120. The Bt and non-Bt cotton cultivars were sown during the crop year 2015–2016 at selected fields on beds 75 cm apart with a plant to plant distance of 30 cm in randomized complete block design (RCBD) layout. The fields were irrigated immediately after sowing followed by immediate (24 h after sowing) application of pre-emergence weedicide “Dual gold” (2000 mM per hectare) to control broadleaf weeds. The requirement of macronutrients for the growth of the crop was met by applying fertilizers including urea (150 kg/ha), diammonium phosphate (50 kg/ha), and potassium sulfate (50 kg/ha). The phosphorus and potassium fertilizers were applied by incorporating into the soil at the time of seed-bed preparation. The nitrogen fertilizer was applied in three split doses (i) at squaring phase (35–40 days after sowing), (ii) at flowering phase (60–65 days after sowing), and (iii) at first boll split (85–90 days after sowing) The requirement of micronutrients was also fulfilled by applying minerals including boron and zin in the form of boric acid and zinc sulfate respectively (300 g each). The micronutrients were applied through foliar sprays at 45, 60 and 75 days after sowing.
2.3. Soil sampling
The pre-plant soil samples were collected from the selected fields from a depth of 15 cm, air-dried, ground, sieved through a US 12 mesh (<2 mm) [Citation23] and stored in plastic bags. The soil samples from the rhizosphere of Bt and non-Bt cotton grown in the selected fields were collected at 90 days after sowing. Three plants of each variety from each field were randomly uprooted up to a depth of 15 cm [Citation24]. The soil adhered to plant roots, obtained after manual shaking, was collected on sterile plastic sheets using an ethanol-sterilized spatula, homogenized well, stored in sterile plastic bags at 4°C and processed for isolation of bacteria (within 24 h) and analysis of soil parameters.
2.4. Soil parameters
Soil texture and clay were determined using the hydrometer method [Citation25]. The pH of the soil-water suspension (1:1) was measured by pH metre Jenway 3540 [Citation26]. The electrical conductivity of supernatant liquid from soil-water suspension was recorded on electrical conductivity metre (Jenway 3540, conductivity electrode Chemtrix 70, Chemtrix Inc. Hillsboro, USA). Organic matter was estimated as reported earlier [Citation27]. Total nitrogen was estimated through the digestion technique [Citation28]. Soil samples were extracted with 0.5M NaHCO3 [Citation29] for available phosphorus. Available potassium was measured by the ammonium acetate method [Citation30].
2.5. Isolation of rhizobacteria
The soil (10 g) was suspended in sterile Ringer solution (90 mL) in a sterile flask and plugged with cotton [Citation11]. The suspension was homogenized by shaking in a Shaker-incubator (Labtech LSI-3016A, Korea) for 10 min at 300 g. The bacteria were isolated by the serial dilution method. The serial dilutions (10−1–10−6) of the suspension were prepared and 100 µL from each dilution was applied on Luria–Bertani (LB) agar plates (15 cm) followed by incubation for 48 h at 37°C. The viable cell count was determined in terms of colony-forming units (CFU) to measure the survival efficiency using the following formula [Citation31].
Where,
,
, and
are the number of colonies, the volume of inoculation, and dilution factor respectively.
2.6. Culturing and purification of bacteria
The pure isolates were obtained by picking and transfering the discrete bacterial colonies to freshly prepared agar medium plates using the streak-plating technique [Citation32]. The bacterial colonies were differentiated by growing in the enriched, selective, and differential media. The purified bacterial colonies were preserved in nutrient-glycerol broth (50:50) at −70°C until further analyses.
2.7. Morphological and biochemical characterization of rhizobacteria
The purified bacterial isolates were cultured on the respective media and subjected to their morphological, biochemical, and molecular characterization. The colony characteristics including shape, size, opacity, colour, texture, margin, and elevation, cell morphology, Gram staining, and spore formation were observed under the microscope (Olympus CH-2, Japan). The biochemical characteristics including the production of enzymes including oxidase, catalase, urease, gelatinase, and amylase, indole, hydrogen sulfide, pyruvate and lactate, fermentation of sugars including lactose, glucose, maltose, fructose, sucrose, and mannitol, utilization of citrate and reduction of nitrate were performed using the previously reported standard methods [Citation32,Citation33].
2.8. Molecular characterization
2.8.1. Extraction of bacterial genomic DNA
The bacterial isolates were cultured in LB broth at 37°C for 18–24 h in a shaker-incubator (Labtech LSI-3016A, Korea) at 300 g and their deoxyribonucleic acid (DNA) was extracted using commercially available DNA extraction kit (Vivantis kit; catalog: GF-BA-100 preps, USA). The purity of DNA was checked by noting the absorbance of the extract at 260 and 280 nm on a spectrophotometer (PD303-UV, Japan). The purity of DNA was calculated as the ratio of absorbance:
2.8.2. Amplification of bacterial-specific 16S rRNA gene
The bacterial specific 16S ribosomal RNA gene was amplified by polymerase chain reaction (PCR) in a thermal cycler (Agilent, Sure Cycler 8800, USA) using universal primer derived from 16S rRNA sequence of Escherichia coli [Citation34]. The PCR amplification included an initial denaturation of DNA at 94°C for 5 min, 35 cycles of denaturation at 94°C followed by annealing at 55°C (each for 30 s) and extension of DNA strand at 72°C (each for 1 min) and a final extension at 72°C (10 min). Universal primers capable of initiating PCR amplification on a wider range of bacteria were: forward primer 5'CAGCAGCCGCGGTAATAC3’ and reverse primer 5'ACGGGCGGTGTGTACAAG3’.
The reaction mixture (50 µL) contained 10x PCR buffer (5 µL), 100mM deoxy nucleotide triphosphates (0.4 µL), 5 U Taq DNA polymerase (0.25 µL) and 40 ng DNA template (2 µL) (BioShop, Canada), 25mM MgCl2 solution (3 µL) (Sigma, Germany), 10µM forward and reverse primer (0.5 µL each) (Macrogen, Korea), and nuclease-free water (38.35 µL). The PCR products were purified using PCR and DNA cleanup kit Cat.: T1030S (Monarch® New England Biolabs Inc.). The products of PCR were analyzed by electrophoresis run at 120 V for 1 h using 1% agarose gel in 0.5x Trisborate ethylenediaminamine tetraacetic acid (TBE) buffer pre-stained with ethidium bromide (0.2 µg/mL) (Sub-Cell, Bio-Rad).
2.8.3. Sequence determination of 16S ribosomal RNA gene
The purified PCR products were sent to Macrogen Inc. (Korea) for Sanger sequencing. The sequencing reactions were carried out using the respective primers. The 16S rRNA gene sequences were manually aligned and compared against recent homologous sequences of 16S ribosomal RNA available on the NCBI database by BLAST [Citation35]. The 16S rRNA gene sequence data described in this article deposited at GenBank is accessible under the accession numbers KY820894 to KY820943 and MF360030 to MF360079.
2.8.4. Construction of phylogenetic tree
The phylogenetic trees were constructed using Mega 7.0 software [Citation36]. The evolutionary history was concluded using the neighbor-joining method [Citation37]. The bootstrap value of the consensus tree concluded from the 100 replicates represented the evolutionary history of the investigated taxa [Citation38]. Branches corresponding to partitions reproduced in less than 50% bootstrap replicates were collapsed. Percentages of replicate trees in that linked taxa clustered together in the bootstrap test were represented in the above branches. The phylogenetic trees were constructed to scale with branch lengths in similar units. Evolutionary variations were calculated employing the p-distance technique [Citation39] and are in the units of several base variation site. The analysis comprised of 51 nucleotide sequence of bacterial isolates of Bt and 49 of the non-Bt cotton rhizosphere.
2.9. Statistical analysis
The data were presented as mean ± SD of three parallel replicates while the means were differentiated by one-way analysis of variance (ANOVA) using Tukey's multiple range tests. The trends of variation in the bacterial population under the influence of soil attributes were determined by regression analysis of the experimental data.
3. Results
3.1. Physiochemical properties of soil/rhizosphere
Pre-plant analysis of selected experimental fields exhibited moderate to a high degree of variability in different soil parameters (Table ). The texture of the soil obtained from FAF, CRF, and NAF were found to be silty clay loam, silt loam, and sandy loam before and after plantation respectively. The CC, pH, and EC of the soil obtained from Bt and non-Bt cotton rhizosphere from different fields ranged from 10.1 ± 0.6–35.26 ± 2.3%, 8.72 ± 0.08–8.90 ± 0.9% and 475 ± 19.86–735 ± 14.8 µS cm−1 respectively. The OM of the soil obtained from the rhizosphere of Bt and non-Bt cotton from different fields ranged from 0.57 ± 0.06–0.86 ± .01%. The minerals content, in terms of TN, AP and AK, ranged from 0.06 ± 0.03–0.104 ± 0.01%, 4.65 ± 0.2–15.4 ± .59 (mg kg−1), and 38 ± 2.8–118 ± 5.09 (mg kg−1) respectively. The CC, and EC of the PPS and rhizosphere of cotton varieties obtained from different fields were found to be statistically different (p < 0.05). The OM of PPS and RNBtC, TN of RNBtC and RBtC, and AP and AK of PPS and rhizosphere of both of the cotton varieties obtained from different fields were also found to be statistically different (p < 0.05). However, no significant variation was observed in all of the studied physicochemical parameters among the PPS, RNBtC, and RBtC from a particular field.
Table 1. Physicochemical parameters of pre-plant soil and rhizosphere of Bt and non-Bt cotton cultivated in different fields.
3.2. Bacterial population
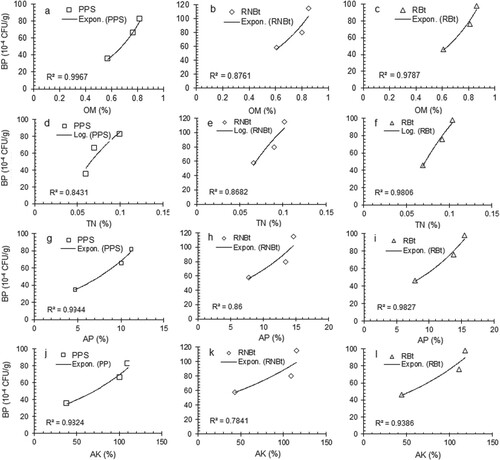
The population of soil bacteria in the soil samples obtained from pre-plant soil and rhizosphere of Bt and non-Bt cotton cultivated in different fields ranged from 46 to 98 and 58–115 (10−4 CFU/g) (Tables 1S and 2S represent the supplementary data). A statistically significant (p < 0.05) difference was observed in the bacterial population of PPS, RNBtC, and RBtC obtained from a different field. Regression analysis of the experimental data showed significant effects of the studied parameters of soil on the bacterial population. Figure (a–i) presents the trends of variation in the bacterial population under the influence of variation in physical parameters of soil obtained from PPS, RNBtC, and RBtC grown in different fields. The CC and EC showed a significant exponential positive effect while pH showed an exponential negative effect on the bacterial population with relatively higher values of the regression coefficient (R2 = 0.8338–0.9952) in each case. Figure (a–l) presents the trends of variation in the bacterial population under the influence of variation in chemical parameters of soil obtained from PPS, RNBtC, and RBtC cultivated in different fields. The OM, AP, and AK showed a significant exponential positive effect while TN showed a significant logarithmic positive effect on the bacterial population with relatively good values of the regression coefficient (R2 = 0.7841–0.9967) in each case.
Figure 1. Variation in the bacterial population (BP) in pre-plant soil and rhizospheres of non-Bt and Bt cotton at various levels of some physical parameters. *PPS: Pre-plant soil, RNBtC: Rhizosphere of non-Bt cotton, RBtC: Rhizosphere of Bt cotton, CC: Clay content, EC: Electrical conductivity.
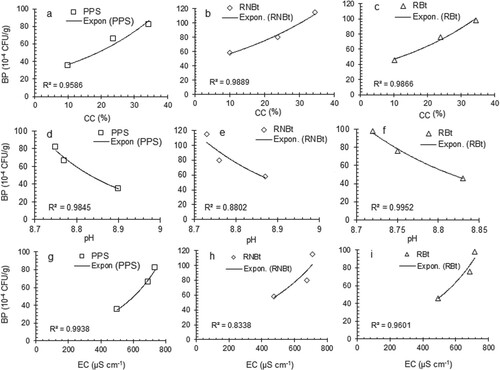
Figure 2. Variation in the bacterial population (BP) in pre-plant soil and rhizospheres of Bt and non-Bt cotton at various levels of some chemical parameters. *PPS: Pre-plant soil, RNBtC: Rhizosphere of non-Bt cotton, RBtC: Rhizosphere of Bt cotton, OM: Organic matter, TN: Total nitrogen, AP: Available phosphorus, Available potassium.
The following generalized exponential and logarithmic regression equations were obtained from the regression analysis that helped to explain the relationship between the soil parameters and bacterial population.
Where
,
,
, and
are bacterial population, bacterial population sensitivity coefficient (slope of the curve), the bacterial population at the negligible level of the soil parameters (intercept), and soil parameters respectively.
The sign and magnitude of the slope indicate the trend of variation in the bacterial population in response to variation in the soil parameters. The statistical terms including the components of the above regression equations, the regression coefficients, and the significance values obtained from the regression analysis of the effect of soil attributes on the population of rhizobacteria are presented in Table .
Table 2. Statistical parameters for the regression analysis of the effect of soil parameters on bacterial population in pre-plant soil and rhizosphere of Bt and non-Bt cotton.
3.3. Phenotypic characteristics of bacterial isolates
3.3.1. Morphology
The morphological characteristics of bacteria obtained from the rhizospheres of Bt and non-Bt cotton are presented in Table . Majority of the colonies were large in size (76–78%), opaque (100%) with cream colour (47–49%), dull appearance (78–84%), flat elevation (74–80%), smooth texture (96–100%) and entire margins (100%) in both cases. The observed colonies of rhizobacteria of both of the cotton varieties mostly showed irregular colony shape (74–84%), Bacilli cell shape (100%), and Gram-positive staining and spore-formation (88–92%).
Table 3. Morphological characteristics of bacterial isolates from rhizosphere of Bt and non-Bt cotton.
3.3.2. Biochemical parameters
The biochemical characteristics of bacterial isolates obtained from the rhizospheres of Bt and non-Bt cotton are presented in Table . All of the isolates (100%) from Bt and non-Bt rihizosphere were found to produce catalase. 73% of isolates from RNBtC and 78% from RBtC showed gelatinase production. Amylase production was shown by 76% of isolates from RNBtC and 71% from RBtC. Relatively low production of oxidase (35 and 37%) and urease (12 and 8%) was observed by the bacterial isolates from RNBtC and RBtC respectively. The isolates from RNBtC and RBtC showed good results of fermentation of glucose (98 and 96%), sucrose (80 and 78%), maltose (96 and 92%), fructose (90 and 86%), and mannitol (57 and 60%) but relatively poor fermentation of lactose (18 and 22%) respectively. The production of indole and hydrogen sulfide was found to be negative in all of the isolates from RNBtC and RBtC. However, 94 and 92% isolates of RNBtC and RBtC showed pyruvate production respectively. A relatively low percentage of bacterial isolates (2–4%) gave positive results for lactate production. An 88 and 84% of isolates from RNBtC and RBtC respectively showed citrate utilization and 55 and 59% were found positive in nitrate reduction.
Table 4. Biochemical characteristics of bacterial isolates from rhizosphere of Bt and non-Bt cotton.
3.3.3. Molecular characterization of bacterial isolates
3.3.3.1. Electrophoretic patterns of 16S rRNA gene
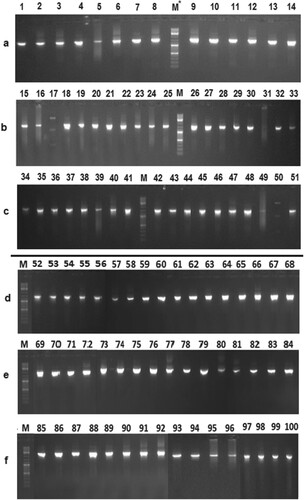
The electrophoretic patterns of the 16S rRNA gene of bacterial isolates obtained from Bt and non-Bt cotton rhizospheres are presented in Figure .
Figure 3. Electrophoretic patterns of the 16S rRNA gene of bacterial isolates obtained from the rhizospheres of Bt and non-Bt cotton. *M: 1 kb DNA marker. (a–c) Rhizosphere of Bt cotton, (d–f) Rhizosphere of non-Bt cotton.
3.3.3.2. Identification of bacteria based on sequences of 16S rRNA gene
Bacterial species were confirmed up to strain level through 16S rRNA gene sequencing. The bacterial isolates from Bt contton rhizosphere showed 95–99% and those from non-Bt cotton rhizosphere showed 92–99% similarity with their nearest relatives as available on GenBank database (Table 2S). Overall 88% of the bacterial isolates showed 99% similarity while 12% of bacteria showed 92–98% similarity with their nearest relatives. Based on the sequence of 16S rRNA gene eleven bacterial species including Bacillus cereus, Bacillus subtilis, Bacillus safensis, Bacillus stratosphericus, Bacillus pseudomycoides, Bacillus pumilus, Bacillus toyonensis, Bacillus licheniformis, Bacillus endophyticus, Bacillus marisflvi Serratia marcescens were identified in both Bt as well as non-Bt rhizospheres. However, five bacterial species including Pseudomonas monteilii, Bacillus vietnamiensis, Bacillus drentensis, Bacillus anthrasis, and Lysinibacillus macroides were exclusively identified in Bt cotton rhizosphere, whereas Bacillus flexus, Pseudomonas plecoqlossicida, Bacillus aryabhattai, and Bacillus tequilensis were particularly identified in the non-Bt cotton rhizosphere.
3.3.4. Phylogenetic relationships of bacterial strains
The local regions of similarity in the16S rRNA sequences was identified using Basic Local Alignment Search Tool (BLAST). BLAST analysis, identified 16 types of bacteria from Bt cotton rhizosphere. The Molecular Evolutionary Genetic Analysis (MEGA7) generated the phylogenetic tree based on 51 strains of bacterial isolates from the rhizosphere of Bt cotton (a). The bacterial strains were divided into four monophyletic groups (MPGs) such as MPG1, MPG2, MPG3, and MPG4. MPG1 contained all strains of B. cereus and some other species of genus Bacillus including B. tyonensis, B. drentensis, B. anthrasis, B. pseudomycoides showing their close evolutionary relationships. L. marcoides also showed common ancestor, and close evolutionary relationships with the members of MPG1. All B. subtilis strains that appeared in MPG2, showed strong evolutionary relationships among these strains with relatively higher bootstrap values on their nodes. The joint appearance of B. safensis and B. pumilus in MPG3 indicated the similar evolution of both species. However, B. stratosphericus appeared as a separately with a common ancestor to the MPG3 clade. MPG4 contained three species of S. marcescens that appeared with high bootstrap values and showed common ancestors to those for P. monteilii.
Figure 4. Phylogenetic tree of bacterial isolates obtained from the rhizospheres of Bt and non-Bt cotton. *MPG: Monophyletic group. (a) Rhizosphere of Bt cotton, (b) Rhizosphere of non-Bt cotton.
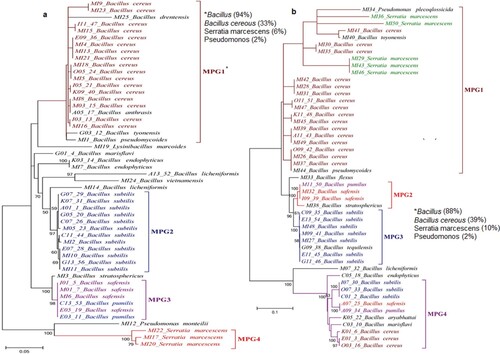
Similarly, forty-nine strains of bacteria from non-Bt cotton rhizosphere were taken to generate a phylogenetic tree (Figure b). The phylogenetic tree of bacterial strains obtained from non-Bt cotton rhizosphere was found to be different from those obtained from the Bt cotton rhizosphere. MPG1 was the largest clade among the four MPGs with twenty-four species that rmained unresolved. Several polytomies were found in MPG1 that indicated the lack of information regarding the evolution of these particular species. Three strains of B. cereus appeared in MPG4 indicating the evolutionary divergence of these species from the rest of B. cereus strains. MPG2 contained one strain of B. pumilus and two strains of B. safensis while one strain of each of these species showed evolutionary divergence and appeared in MPG4 clade. Three strains of B. subtilis appeared in clade MPG4 while rest of the B. subtilis strains appeared in MPG3 clad. However, B. endophyticus, B. licheniformis, B. marisflavi, and B. aryabhattai, showed common ancestors and close evolutionary relationships with MPG4.
4. Discussion
In the present study, the results indicate a statistically significant variation in the studied physicochemical parameters of pre-plant soil and Bt and non-Bt cotton rhizosphere from different fields (FAF, CRF, and NAF). The pre-plant soil and rhizosphere obtained from FAF showed silty clay loam texture, most favourable for the cultivation of crops and growth of rhizoflora [Citation40] The pre-plant soil and rhizosphere obtained from FAF was also found to show relatively higher values of CC, EC, OM, TN, AP, and AK while those obtained from NAF showed comparatively lowest values of these parameters.
The variation in the soil parameters of the selected fields significantly influenced the bacterial population in the pre-plant soil and rhizosphere. The trends of variation in bacterial population as a function of soil attributes, as explained by regression analysis of the experimental data, showed that bacterial growth is an exponential function of CC, pH, EC, OM, AP and AK (Figures a–i and a–c, g–l) and logarithmic function of TN (Figure d–f). The bacterial population was found to be an increase in response to an increase in the level of the studied physicochemical parameters except for pH. This may be attributed to the fact that the organic acids and root exudates in the rhizosphere accelerate the solubilization of phosphorus and potassium while alkaline salts restrict the availability of phosphorus due to the formation of less soluble calcium phosphate compounds [Citation41–43]. The pre-plant soil and rhizosphere of cotton varieties obtained from FAF, being rich in clay, OM, and available minerals, were found to be the best for bacterial growth and reproduction. The low level of the bacterial population in PPS and rhizosphere of cotton varieties of NAF may be due to non-cultivated and unfertilized land with relatively low levels of nutrientional components. The present results are in agreement with the previously reported findings [Citation44].
Plant-microbe interactions have revealed that crops are talented to figure out respective rhizosphere microbiomes. A change in the rhizosphere chemistry due to altered root exudation or decayed plant material added to the soil may influence the microbial population and its community surrounding the roots [Citation45]. The present results suggest no adverse impact of Bt cotton on the soil attributes and availability of nutrients for bacterial growth. However, the decrease in the bacterial population in RBtC as compared to RNBtC may be due to the secretion of various toxins from root extrudates of Bt cotton in its rhizosphere. The similar results of biochemical characteristisc of bacterial isolates from Bt and non-Bt rhizospheres indicate no significant adverse effect of Bt cotton on the metabolic processes of microbiomes.
Based on its significant effect on the bacterial population, Bt cotton was also studied for its potential effects on the morphological, biochemical, and molecular characteristics of its rhizoflora. The results indicated that the Bt cotton did not induce any changes in the colony size, odour, opacity, texture, elevation, and margination characteristics of the rhizobacteria as compared to non-Bt cotton. However, the total number of isolates with a circular shape, white and pale-yellow colour, dull appearance, raised and filamentous elevation, Gram +ve stain, and spore formation were found to be comparatively high in the rhizosphere of Bt cotton. The number of isolates with light-yellow, red and pink colour, shiny appearance, convex elevation, and Gram -ve stain were found to be comparatively low in the rhizosphere of Bt cotton. No significant effect of Bt cotton was observed on the biochemical characteristics including catalase, pyruvate, indole and hydrogen sulfide production and glucose, sucrose, and maltose fermentation of the rhizobacteria. However, the number of isolates showing positive response towards the production of oxidase and gelatinase, reduction of nitrate, and fermentation of lactose and mannitol were found higher in the rhizosphere of Bt cotton as compared to that of non-Bt cotton. The number of isolates showing positive response towards the production of urease, amylase, pyruvate, and lactate, utilization of citrate, and fermentation of fructose was comparatively lower in the rhizosphere of Bt cotton. These variations in morphological and biochemical characteristics of bacterial isolates from RBtC and RNBtC may be attributed to some potential effects of Bt cotton on the rhizoflora. The present results for biochemical characteristics are in agreement with those reported earlier [Citation46,Citation47].
The observed phenotypic variations in morphology and biochemical characteristics of the bacteria was correlated with their molecular characteristics by performing electrophoresis and sequencing of the 16S ribosomal RNA gene. The phylogenetic tree of the bacterial species showed that Bacillus was found to be the most prevalent genus among the identified genera from bacterial isolates with a comparatively higher percentage in the rhizosphere of Bt cotton (92%) than that of non-Bt cotton (88%). Bacillus cereus was found to be the most prevalent species among the identified Bacillus species with a lower percentage in the rhizosphere of Bt cotton (33%) than that of non-Bt cotton (39%). It is well known that Bacillus spp. consist of a diverse cluster of bacteria that are extensively dispersed in soil besides aquatic environments [Citation48] and are main soil inhabitants because of resistant-endospore besides essential antibiotics production which ensures their long-term survival in surroundings [Citation49]. Serratia marcescens was the less (6, 10%) while P. monteilii and P. plecoqlossicida were the least (2%) prevailing species among the identified species from the rhizosphere of non-Bt and Bt cotton (Figure a and b). The predominant prevalence of B. cereus over other species in the rhizosphere may be attributed to the idea that B. cereus produces antagonistic compounds that suppress the populations of other species [Citation50]. The presence of B. vietnamiensis, B. drentensis, B. anthrasis, Lysinibacillus macroides, and P. monteilii in RBtC but not in RNBtC indicate the positive effect of Bt cotton while the absence of B. flexus, B. aryabhattai and B. tequilensis, and P. plecoglossicida justifies its negative effect on the rhizoflora.
Previously, it has been reported that Bt cotton releases some toxins that significantly affect the microbial population in the soil [Citation15]. The present study supports the previous concept and suggests a significant impact of Bt cotton on the bacterial population and its characteristics. Although a nonsignificant variation was observed in the soil parameters of RBtC and RNBtC yet the bacterial population in Bt cotton rhizosphere was significantly affect that may be attributed to the effect of Bt toxins. However, the relative variability in soil parameters may be due to some indigenous characteristics of rhizospheres. The findings were supported by the electrophoretic patterns and sequencing of16S rRNA gene of the bacterial isolates obtained from RBtC and RNBtC.
5. Conclusions
In conclusion, the studied parameters of pre-plant soil and rhizosphere of Bt and non-Bt cotton were found to be statistically similar. The soil parameters including CC, EC, OM, TN, AP, and AK showed a significant positive effect while pH showed a significant negative effect on the bacterial population in each of the soil types. Bt cotton showed a nonsignificant effect on the soil parameters but a significant effect on the bacterial population in its rhizosphere. Bt cotton showed some comparative variations in the morphological and biochemical characteristics of its bacteria obtained from non-Bt cotton rhizosphere. However, the bacteria isolated from RBtC were found deficient in some bacterial species including B. flexus, B. aryabhattai and B. tequilensis, and P. plecoqlossicida suggesting the toxic effect of Bt cotton on its rhizobacteria. The bacterial isolates from RBtC also showed the presence of some additional species such as B. vietnamiensis, B. drentensis, B. anthrasis, Lysinibacillus macroides, and P. monteilii indicating the positive effect of Bt cotton on its rhizoflora.
Acknowledgements
The authors are grateful to the Institute of Chemical Sciences, Bahauddin Zakariya University Multan, Central Cotton Research Institute, Multan, Department of Biochemistry and Biotechnology, Islamia University, Bahawalpur, and Pakistan Health Research Council, Nishtar Medical University, Multan, Pakistan for providing research facilities.
Disclosure statement
No potential conflict of interest was reported by the authors.
References
- Ahmad F, Ahmad I, Khan M. Screening of free-living rhizospheric bacteria for their multiple plant growth-promoting activities. Microbiol Res. 2008;163:173–181. doi: 10.1016/j.micres.2006.04.001
- Radhakrishnan R, Hashem A, Abd_Allah EF. Bacillus: a biological tool for crop improvement through bio-molecular changes in adverse environments. Front Physiol. 2017;8:667. doi: 10.3389/fphys.2017.00667
- Beneduzi A, Ambrosini A, Passaglia LM. Plant growth-promoting rhizobacteria (PGPR): their potential as antagonists and biocontrol agents. Genet Mol Biol. 2012;35:1044–1051. doi: 10.1590/S1415-47572012000600020
- Brimecombe MJ, De Leij FA, Lynch JM. The effect of root exudates on rhizosphere microbial populations. In: Pinton R, Varaninin Z, Nannipieri P, editors. The rhizosphere: biochemistry and organic substances at the soil-plant interface. New York (NY): Marcel Dekker; 2000. p. 95–140.
- Hartmann A, Rothballer M, Schmid M. Lorenz hiltner, a pioneer in rhizosphere microbial ecology and soil bacteriology research. Plant Soil. 2008;312:7–14. doi: 10.1007/s11104-007-9514-z
- Marschner P. The ecophysiology of plant-phosphorus interactions. Dordrecht: Springer; 2008.
- Hashem A, Tabassum B, Fathi Abd_Allah E. Bacillus subtilis: a plant-growth promoting rhizobacterium that also impacts biotic stress. Saudi J Biol Sci. 2019;26:1291–1297. doi: 10.1016/j.sjbs.2019.05.004
- Vejan P, Abdullah R, Khadiran T, et al. Role of plant growth promoting rhizobacteria in agricultural sustainability—a review. Molecules. 2016;21:573. doi: 10.3390/molecules21050573
- Yaqoob A, Shahid AA, Salisu IB, et al. Effects of cry toxins on non-target soil bacteria during a 2-year follow up study. Span J Agr Res. 2019;17:303.
- Pindi P, Sultana T. Bacterial and fungal diversity in rhizosphere soils of Bt and non-Bt cotton in natural systems. Bulg J Agr Sci. 2013;19:1306–1310.
- Velmourougane K, Sahu A. Impact of transgenic cottons expressing cry1ac on soil biological attributes. Plant Soil Environ. 2013;59:108–114. doi: 10.17221/616/2012-PSE
- Sujatha T, Raagini PS, Vijayalakshmi K. A study on quantity of Bt toxin in Bt and nbt cotton rhizosphere. Eur Sci J. 2015;11:226–232.
- Castaldini M, Turrini A, Sbrana C, et al. Impact of bt corn on rhizospheric and soil eubacterial communities and on beneficial mycorrhizal symbiosis in experimental microcosms. Appl Environ Microbiol. 2005;71:6719–6729. doi: 10.1128/AEM.71.11.6719-6729.2005
- Tapp H, Stotzky G. Insecticidal activity of the toxins from Bacillus thuringiensis subspecies kurstaki and tenebrionis adsorbed and bound on pure and soil clays. Appl Environ Microbiol. 1995;61:1786–1790. doi: 10.1128/AEM.61.5.1786-1790.1995
- Tarafdar JC, Rathore I, Shiva V. Effect of bt-transgenic cotton on soil biological health. Appl Biol Res. 2012;14:15–23.
- Sarkar B, Patra AK, Purakayastha T, et al. Assessment of biological and biochemical indicators in soil under transgenic bt and non-bt cotton crop in a sub-tropical environment. Environ Monit Assess. 2009;156:595–604. doi: 10.1007/s10661-008-0508-y
- Hu H, Xie M, Yu Y, et al. Transgenic bt cotton tissues have no apparent impact on soil microorganisms. Plant Soil Environ. 2013;59:366–371. doi: 10.17221/213/2013-PSE
- Beura K, Rakshit A. Effect of bt cotton on nutrient dynamics under varied soil type. Ital J Agron. 2011;6:35. doi: 10.4081/ija.2011.e35
- Wang H, Wang G, Huang Y, et al. The effects of ph change on the activities of enzymes in an acid soil. Ecol Environ. 2008;17:2401–2406.
- Singh RJ, Ahlawat I, Singh S. Effects of transgenic bt cotton on soil fertility and biology under field conditions in subtropical inceptisol. Environ Monit Assess. 2013;185:485–495. doi: 10.1007/s10661-012-2569-1
- Icoz I, Stotzky G. Fate and effects of insect-resistant bt crops in soil ecosystems. Soil Biol Biochem. 2008;40:559–586. doi: 10.1016/j.soilbio.2007.11.002
- Yasin S, Asghar HN, Ahmad F, et al. Impact of bt-cotton on soil microbiological and biochemical attributes. Plant Prod Sci. 2016;19:458–467. doi: 10.1080/1343943X.2016.1185637
- Chelabi H, Khiari L, Gallichand J, et al. Soil sample preparation techniques on routine analyses in quebec affect lime and fertilizer recommendations. Can J Soil Sci. 2016;96:244–255. doi: 10.1139/cjss-2015-0062
- Barea J-M, Pozo MJ, Azcon R, et al. Microbial co-operation in the rhizosphere. J Exp Bot. 2005;56:1761–1778. doi: 10.1093/jxb/eri197
- Bouyoucos GJ. Hydrometer method improved for making particle size analyses of soils. Agron J. 1962;54:464–465. doi: 10.2134/agronj1962.00021962005400050028x
- McKeague JA. Manual on soil sampling and methods of analysis. 2nd ed. Ottawa: Canadian Society of Soil Science; 1978.
- Walkley A, Black IA. An examination of the degtjareff method for determining soil organic matter, and a proposed modification of the chromic acid titration method. Soil Sci. 1934;37:29–38. doi: 10.1097/00010694-193401000-00003
- Buresh R, Austin E, Craswell E. Analytical methods in 15 n research. Fertilizer Research. 1982;3:37–62. doi: 10.1007/BF01063408
- Olsen SR. Estimation of available phosphorus in soils by extraction with sodium bicarbonate. US Dep Agric Circ. 1954;939:1–19.
- Jackson ML. Soil chemical analysis. Englewood Cliffs (NJ): Prentice Hall; 1958.
- James G. Native Sherman Rockland Community College, State University of New York. New York (NY): The Benjamin/Coming Publishing Company; 1978.
- Cappuccino JG, Welsh CT. Microbiology: a laboratory manual. San Francisco (CA): Pearson Education; 2017.
- Aneja K. Laboratory manual of microbiology and biotechnology. 1st ed. New Delhi: MedTech Scientific International PVT. Ltd.; 2014.
- Porteous LA, Armstrong JL. A simple mini-method to extract DNA directly from soil for use with polymerase chain reaction amplification. Curr Microbiol. 1993;27:115–118. doi: 10.1007/BF01570868
- Altschul SF, Madden TL, Schäffer AA, et al. Gapped blast and psi-blast: a new generation of protein database search programs. Nucleic Acids Res. 1997;25:3389–3402. doi: 10.1093/nar/25.17.3389
- Kumar S, Stecher G, Tamura K. Mega7: molecular evolutionary genetics analysis version 7.0 for bigger datasets. Mol Biol Evol. 2016;33:1870–1874. doi: 10.1093/molbev/msw054
- Saitou N, Nei M. The neighbor-joining method: a new method for reconstructing phylogenetic trees. Mol Biol Evol. 1987;4:406–425.
- Felsenstein J. Confidence limits on phylogenies: an approach using the bootstrap. Evolution. 1985;39:783–791. doi: 10.1111/j.1558-5646.1985.tb00420.x
- Nei M, Kumar S. Molecular evolution and phylogenetics. New York (NY): Oxford University Press; 2000.
- Dou F, Soriano J, Tabien RE, et al. Soil texture and cultivar effects on rice (Oryza sativa l.) grain yield, yield components and water productivity in three water regimes. PLoS One. 2016;11(3):e0150549. doi: 10.1371/journal.pone.0150549
- Kang SC, Ha CG, Lee TG, et al. Solubilization of insoluble inorganic phosphates by a soil-inhabiting fungus fomitopsis sp. Ps 102. Curr Sci. 2002;82(4):439–442.
- Meena V, Maurya B, Bahadur I. Potassium solubilization by bacterial strain in waste mica. Bangladesh J Bot. 2014;43:235–237. doi: 10.3329/bjb.v43i2.21680
- Eriksson AK, Gustafsson JP, Hesterberg D. Phosphorus speciation of clay fractions from long-term fertility experiments in Sweden. Geoderma. 2015;241:68–74. doi: 10.1016/j.geoderma.2014.10.023
- Jacoby R, Peukert M, Succurro A, et al. The role of soil microorganisms in plant mineral nutrition-current knowledge and future directions. Front Plant Sci. 2017;8:1617–1617. doi: 10.3389/fpls.2017.01617
- Song W, Tong X, Liu Y, et al. Microbial community, newly sequestered soil organic carbon, and δ15n variations driven by tree roots. Front Microbiol. 2020;11:314. doi: 10.3389/fmicb.2020.00314
- Silva PD, Nahas E. Bacterial diversity in soil in response to different plans, phosphate fertilizers and liming. Braz J Microbiol. 2002;33:304–310.
- Iwase T, Tajima A, Sugimoto S, et al. A simple assay for measuring catalase activity: a visual approach. Sci Rep. 2013;3:3081. doi: 10.1038/srep03081
- Parvathi A, Krishna K, Jose J, et al. Biochemical and molecular characterization of Bacillus pumilus isolated from coastal environment in Cochin, India. Braz J Microbiol. 2009;40:269–275. doi: 10.1590/S1517-83822009000200012
- Amin M, Rakhisi Z, Ahmady AZ. Isolation and identification of Bacillus species from soil and evaluation of their antibacterial properties. Avicenna J Clin Microbiol Infec. 2015;2:e23233. doi: 10.17795/ajcmi-23233
- Li F-X, Ma H-Q, Liu J, et al. Antagonistic effects of Bacillus cereus strain b-02 on morphology, ultrastructure and cytophysiology of Botrytis cinerea. Pol J Microbiol. 2012;61:233–236. doi: 10.33073/pjm-2012-015