
 ?Mathematical formulae have been encoded as MathML and are displayed in this HTML version using MathJax in order to improve their display. Uncheck the box to turn MathJax off. This feature requires Javascript. Click on a formula to zoom.
Abstract
2D nanomaterial phosphorene is a chemistically stable, biocompatible, and biodegradable drug delivery platform. This study investigates the drug loading efficiency of phosphorene for the cardiovascular drug carvedilol using density-functional theory (DFT). In the gas phase, carvedilol prefers to interact with phosphorene via P-H bonding with an adsorption energy of 0.59 eV (0.45 eV in water). The complex HOMO–LUMO energy gap has been calculated in gas and solvent media to assess phosphorene-carvedilol reactivity. As compared to free carvedilol and phosphorene, the phosphorene-carvedilol complex has increased solubility. The NCI analysis visualises non-covalent interactions within complexes. The low Van der Waals interactions between carvedilol and phosphorene allow for easy drug offloading. The phosphorene-carvedilol complex is more soluble in water than previously thought. Phosphorene's electron density changes significantly after complex formation, as revealed by charge decomposition plots and electron-localization function plots. PET (photo-induced electron transfer) analysis explains quenching.
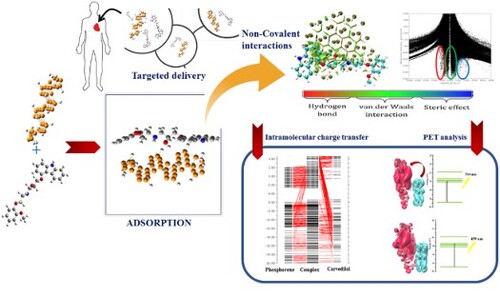
GRAPHICAL ABSTRACT
1. Introduction
Globally, cardiovascular diseases (CVDs) become a massive economical and medical burden, so these should not be left untreated as they lead to heart failure [Citation1]. According to the World Heart Federation report, CVDs are responsible for 17.3 million deaths per year, and this figure is anticipated to rise in upcoming years [Citation2,Citation3]. In 2017, approximately 17.8 million individuals have died worldwide due to CVDs, and it is expected that 23.6 million people will die by 2030 due to CVDs [Citation4,Citation5]. Various chemical entities or therapeutic formulations have been formulated to face these pressing issues to give timely treatment. However, several new drugs failed in their therapeutic potential due to their low water solubility, poor systemic bioavailability, cytotoxicity, lack of specificity, low permeability, poor shelf half-life, and poor biopharmaceutical properties [Citation6]. These issues emerged particularly when drug exposure and medical science moved from wet science to combinatorial science.
Conventional drug delivery approaches pose several issues, including low precision, potential toxicity, and drug resistance [Citation7]. In the realm of biomedicine, drug delivery is empowered by nanotechnology [Citation8]. In the present scenario, “Nanotechnology”, a rapidly developing science, offers multiple benefits by introducing nanocarriers. These nano-sized particles have shown great excellence indrug delivery, bio-imaging, gene therapy, bio-sensing, and tissue engineering. Furthermore, their physio-chemical properties can be tailored by varying their sizes, shapes, compositions, and surface properties [Citation9]. They exhibit remarkable structural [Citation10], chemical [Citation11], mechanical [Citation12], magnetic [Citation13], electrical [Citation14], and biological characteristics due to large surface areas [Citation15]. Nanocarriers deliver with immense success at the targeted location, while improving therapeutic index and minimizing adverse effects [Citation16]. This revolutionary development of nano-vehicles improves the pharmacokinetic profiles of drugs.
Various low-dimensional nanomaterials have been reported in the literature which serve as excellent drug delivery vehicles [Citation17,Citation18]. Hossain et al. theoretically scrutinized the adsorption potential of an active anti-protozoal medication "Metronidazole" on various nanocomposite surfaces (i.e. graphene, (BN) boron nitride and (BC) boron carbide) employing DFT and QTAIM approaches, and claimed that boron nitride nanosheet could be a promising platform for the delivery of metronidazole drug and minimalize the side effects associated with the drug [Citation19]. The same group of researchers reported the suitability of functionalized-boron nitride (BN)-based drug delivery system as viable candidate for favipiravir delivery engaging DFT calculations [Citation20]. Quantum mechanical studies were conducted by different research groups to explore theoretical aspects of fullerene-like nanocages i.e. C24, C60, C48, and boron nanocluster i.e. B35, B12N12, and B12C6N6 as efficient nano-vehicles for different anticancer drugs and in gas-sensing applications [Citation21–26]. Recently, Shahabi and coworkers studied the effectiveness of graphyne-3 (GY-3) and graphdiyne (GDY) as drug delivery systems for Idarubicin drug, implementing MD (molecular dynamics) simulation in conjunction with DFT approaches [Citation27]. Their findings revealed that Graphyne’s family members could deliver Idarubicin drug at intended sites without altering the bio-activity of this drug and exhibit a great promise in cancer treatment.
In corresponding to the usage of new advances, colossal information has been gathered on natural variables, such as carriers, processing chemicals, and efflux frameworks. Next-generation nanostructures, 2D nanomaterials, such as graphene [Citation28], molybdenum disulphide [Citation29], tungsten disulphide [Citation30], and graphdiyne [Citation31,Citation32] stand out as ideal candidates, depicting highly directional physio-chemical characteristics. The success of these 2D nanomaterials has driven material scientists to investigate other 2D-layered materials. In that line of 2D nanomaterials, “phosphorene” (black phosphorous), a stable allotropic form of phosphorus, has revolutionized the landscape of many scientific and technological research areas due to its extraordinary properties [Citation33,Citation34]. Although phosphorene was experimentally fabricated in 1914 by P.W Bridgman from red phosphorous under high temperature and pressure conditions, it remained unnoticed for almost a century [Citation35]. Phosphorene got recognition in 2014 when it was rediscovered by mechanical exfoliation from bulk black phosphorus (BP) into BP nanosheets and nanoribbons in the same way graphene was synthesized from bulk graphite by the scotch-tape method [Citation36]. Phosphorene is a new graphene due to the state-of-the-art in many fields. Unlike graphene, it possesses a layer-dependent energy gap. The experimentally predicted band-gap ranging from 0.3 eV value in bulk crystal to 2.05 eV in case of few layers [Citation37,Citation38].
The prime impetus to choose phosphorene as a drug carrier in the present review is its unique combination of properties, such as ultra-high surface area, absence of toxic metal element, adjustable bandgap, biocompatibility, excellent biosafety, and a wide-range absorption in UV (ultraviolet)–visible and (NIR) near infra-red region [Citation39–41]. The ultra-high surface area of this metal-free nanomaterial is due to its honeycomb (wrinkled) structure, which ensures efficient drug-loading capacity [Citation42]. Moreover, higher electron mobility and anisotropic behaviour make phosphorene a promising material in optoelectronic fields, water purification, field-effective transistors, and sensing applications [Citation43–48]. Black phosphorous (BP) also demonstrates excellent photothermal conversion behaviour and broad absorption within UV–Vis–NIR region [Citation49]. Phosphorous is extremely harmful in its elemental form and can damage tissue cells; however, phosphorene (BP nanosheets) releases non-toxic intermediates, such as phosphate and phosphonate upon biodegradation. These substances are physiologically friendly, causing no damage to kidneys [Citation41,Citation50]. Hence, phosphorene is innocuous and a safer biomedical material for disease diagnosis and biosensing [Citation51,Citation52]. Phosphorene, being biocompatible and biodegradable, exhibits intriguing potential in numerous fields, such as drug delivery, tissue engineering, bone regeneration, gene therapy, and cell imaging [Citation53–56]. Phosphorene captures drug molecules by loading chemical entities into nanocavities by the weak force of attraction. These weak forces enable easy offloading of drugs at targeted locations.
Cardiovascular drugs or medications are among the most extensively used drugs in the medical field. In cardiovascular drugs, a third-generation non-cardio selective β-blocker; “Carvedilol drug”, has become a favourable lead in the treatment of IHD (ischaemic heart disease), arrhythmias, hypertension and congestive heart failure [Citation57–59]. The drug fits in BCS (bio-pharmaceutical classification system) class ΙΙ (low solubility and high permeability) system [Citation60]. A major vault for this drug to achieve therapeutic excellence is its poor solubility (6–8 μg/ml), and poor bioavailability (25%) as its active ingredients are unable to dissociate properly. Hence, the activity of the drug is unelaborated at the intended site [Citation61]. A drug should have better aqueous solubility at the absorption site in order to gain better access to circulation channels. Erratic drug absorption leads to poor bioavailability because of undergoing hepatic first-pass metabolism [Citation62]. If we overcome this hurdle of carvedilol, it will be a huge success in the medical field. In this regard, considerable efforts are being made to introduce nanoscale carriers to enhance the clinical potential of carvedilol and minimize adverse effects associated with its delivery [Citation63]. To explore therapeutic efficacy of phosphorene as drug-delivery carrier for carvedilol, DFT (density-functional theory) and TD (time-dependent)-DFT computations were performed comprehensively.
2. Computational details
All the required theoretical computations are done applying the DFT (density functional theory) approach [Citation64] in Gaussian 09 package [Citation65]. Ground-state molecular geometry optimizations of carvedilol drug and phosphorene carrier are accomplished using B3LYP hybrid functional with 6-31G** level of DFT. B3LYP/6-31G** theory level provides reliable results and has a low computational cost [Citation57,Citation66]. Moreover, it is an excellent choice for accurately estimating electronic properties and molecular geometries. Previous reports suggested that it performs reasonably well for molecular adsorption studies [Citation67–69]. Different attainable orientations of the drug on phosphorene carriers are optimized to procure the most stable structure of carvedilol on phosphorene. TD-DFT (Time dependent-DFT), along with TD-B3LYP/6-31G** basis set, is applied for excited-state calculations [Citation70]. Adsorption energy is forecasted to realize interactions between different complex-forming components (i.e. carrier and drug). The strength of adsorption energies (Eads) is calculated using the following mathematical equation [Citation71,Citation72]:
(1)
(1) where EPhosphorene-Carvedilol indicates calculated DFT energy of complex. EPhosphorene and ECarvedilol are the energies of carvedilol and phosphorene, respectively. The term EBSSE represents the basis-set superposition error calculated to exclude the basis-function overlap effect. The standard counterpoise method [Citation73] is used to calculate BSSE energy. Furthermore, the structural stability of phosphorene carrier is evaluated by estimating formation energy (Eformation) using the following equation [Citation74–76]:
(2)
(2) where
reperesents the total energy of formation, EPhosphorene represents the total energy of phosphorene. The terms E(P) and E(H) signify the energy of solitary hydrogen and phosphorous atom, respectively. “n” denotes the total number of atoms in complex, while “x” and “y” stand for total count of phosphorous and hydrogen atoms in phosphorene sheet.
To explicitly treat the effect of solvent on phosphorene-carvedilol interactions, IEFPCM (Integral equation formalism-PCM model has been applied [Citation77]. Being an essential part of the living system, water has been chosen as a solvent to study the solubility and stability of the complex. The stability and solubility of the phosphorene carvedilol complex can be computed using the following expression [Citation78]:
(3)
(3) ΔESolvation denotes system’s total solvation energy, while Egas and ESol stand for energy in gas and solvent media, respectively. Some important factors, like dipole moment (μ), quantum reactivity parameters and HOMO–LUMO energies are considered in solvent as well as in gas media for carvedilol, phosphorene, and complex, which provide information about their preferences for reactivity in both phases [Citation79]. Electron localization function (ELF) is performed to visualize electron–density changes within carrier (phosphorene) prior to and after complex formation [Citation80,Citation81]. CDA analysis is performed to map out the donor–acceptor interactions and splitting the ligand field for the complex. Mechanisms, such as charge donation and charge separation within the complex molecule, are also investigated by the CDA analysis [Citation82,Citation83]. The natural bond orbital [Citation84] investigation is done by using NBO calculations. The NBO analysis accounts for the inter and intramolecular interactions in complex molecules and redistribution of electrons within various orbitals. The charge transfer from carvedilol to phosphorene molecule and from phosphorene to carvedilol molecule and electronic transitions within phosphorene itself is ensured through NBO calculations [Citation85,Citation86]. The UV–Visible spectra of drug, carrier and complex are plotted using theTD-DFT approach, and are analyzed via Swizard program [Citation87]. The strength of non-covalent interactions between carrier and drug are envisaged throuhg NCI analysis in three-dimensional space. The Photo-induced electron transfer and charge analysis is performed using afore-mentioned functional of DFT.
3. Results and discussion
3.1. Molecular geometry optimization
Firstly, ground-state geometries of drug (carvedilol), carrier (phosphorene), and complex (phosphorene–carvedilol) are optimized applying B3LYP/6-31G(d.p) functional as depicted in Figure . The optimized structure of the complex illustrates the P–H interaction between the carvedilol drug and the phosphorene carrier. This non-bonding interaction demonstrates that drug moleculeserves as a contributor to hydrogen bonding, when adsorbed onto the surface of the carrier. One P–H interaction appears during complex formation. One proton from an aromatic drug ring interacts with the phosphorous atom of phosphorene with an interaction distance of 2.79 Å. The dipole moment calculated for optimized phosphorene carrier is insignificant. The increment in dipole moment of 1.38 Debye after complex formation (phosphorene–carvedilol) improves the solubility of phosphorene–carvedilol complex in polar sovents, facilitating active drug movements through the systemic circulation.
Figure 1. Front and lateral views of optimized structures. (A) Carvedilol. (B) Phosphorene. (C) Phosphorene–carvedilol complex.
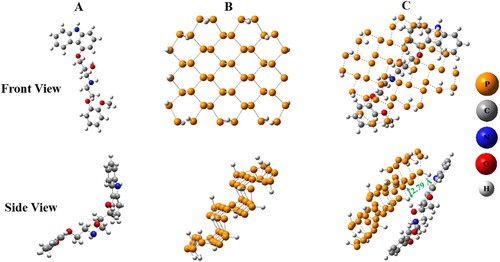
The adsorption energy is computed using Eq. (1) to gain insight about adsorption mechanism. In gas phase, BSSE counterpoise-corrected adsorpyion energy (Eads) for phosphorene–carvedilol complex is computed to be −0.59 eV (−0.45 eV in water). The negative Eads value for phosphorene–carvedilol complex signifies that complex formation is an exothermic and thermo-dynamically favoured process. It also indicates the stability of complex and spontaneous adsorption of carvedilol on the phosphorene surface. The more the negative value of the Eads, the stronger the adsorption between the drug and carrier molecule. However, in this case, the adsorption is not so strong as the drug develops non-covalent interactions with the phosphorene molecule (i.e. P–H bond), which facilitates drug desorption at the targeted site. The formation energy of phosphorene is – 3.36 eV/atom, the negative value of
indicates the sufficient stability of the phosphorene carrier (Table ).
Table 1. Calculated HOMO/LUMO energies, Eg (band gap) along with λmax wavelength of maximum absorption of phosphorene carrier, carvedilol drug, and the phosphorene-carvedilol complex in gaseous phase using B3LYP/6-31G** basic set.
3.2. Frontier molecular orbital (HOMO and LUMO) analysis
FMO (frontier molecular orbitals) analysis provides valuable information about UV–visible spectrum, opto-electronic properties, and reactivity parameters of the molecule [Citation88]. The HOMO (highest-occupied molecular orbital) behaves as an electron contributor or nucleophile, while LUMO (lowest-unoccupied molecular orbital) has electrin-accepting ability or electrophilic nature. The HOMO and LUMO characterize charge distribution within the molecule. The charge transfer from HOMO to LUMO corresponds to the change in energy gap (Eg) that enables to compute chemical reactivity, polarizability, and reaction stability [Citation89,Citation90]. A molecule with a small energy band gap has high polarizability, which increases chemical reactivity and reduces kinetic stability. These characteristics make the molecule soft. [Citation91]. Figure represents the HOMO and LUMO of carvedilol, phosphorene, and phosphorene–carvedilol complex. In carvedilol, LUMO is mainly distributed at the carbazole end of the molecule, whereas the electron density of HOMO is concentrated not only at the carbazole end but also on the nitrogen and hydroxyl group of molecules. The electron density of HOMO and LUMO of phosphorene, is uniformly distributed on the entire structure. An inclusive density separation is observed in phosphorene-carvedilol complex with charge density distribution of HOMO on carvedilol and LUMO on phodphorene. This density distribution map represents the transfer of charge between the carrier and drug. Moreover, it also confirms that carvedilol acts as an electron-donating group, while phosphorene contributes as an electron acceptor in the phosphorene–carvedilol complex (i.e. charge transition occurs from carvedilol towards phosphorene). Table summarizes HOMO/LUMO energies (EHOMO, ELOMO), band gaps (Eg), along with maximum absorption wavelengths in gas phase.
Figure 2. HOMO and LUMO electron density distribution map of phosphorene, carvedilol, and the phosphorene–carvedilol complex.
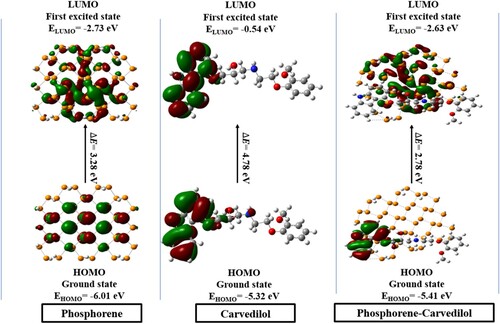
The EHOMO/ELUMO of carvedilol are found to be −5.32 eV and −0.54 eV, respectively, with Eg of 4.78 eV. The Eg value for phosphorene is 3.28 eV with EHOMO and ELUMO of −6.01 eV and −2.73 eV, respectively. The phosphorene–carvedilol complex has an energy gap of 2.78 eV, a much lower value than that of carvedilol (4.78 eV) and phosphorene (3.28 eV) which implys that the complex (phosphorene–carvedilol) requires less energy for excitation. The value of EHOMO of the phosphorene–carvedilol complex molecule (−5.41 eV) is nearly equal to EHOMO of carvedilol (−5.32 eV), whereas ELUMO (−2.63 eV) resembles ELUMO of phosphorene (−2.73 eV). Remarkably, this pattern is in good agreement with FMOs’ densities (i.e. highest occupied MO is confined on carvedilol, while the lowest unoccupied MO is situated on phosphorene in the complex). The phosphorene shows λmax at 438 nm, whereas the phosphorene–carvedilol complex shows an absorption peak at 440 nm (red-shifted by 2 nm). This red-shift in excitation wavelength (λmax) for the carvedilol–phosphorene complex is due to a smaller energy gap between LUMO and HOMO.
3.3. Non-covalent interaction and iso-surface analysis
The NCI analysis provides real-space visualization of non-covalent interactions within a complex structure. NCI scatter diagram can be used to characterize molecular regions with weak interactions and strong directional attractions. In the NCI plot, the type of interactions within the complex structure can be identified based on spikes that occur at low densities of RDG (reduced density gradient). The visual interpretation of the NCI scatter plot is shown in Figure . The scatter diagram has schemed between RDG and the sign of the second Hessian Eigenvalue (sin λ2 ρ), which gives a stiletto-heel shape.
Figure 3. Non-covalent interaction analysis of the phosphorene-carvedilol complex.
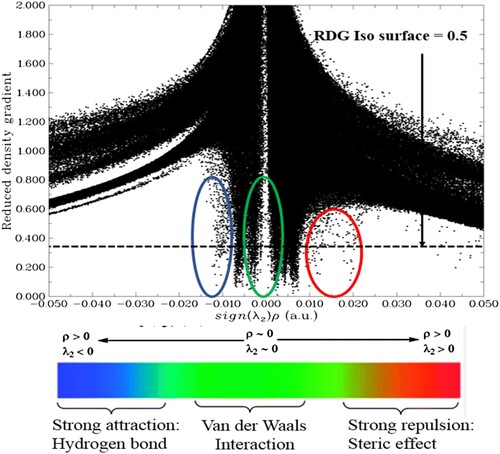
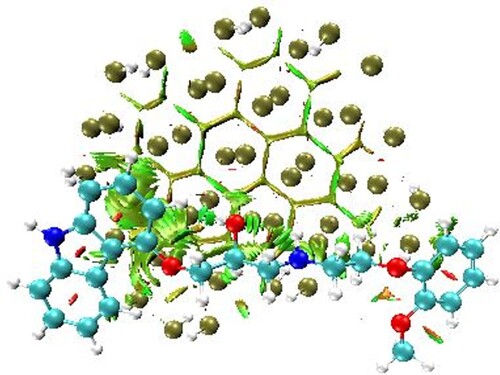
The sin of λ2(ρ) describes the nature and strength of chemical bonding and parameters related to local bonding in the complex. In the NCI plot, the value of λ2ρ > 0 signifies repulsive/steric hindrance, λ2ρ < 0 indicates hydrogen bonding and λ2ρ ≈ 0 signifies van-der Waals’ interactions between component fragments of complex [Citation92]. Interestingly, the scatter graph shows all types of NCIs within the phosphorene–carvedilol complex system. The weak van-der Waals’ interactions, hydrogen bonding, and steric interactions are distinguished by green, blue, and red colour codes. These weak interactions are very important in the case of drug delivery as they allow easy drug detachment from the carrier at the desired location. The 3D colour-filled iso-surface of phosphorene-carvedilol implemented in visual molecular dynamics (VMD) [Citation93] is depicted in Figure , where green patches show weak van-der Waals’ interactions between the carrier and drug.
Figure 4. 3D colour-filled iso-surface visualizing orbital overlapping between carvedilol and phosphorene in the phosphorene–carvedilol complex.
3.4. Charge decomposition analysis and density of state spectrum
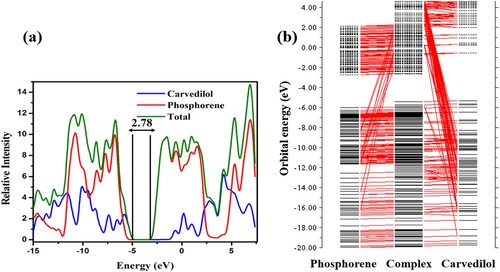
CDA (charge decomposition analysis) helps explain the charge transfer in molecular orbital (MO) energy levels and investigate donor–acceptor interactions [Citation82]. The intermixing of MOs of individual fragments generates new MO energy levels in a complex molecule. This addition results in the lowering of bandgap of the complex structure. The molecular orbital contribution from each fragment is confirmed by plotting the orbital interaction diagram for the phosphorene-carvedilol complex, as represented in Figure (b). The mixing of MO energy levels from each fragment (phosphorene and carvedilol) generates new MO energy levels in the phosphorene-carvedilol complex, contributing to an increase in EHOMO (−5.41 eV) and a decrease in ELUMO value (−2.63 eV) of the complex. Thus the gap between H–L of phosphorene-carvedilol complex is reduced (2.78 eV). The smaller band-gap of the complex enables intra-molecular charge transfer within the complex.The density of state (DOS) spectrum is plotted using PyMOlyze 1.1 software (Figure (a)). The DOS spectrum shows a good agreement with CDA results. The DOS spectrum revealed that the bandgap of the complex has been reduced (Eg = 2.78 eV) due to the intermixing of individual fragments’ orbitals. It is found from CDA and DOS results that the charge transfer process occurs between carvedilol and phosphorene.
Figure 5. (a) Density of state (DOS) spectrum of phosphorene, carvedilol, and the phosphorene-carvedilol complex (b) CDA of the phosphorene-carvedilol complex.
3.5. Chemical reactivity parameters
Chemical reactivity parameters can explain molecular stability, reactivity, and other electronic properties, like charge transfer and drug-carrier interactions. The chemical reactivity descriptors based on EHOMO and ELUMO values i.e. chemical potential, electrophilicity index, global hardness, and chemical softness were calculated for carvedilol (drug), phosphorene and phosphorene-carvedilol (complex) in gas phase using following formulas [Citation80,Citation94–99]:
(4)
(4)
(5)
(5)
In Eqs. (4) and (5), A represents electron affinity, and I signifies ionization energy and are estimated considering Koopman’s theorem (A = −LUMO, I = −HOMO) [Citation100] (Table ).
(6)
(6)
(7)
(7)
Table 2. Calculated reactivity parameters such as chemical potential (μ), chemical hardness (η), softness (s), electrophilicity (ω) of phosphorene carrier, carvedilol drug, and the phosphorene-carvedilol complex in the gaseous phase.
All computed results of chemical reactivity parameters are reported in Table .
Table 3. Chemical-reactivity descriptors, such as chemical potential, hardness, softness, electrophilicity index of carvedilol, phosphorene, and the phosphorene-carvedilol complex in the solvent phase.
Many interesting properties of the complex are reported. The chemical stability of a molecule correlates with hardness (η). The higher values of chemical hardness correspond to better stability, whereas molecules with low chemical hardness are more reactive. The η value of the complex is 1.39 eV, which is lower than that of carvedilol (η = 2.44 eV) and phosphorene carrier (η = 1.64 eV), which suggested that the complex has more reactivity. The higher chemical softness (0.72 eV−1) and lower chemical hardness (1.39 eV) values for the phosphorene-carvedilol complex revealed that the complex is softer than carvedilol and phosphorene. The electrophilicity index explains the ability of the molecular system to gain electrons [Citation101]. Complex (phosphorene-carvedilol) has high electrophilicity index (5.81 eV), indicating that it is a good electrophile. A comparatively low value of η (1.39 eV) with a high negative value of μ (−4.02 eV) means that the complex has high polarizability. The stability of the phosphorene-carvedilol complex is predicted by negative chemical potential.
3.6. ELF and NBO (natural bond orbital) analysis
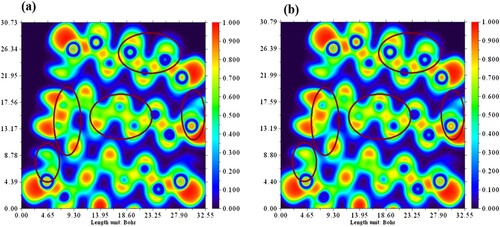
The electron density changes in the carrier after phosphorene-carvedilol complex formation can be interpreted by ELF plot. Figure (a) and 6(b) illustrates ELF (Electron localization function) plots for phosphorene carrier and phosphorene-carvedilol complex, respectively. The electron density of phosphorene has been considerably changed after forming a complex with carvedilol drug and can be seen in Figure . The ELF values based on kinetic energy density ranges from 0.0 to 1.0. ELF values ranging from 0.5 to 1.0 show regions in position space-occupying localized electrons (bonding and anti-bonding). The low range of ELF (0.0–0.5) represents regions containing delocalized electrons [Citation102]. From these ELF plots, we can also investigate transitions from carvedilol to phosphorene and vice versa in NBO analysis. Moreover, density changes in phosphorene after complex formation are also studied.
Figure 6. Electron density changes in electron localization function plot (a) phosphorene (b) phosphorene-carvedilol complex.
NBO (natural bond orbital) analysis based on second-order perturbation is used to evaluate inter-molecular interactions from donor to acceptor and provides an appropriate basis for investigating intramolecular charge transfer (ICT) within the molecular system. NBO analysis gives reliable information about interactions taking place in virtual as well as in filled orbital space [Citation103]. Higher the charge delocalization from donor NBO to acceptor NBO, higher will be the degree of conjugation which ensures complex stability.
The highest values of Perturbation energy for the carrier (phosphorene) and the phosphorene-carvedilol complex are depicted in Tables and , respectively, where the term E(j)-E(i) indicates energy dfference between donor (i) and acceptor (j) NBO orbitals and Fi,j is the off-diagonal Fock matrix element. NBO analysis disclosed that the interactions: π* C101–N102 → π *C99–N100 and π *C101–C102 → π * C97–C98 provide high stabilization to the complex system by 284.63 and 249.20 kJmol−1, respectively (). The overlapping between (bonding) and π* orbitals (anti-bonding) causes charge transfer (ICT), making the molecular system more polarized. A slight change has been observed in E2 values of the carrier before and after the complex formation process, and these energy changes resulting from internal transitions (charge delocalization) are listed in Table . The energy sustainability E2 (Table ) represents stabilizing interactions between the donor and acceptor.
Table 4. Some important charge transitions within phosphorene carrier.
Table 5. Some important charge transitions within phosphorene-carvedilol system.
Table 6. NBO calculations for carrier (phosphorene) prior to and after complex formation with carvedilol drug molecule and their respective E2 energies in kcal mol−1.
From the NBO analysis, the charge transfers from the phosphorene to carvedilol, carvedilol to phosphorene, and from the phosphorene to phosphorene itself can be predicted and comprehended with the aid of the ELF electron-density plots.
3.7. Solvent effect
The solvent effect is investigated to explain the solubility and stability of the complex. Water is the solvent of choice as it mimics a real biological environment. IEFPCM solvent model is applied to study the interactions between carvedilol drug and phosphorene carrier in the water phase [Citation77]. The adsorption energy (Eads) computed for complex water media is −0.45 eV. The adsorption energy with negative sign shows that adsorption is vigorously favourable and exothermic. When Eads of complex is compared in the water and gas phase, it has been found that the Eads value of complex in the water phase is less (−0.45 eV) than its corresponding value in the gaseous phase (−0.59 eV). However, this difference is insignificant, indicating the chemical stabilization of the complex in both phases. The solvation energies of carvedilol, phosphorene, and complex are also determined using Eq. (3). Solvation energy for carvedilol, phosphorene and phosphorene-carvedilol system are −0.45 eV, −0.86 eV, and −1.17 eV, respectively. All the negative solvation energies indicate a spontaneous solvation. It is inferred from the above data that the smaller value of solvation energy results in improved solubility of the complex in the aqueous phase in contrast to free carvedilol and phosphorene. Solvation studies also revealed that the solvent media i.e. water stabilizes the complex by decreasing its solvation energy.
The EHOMO, ELUMO, their energy band gaps (Eg), and chemical stability descriptors of phosphorene, the carvedilol drug, and the phosphorene-carvedilol complex are also calculated in the solvent (water) phase and are depicted in Tables and . The solvent phase analysis shows that HOMO–LUMO energies and Eg values of carvedilol, phosphorene, and the phosphorene-carvedilol complex are slightly changed in the presens of water. The increase in band-gap (2.83 eV) of phosphorene–carvedilol complex suggests that phosphorene–carvedilol complex is somewhat more reactive in water phase. It is also observed that by switching from the gas to the aqueous phase, the dipole moment of the complex (phosphorene-carvedilol) has been increased significantly. Dipole moment value observed in aqueous phase for the phosphorene–carvedilol complex is 2.04 D, while in gas phase, its value is 1.95 D. Greater dipole moment suggests more solubility of complex in water phase, which is useful for drug delivery in the biological environment. The negative chemical potential given in Tables and , indicates stabilization of phosphorene–carvedilol in both phases. The increment in hardness value of phosphorene-carvedilol complex (1.41 eV) and lower softness (0.70 eV) indicates that complex has more stability in water phase as compared to gas phase.
3.8. UV-Visible spectral analysis
TD-DFT method is employed to simulate UV-Visible spectra of phosphorene, carvedilol, and phosphorene–carvedilol complex within gas and solvent phase to investigate excited-state properties. The carvedilol-phosphorene system shows λmax at 440 nm providing broad absorption within UV-visible region when compared to carvedilol (λmax = 231 nm) as demonstrated in Figure (a).
Figure 7. UV-visible absorption spectra (a) gas-phase (b) solvent-phase.
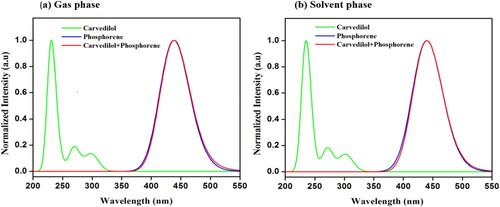
The maximum absorption peak for phosphorene is 438 nm (Table ). The solvent effect on the UV–Visible spectra of the complex, carvedilol drug, and phosphorene carrier is also investigated. λmax of phosphorene, carvedilol, and the phosphorene-carvedilol complex is listed in Table .
Table 7. HOMO and LUMO energies, Eg (band gap) along with λmax (maximun absorption wavelenth) of carvedilol drug, phosphorene carrier, and the phosphorene-carvedilol complex in the water (solvent) phase using B3LYP/6-31G** basic set.
3.9. Surface charge analysis
The effect of surface charge has been studied for the carrier and complex as it provides information about molecular and biological components [Citation104]. The optimized structures e.g. phosphorene and phosphorene-carvedilol in their cationic (+1) and anionic (−1) states, are analyzed. The variations in bond length associated wirth surface charge (+1/−1) of phosphorene (phosphorene+1/−1) and its corresponding complex with carvedilol (phosphorene+1-carvedilol and phosphorene−1-carvedilol) are shown in Figure . For bond length analysis, graphs are plotted between the bond index (number of bonds) and bond length. Bond length evaluation of phosphorene+1 (phosphorene with +1 charge state) showed that the bond lengths of P–P bonds are in the range of 2.22 Å–2.31 Å, and the P-H bond displays a range from 1.41 Å to 1.42 Å (Figure (a)). Similarly, phosphorene−1 (phosphorene with −1 charge state) shows P–P and P–H bonds with bond lengths from 2.21–2.30 Å and 1.41 Å–1.43 Å, respectively (Figure (b)). After the adsorption of carvedilol on the surface of phosphorene+1/−1, the subsequent phosphorene+1/−1-carvedilol complex showed less bond length dispersion respecting to phosphorene+1/−1 carrier, as demonstrated in Figure (c and d).
Figure 8. Computed bond lengths of (a) phosphorene+1 (b) phosphorene−1 (c) phosphorene+1 – carvedilol complex (d) and the phosphorene−1 – carvedilol complex.
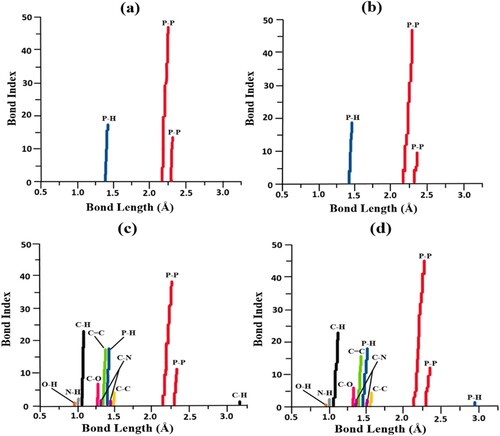
The bond-length analysis of complex in its cationic state (phosphorene+1-carvedilol) reveals that the bond lengths of P–P and P–H bonds are in the range of 2.23–2.30 Å and 1.41 –1.42 Å, respectively. Bond lengths for the C–H bond are at 1.08 and 3.27 Å. The bond length values that appear at approximately 0.97 and 1.01 Å are showing O–H and N–H bonds. The C–O bonds have bond lengths from 1.33 Å–1.44 Å. The ranges of bond distances for C–C, C–N, and C=C are 1.44–1.53 Å, 1.37–1.46 Å, and 1.38–1.43 Å, respectively. The optimized phosphorene−1-carvedilol-complex revealed that the bond lengths of P–P bonds fall within 2.21–2.33 Å range, while P–H bonds are seen around 1.41 Å and at 2.82 Å, respectively. The values observed at a range of 1.08–1.10 Å show bond distance (bond length) between C and H atoms. The bond length values that appear at approximately 0.97 and 1.01 Å show O-H and N-H bonds. The bond lengths from 1.36 Å to 1.44 Å represent C–O. The bond distances for C–C, C–N, and C=C are 1.44–1.52 Å, 1.38–1.45 Å, and 1.39–1.41 Å, respectively.
The spreading of charges has been analyzed by means of ADCH population method (Atomic-dipole moment-corrected Hirshfeld) [Citation105] to figure out problems accompanying poor dipole-moment reproducibility of Hirshfeld-charge. To realize the ADCH analysis, a graphical demonstration is shown in Figure for phosphorene+1/−1-carvedilol complexes with ADCH charge and atomic-index on the x and y-axis, respectively.
Figure 9. Graphical illustration of ADCH charges (a) phosphorene+1-carvedilol complex (b) phosphorene−1-carvedilol complex.
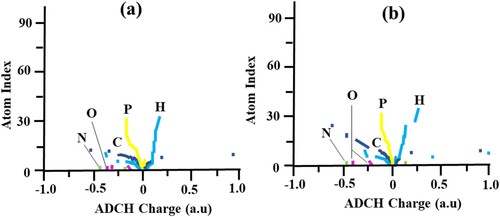
Complex having +1 state (Figure (a)) shows that phosphorous charge range fall within −0.001 a.u–0.02 a.u. Hydrogen in the complex bear ADCH charge range of 0.05 a.u to 1.13 a.u in the positive quadrant and −0.07 a.u to −0.22 a.u in the negative quadrant. Moreover, C atoms have a charge range from −0.02 a.u to 0.77 a.u. However, the other charge-carrying atoms like O and N maintain a −0.37 a.u and 0.77 a.u, respectively. In the case of phosphorene−1-carvedilol complex (Figure (b)), the value of the P are seen at +0.04 a.u and −0.11 a.u. The H, C, O, and N of the phosphorene−1-carvedilol complex having ADCH charge values of 0.30 a.u, 0.97 a.u, −0.35 a.u, and −0.43 a.u, respectively. The surface charge placement allows for identification of active spots or sites for chemical reactions. It also explicates the bond nature and their specific sites. The atomic charge calculated by ADCH analysis are considered more authentic [Citation104, Citation106].
3.10. PET analysis
PET (photo-induced electron transfer) based on electron/hole theory provides a better understanding of fluorescence quenching. Fluorescence quenching is useful to considerate drug-protein interaction nature and the accessibility of drug molecules to bind with protein. Electron/charge shift from chelator to fluorophore induces fluorescence quenching [Citation107]. This excitation occurs in the visible region as UV light poses potential damage to human body. The PET process is of great importance in biological systems as it can alter the dynamics of the photo-luminescence process (phosphorescence and fluorescence). The photo-induced electron transfer analysis helps in drug detection and monitoring [Citation108,Citation109]. PET phenomenon is observed for the phosphorene–carvedilol complex at different absorption wavelengths via the TD-DFT method. Figure shows electron–hole orbital diagrams for 1–5 excited states of the phosphorene-carvedilol complex. The distance between electron–hole orbitals (D), overlap integral (S), the wavelength of absorption (λmax), oscillator strength (F), and excitation energy for each state (1–5) is given in Table . The schematic illustration of energy-level diagrams for 1–5 excited states is also presented in Figure for the phosphorene-carvedilol complex.
Figure 10. Visual illustration of PET process for electron/hole orbitals for 1–5 states of the phosphorene–carvedilol complex.
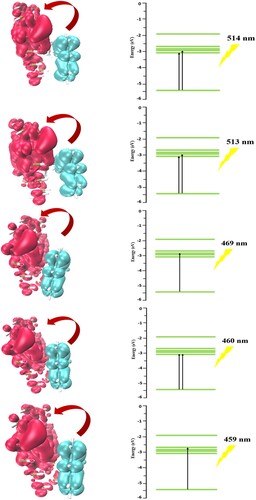
Table 8. Analysis of hole–electrons for first five excited states of phosphorene-carvedilol.
The energy-level diagrams for the first two excited states show two electronic transitions, ground state to LUMO+0 and LUMO+1 state. In 3rd excited state, only one transition occurs from the ground state to LUMO+2. Two electronic excitations are observed in 4th excited state from ground state to LUMO+0 state, while in 5th state, only one excitation (towards LUMO+3) is seen.
The absorption wavelengths observed for 1–5 states are 515, 513, 469, 460 and 459 nm, respectively. In Figure , MOs located on carvedilol drug and phosphorene carrier are characterized by blue and red colours, respectively. The D index is related to charge-transfer length, while S represents the charge-transfer rate between the hole and electron. The distances between electron–hole orbitals (D index) for 1–5 excited states are 6.88, 6.92, 6.51, 2.72 and 7.59, respectively. The high D values for the first five excited states show that charge-transfer length is longer. The low values of overlap integral (S) for 1–5 excited states i.e. 0.092, 0.085, 0.090, 0.527 and 0.081 indicate a high charge-transfer rate between the hole and electron.
In PET charge transfer has taken place from carvedilol which acts as a chelator to phosphorene, which functions as a fluorophore. This charge separation interprets that quenching takes place between electron–hole orbital within the fluorescence emission spectrum. For example, For LP (1) P3 → σ* P7–P9 excitation energy is increased after adsorption of carvedilol on phodphorene (2.93 kcal mol−1 to 2.96 kcal mol−1). Similarly, an increase in excitation energy is observed from 1.93 kcal mol−1 to 2.26 kcal mol−1 for σ *P21–P27 → σ *P27–P30.
3.11. Drug delivery to the target cell
The Eads of about −1.30 eV (−30 kcal mol−1) is found to be opt for carvedilol adsorption and its successful release at the target cell/tissue [Citation110], and our calculated Eads for the complex molecule is found to be less than 1 eV. The calculated adsorption energy value for the phosphorene–carvedilol complex (−0.59 eV) is moderate, which signifies the physisorption of the carvedilol drug onto the phosphorene sheet. The Eads indicate that the carvedilol drug molecule can be absorbed well by phosphorene, however, it is not strong enough to avoid offloading or desorption of carvedilol at targeted arena. Furthermore, the physio-sorption based on Van der Waal interactions gives rise to weak forces of the carvedilol molecule on the phosphorene surface. This physisorption of the carvedilol drug facilitates the drug-offloading at the target site.
4. Conclusion
The drug delivery capability of phosphorene for carvedilol (cardiovascular drug) has been evaluated by the DFT approach. Some important parameters of the carvedilol, phosphorene, and the phosphorene-carvedilol complex are investigated at the ground and the excited state configuration to explore the use of phosphorene in medicine (particularly in drug delivery). Adsorption properties showed that carvedilol is adsorbed to the phosphorene surface through the P–H interaction, where carvedilol acts as a donor for hydrogen bonding. The adsorption energy (Eads) calculated for the phosphorene-carvedilol complex is −0.59 eV, which suggests the spontaneous adsorption of carvedilol on phosphorene. The estimated formation energy for the phosphorene carrier with a negative sign, verifying sufficient structural stability of the considered phosphorene molecule. A significant increase in dipole moment (μ = 1.95 D) of the phosphorene-carvedilol complex compared to phosphorene carrier (μ = 0.57 D) indicates an increased solubility of the complex within polar solvents (water), which facilitates drug movement through the systemic circulation. Moreover, the decrease in solvation energy of the phosphorene-carvedilol complex in contrast to free carvedilol and phosphorene also reveals that the solubility of the complex is improved in the aqueous environment. The FMO analysis revealed that the HOMO of the phosphorene-carvedilol is located on carvedilol drug, while LUMO is localized entirely on the phosphorene molecule, which ensures charge transfer from carvedilol towards phosphorene. The non-covalent interactions between carvedilol and phosphorene are responsible for favourable drug release and help in targeted drug delivery. The charge decomposition analysis results explain that the HOMO–LUMO gap of complex decreases due to the maximum overlapping between fragments i.e. carvedilol and phosphorene orbitals resulting in intra-molecular charge shifting within the complex. The NBO analysis results ensure that internal transitions take place from carvedilol to phosphorene, from phosphorene to carvedilol, and within the carrier. The photo-induced electron-transfer analysis at different excited states suggests that fluorescence quenching phenomena occur. Surface charge analysis shows that phosphorene +1/−1 makes a stable complex with carvedilol. Our findings show that phosphorene holds considerable potential as a drug carrier, and it can be used as a favourable platform for carvedilol delivery. It is believed that this theoretical study will encourage researchers to explore other 2-D nanomaterials and investigate their potential in drug-delivery applications.
Acknowledgements
The authors like to acknowledge the technical support from Punjab Bio-energy Institute (PBI), University of Agriculture, Faisalabad (UAF). Authors are thankful to Govt. of the Punjab, Pakistan for the financial support. We also thank Dr. Khurshid Ayub, COMSATS University Islamabad, Pakistan for additional resources. We would like to thank Taif University Research Supporting Project number (TURSP-2020/63), Taif University, Taif, Saudi Arabia.
Disclosure statement
No potential conflict of interest was reported by the author(s).
Data availability statement
The data that support the findings of this study are available from the corresponding author [Javed Iqbal], upon reasonable request.
References
- Li C. Therapeutic advances in cardiac targeted drug delivery: from theory to practice. J Drug Target. 2020;29:1–14.
- Hao P. Traditional Chinese medicine for cardiovascular disease: evidence and potential mechanisms. J Am Coll Cardiol. 2017;69(24):2952–2966.
- Mathers CD, Loncar D. Projections of global mortality and burden of disease from 2002 to 2030. PLoS Med. 2006;3(11):e442.
- Roth GA. Global, regional, and national age-sex-specific mortality for 282 causes of death in 195 countries and territories, 1980–2017: a systematic analysis for the Global Burden of Disease Study 2017. Lancet. 2018;392(10159):1736–1788.
- Fuster V. Global burden of cardiovascular disease: time to implement feasible strategies and to monitor results. Washington, DC: American College of Cardiology Foundation; 2014.
- Kalepu S, Nekkanti V. Insoluble drug delivery strategies: review of recent advances and business prospects. Acta Pharm Sin B. 2015;5(5):442–453.
- Alam MS. Pharmaceutical product development exploiting 3D printing technology: conventional to novel drug delivery system. Curr Pharm Des. 2018;24(42):5029–5038.
- Patra JK. Nano based drug delivery systems: recent developments and future prospects. J Nanobiotechnol. 2018;16(1):1–33.
- Singh N. Drug delivery: advancements and challenges. In: Simon Holt, editor. Nanostructures for drug delivery. Elsevier; 2017. p. 865–886.
- Cursaru LM. The influence of synthesis parameters on structural and magnetic properties of iron oxide nanomaterials. Nanomaterials. 2020;10(1):85.
- Patil SP, Burungale VV. Physical and chemical properties of nanomaterials. In: Simon Holt, editor. Nanomedicines for breast cancer theranostics. Amsterdam: Elsevier; 2020. p. 17–31.
- Wu Q. Mechanical properties of nanomaterials: a review. Nanotechnol Rev. 2020;9(1):259–273.
- Mukherjee S, Liang L, Veiseh O. Recent advancements of magnetic nanomaterials in cancer therapy. Pharmaceutics. 2020;12(2):147.
- Ahmadi MH. Renewable energy harvesting with the application of nanotechnology: a review. Int J Energy Res. 2019;43(4):1387–1410.
- Priyadarsini S. Graphene and graphene oxide as nanomaterials for medicine and biology application. J Nanostruct Chem. 2018;8(2):123–137.
- Chamundeeswari M, Jeslin J, Verma ML. Nanocarriers for drug delivery applications. Environ Chem Lett. 2019;17(2):849–865.
- Rahman H, Hossain MR, Ferdous T. The recent advancement of low-dimensional nanostructured materials for drug delivery and drug sensing application: A brief review. J Mol Liq. 2020;320:114427.
- Shamim SUD. Theoretical investigation of emodin conjugated doped B12N12 nanocage by means of DFT, QTAIM and PCM analysis. Phys E. 2021;136:115027.
- Hossain MR. Adsorption behaviour of metronidazole drug molecule on the surface of hydrogenated graphene, boron nitride and boron carbide nanosheets in gaseous and aqueous medium: A comparative DFT and QTAIM insight. Phys E. 2021;126:114483.
- Hasan MM. The computational quantum mechanical investigation of the functionalized boron nitride nanocage as the smart carriers for favipiravir drug delivery: a DFT and QTAIM analysis. J Biomol Struct Dyn. 2021;39:1–17.
- Hossain MA. An ab initio study of the B35 boron nanocluster for application as atmospheric gas (NO, NO2, N2O, NH3) sensor. Chem Phys Lett. 2020;754:137701.
- Kamali F. Adsorption behavior of metformin drug on the C 60 and C 48 nanoclusters: a comparative DFT study. Monatshefte Chem Chem Monthly. 2020;151:711–720.
- Hossain MR. First-principles study of the adsorption of chlormethine anticancer drug on C24, B12N12 and B12C6N6 nanocages. Comput Theor Chem. 2021;1197:113156.
- Tomić BT. Fullerene C 24 as a potential carrier of ephedrine drug – a computational study of interactions and influence of temperature. Phys Chem Chem Phys. 2019;21(42):23329–23337.
- Hasan MM. A first-principles DFT study on the adsorption behaviour of CO. C(O2). and O3 on pristine B24N24 and silicon-decorated B24N24 nanosheet. Phosph Sulfur Silicon Relat Elem. 2021;47:1–8.
- Hossain MR. DFT and QTAIM investigations of the adsorption of chlormethine anticancer drug on the exterior surface of pristine and transition metal functionalized boron nitride fullerene. J Mol Liq. 2021;323:114627.
- Shahabi M, Raissi H. Two dimensional porous frameworks of graphyne family as therapeutic delivery vehicles for Idarubicin biomolecule in silico: density functional theory and molecular dynamics simulation. J Mol Liq. 2020;319:114334.
- Vovusha H. Binding characteristics of anticancer drug doxorubicin with two-dimensional graphene and graphene oxide: insights from density functional theory calculations and fluorescence spectroscopy. J Phys Chem C. 2018;122(36):21031–21038.
- Liang W, Luo X. Theoretical studies of MoS2 and phosphorene drug delivery for antituberculosis drugs. J Phys Chem C. 2020;124(15):8279–8287.
- Mohid SA. Application of tungsten disulfide quantum dot-conjugated antimicrobial peptides in bio-imaging and antimicrobial therapy. Colloids Surf B. 2019;176:360–370.
- Jin J. Graphdiyne nanosheet-based drug delivery platform for photothermal/chemotherapy combination treatment of cancer. ACS Appl Mater Interfaces. 2018;10(10):8436–8442.
- Khan S. First-principles study for exploring the adsorption behavior of G-series nerve agents on graphdyine surface. Comput Theor Chem. 2020;1191:113043.
- Dhanabalan SC. Emerging trends in phosphorene fabrication towards next generation devices. Adv Sci. 2017;4(6):1600305.
- Qiu M. Omnipotent phosphorene: a next-generation, two-dimensional nanoplatform for multidisciplinary biomedical applications. Chem Soc Rev. 2018;47(15):5588–5601.
- Bridgman P. Two new modifications of phosphorus. J Am Chem Soc. 1914;36(7):1344–1363.
- Khandelwal A. Phosphorene – the two-dimensional black phosphorous: properties, synthesis and applications. Mater Sci Eng B. 2017;221:17–34.
- Lu J. Light–matter interactions in phosphorene. Acc Chem Res. 2016;49(9):1806–1815.
- Liang L. Electronic bandgap and edge reconstruction in phosphorene materials. Nano Lett. 2014;14(11):6400–6406.
- Abate Y. Recent progress on stability and passivation of black phosphorus. Adv Mater. 2018;30(29):1704749.
- Zhang S. Semiconducting group 15 monolayers: a broad range of band gaps and high carrier mobilities. Angew Chem. 2016;128(5):1698–1701.
- Zhu Y. From phosphorus to phosphorene: applications in disease theranostics. Coord Chem Rev. 2021;446:214110.
- Xiong S. Black phosphorus as a versatile nanoplatform: from unique properties to biomedical applications. Available at SSRN 3464628, 2020.
- Saravanan S, Nagarajan V, Chandiramouli R. Zipper phosphorene as sensing element towards formaldehyde and acetaldehyde – a first-principles insight. J Mol Graph Modell. 2021;107:107971.
- Nagarajan V, Chandiramouli R. Interaction of propionate and ethylamine on Kagome phosphorene nanoribbons – a DFT study. Chem Phys. 2021;549:111276.
- Liu H. Phosphorene: a new 2D material with high carrier mobility. arXiv preprint arXiv:1401.4133, 2014.
- Nagarajan V, Chandiramouli R. Adsorption behaviour of trichloropropane and tetrachloroethylene on δ-phosphorene sheets: A first-principles insight. Comput Theor Chem. 2021;1203:113347.
- Maria JP. Kagome phosphorene molecular device for sensing chloropicrin and phosgene – a first-principles study. Chem Phys Lett. 2021;771:138472.
- Bhuvaneswari R, Nagarajan V, Chandiramouli R. Red tricycle phosphorene nanoribbon as a removing medium of sulfadiazine and sulfamethoxazole molecules based on first-principles studies. J Mol Liq. 2021;336:116294.
- Huang X. Multifunctional layered black phosphorene-based nanoplatform for disease diagnosis and treatment: a review. Front Optoelectron. 2020;13:1–25.
- Tatullo M. Phosphorene is the new graphene in biomedical applications. Materials. 2019;12(14):2301.
- Martín C. Biocompatibility and biodegradability of 2D materials: graphene and beyond. Chem Commun. 2019;55(39):5540–5546.
- Yang W. Recent advance in near-infrared/ultrasound-sensitive 2D-nanomaterials for cancer therapeutics. Sci China Mater. 2020;63:1–32.
- Luo M. 2D black phosphorus-based biomedical applications. Adv Funct Mater. 2019;29(13):1808306.
- Cheng L. Black phosphorus-based 2D materials for bone therapy. Bioactive Mater. 2020;5(4):1026–1043.
- Zhang W. Directional extraction and penetration of phosphorene nanosheets to cell membranes. Nanoscale. 2020;12(4):2810–2819.
- Jyothi M, Nagarajan V, Chandiramouli R. Interaction studies of dichlobenil and isoproturon on square-octagon phosphorene nanotube based on DFT frame work. Chem Phys Lett. 2021;778:138773.
- Hehre WJ, Ditchfield R, Pople JA. Self-consistent molecular orbital methods. XII. Further extensions of Gaussian-type basis sets for use in molecular orbital studies of organic molecules. J Chem Phys. 1972;56(5):2257–2261.
- Prajapati H, Sharma R, Patel D. Carvedilol: a review of its use in the management of heart failure. Drugs Ther Perspect. 2017;33(3):147–152.
- de Souza GC. Preclinical evidences for an antimanic effect of carvedilol. Neural Plast. 2015;47:777–780.
- Geng T. Comparative study on stabilizing ability of food protein, non-ionic surfactant and anionic surfactant on BCS type II drug carvedilol loaded nanosuspension: physicochemical and pharmacokinetic investigation. Eur J Pharm Sci. 2017;109:200–208.
- Fernandes GJ. A review on solubility enhancement of carvedilol – a BCS class II drug. J Pharm Innov. 2018;13(3):197–212.
- Sharma M. Enhancement of oral bioavailability of poorly water soluble carvedilol by chitosan nanoparticles: optimization and pharmacokinetic study. Int J Biol Macromol. 2019;135:246–260.
- Ibrahim TM. Transdermal ethosomal gel nanocarriers; a promising strategy for enhancement of anti-hypertensive effect of carvedilol. J Liposome Res. 2019;29(3):215–228.
- Haunschild R, Barth A, French B. A comprehensive analysis of the history of DFT based on the bibliometric method RPYS. J Cheminform. 2019;11(1):1–15.
- Frisch A. Gaussian 09W reference. Wallingford (CT): Gaussian, Inc.; 2009.
- Parr RG, Yang W. Density functional theory of atoms and molecules. Oxford: Oxford University Press; 1989.
- Mohammed MH, Ajeel FN, Khudhair AM. Adsorption of gas molecules on graphene nanoflakes and its implication as a gas nanosensor by DFT investigations. Chin J Phys. 2017;55(4):1576–1582.
- Banerjee S, Bhattacharyya D. Electronic properties of nano-graphene sheets calculated using quantum chemical DFT. Comput Mater Sci. 2008;44(1):41–45.
- Torres E, DiLabio GA. A (nearly) universally applicable method for modeling noncovalent interactions using B3LYP. J Phys Chem Lett. 2012;3(13):1738–1744.
- Bauernschmitt R. Experiment versus time dependent density functional theory prediction of fullerene electronic absorption. J Am Chem Soc. 1998;120(20):5052–5059.
- Shamim M. DFT study of therapeutic potential of graphitic carbon nitride (g-C3N4) as a new drug delivery system for carboplatin to treat cancer. J Mol Liq. 2021;331:115607.
- Bagheri R. Si-doped phagraphene as a drug carrier for adrucil anti-cancer drug: DFT studies. Inorg Chem Commun. 2018;90:8–14.
- Boys S. The calculation of small molecular interctions by the differnces of separate total energies: Some procedures with reduced errors. Mol Phys. 1970;19:55.
- Jyothi M, Nagarajan V, Chandiramouli R. Interaction studies of benzene and phenol on novel 4–8 arsenene nanotubes – a DFT insight. Comput Theor Chem. 2021;1204:113381.
- Jyothi M, Nagarajan V, Chandiramouli R. Adsorption behaviour of sulfisoxazole molecules on tricycle arsenene nanoribbon-a first-principles study. J Mol Liq. 2021;343:117635.
- Nagarajan V, Chandiramouli R. Interaction studies of glycine, acetate and methylamine on β-tellurene nanoribbon – a first-principles analysis. J Mol Graph Modell. 2021;105:107895.
- Cances E, Mennucci B, Tomasi J. A new integral equation formalism for the polarizable continuum model: theoretical background and applications to isotropic and anisotropic dielectrics. J Chem Phys. 1997;107(8):3032–3041.
- Munir I. Therapeutic potential of graphyne as a new drug-delivery system for daunorubicin to treat cancer: a DFT study. J Mol Liq. 2021;336:116327.
- Chermette H. Chemical reactivity indexes in density functional theory. J Comput Chem. 1999;20(1):129–154.
- Mohammed K. Computational evaluation on the molecular conformation, vibrational spectroscopy, NBO analysis and molecular docking of betaxolol and betaxolol-chlorthalidone cocrystals. J Mol Struct. 2020;1209:127744.
- Savin A. ELF: the electron localization function. Angew Chem Int Ed English. 1997;36(17):1808–1832.
- Dapprich S, Frenking G. Investigation of donor-acceptor interactions: a charge decomposition analysis using fragment molecular orbitals. J Phys Chem. 1995;99(23):9352–9362.
- Wagner FR. Charge decomposition analysis of the electron localizability indicator: a bridge between the orbital and direct space representation of the chemical bond. Chem Eur J. 2007;13(20):5724–5741.
- Qu G. Improved biocompatibility of black phosphorus nanosheets by chemical modification. Angew Chem Int Ed. 2017;56(46):14488–14493.
- Gangadharan RP, Krishnan SS. Natural bond orbital (NBO) population analysis of 1-azanapthalene-8-ol. Acta Phys Pol A. 2014;125:1.
- Kurt M. Molecular structure, vibrational, UV and NBO analysis of 4-chloro-7-nitrobenzofurazan by DFT calculations. Spectrochim Acta Part A. 2011;79(5):1162–1170.
- Gorelsky S. SWizard program. Ottawa: University of Ottawa; 2010.
- Mumit MA. DFT studies on vibrational and electronic spectra, HOMO–LUMO, MEP, HOMA, NBO and molecular docking analysis of benzyl-3-N-(2, 4, 5-trimethoxyphenylmethylene) hydrazinecarbodithioate. J Mol Struct. 2020;1220:128715.
- Fleming I. Frontier orbitals and organic chemical reactions. The University of Michigan: Wiley; 1977.
- Khajehzadeh M, Sadeghi N. Molecular structure, the effect of solvent on UV–vis and NMR, FT–IR and FT–Raman spectra, NBO, frontier molecular orbital analysis of Mitomycin anticancer drug. J Mol Liq. 2018;256:238–246.
- Fukui K. Role of frontier orbitals in chemical reactions. Science. 1982;218(4574):747–754.
- Venkataramanan NS, Suvitha A. Nature of bonding and cooperativity in linear DMSO clusters: a DFT, AIM and NCI analysis. J Mol Graph Modell. 2018;81:50–59.
- Humphrey W, Dalke A, Schulten K. VMD: visual molecular dynamics. J Mol Graph. 1996;14(1):33–38.
- Parthasarathi R. Electrophilicity index as a possible descriptor of biological activity. Bioorg Med Chem. 2004;12(21):5533–5543.
- Torres RA. Ultrasonic cavitation applied to the treatment of bisphenol A. Effect of sonochemical parameters and analysis of BPA by-products. Ultrason Sonochem. 2008;15(4):605–611.
- Parr RG, Szentpály LV, Liu S. Electrophilicity index. J Am Chem Soc. 1999;121(9):1922–1924.
- De Vleeschouwer F. Electrophilicity and nucleophilicity index for radicals. Org Lett. 2007;9(14):2721–2724.
- Bendjeddou A. Quantum chemical studies on molecular structure and reactivity descriptors of some P-nitrophenyl tetrathiafulvalenes by density functional theory (DFT). Acta Chim Pharm Indica. 2016;6(2):32–44.
- Pearson RG. Absolute electronegativity and hardness correlated with molecular orbital theory. Proc Natl Acad Sci USA. 1986;83(22):8440–8441.
- Vargas R, Garza J, Cedillo A. Koopmans-like approximation in the Kohn−Sham method and the impact of the frozen core approximation on the computation of the reactivity parameters of the density functional theory. J Phys Chem A. 2005;109(39):8880–8892.
- Chattaraj PK, Giri S. Electrophilicity index within a conceptual DFT framework. Annu Rep Sect C. 2009;105:13–39.
- Silvi B, Savin A. Classification of chemical bonds based on topological analysis of electron localization functions. Nature. 1994;371(6499):683–686.
- Chipanina N. Intramolecular hydrogen bond in the push–pull CF3-aminoenones: DFT and FTIR study, NBO analysis. Tetrahedron. 2014;70(6):1207–1213.
- Perveen M. Therapeutic potential of graphitic carbon nitride as a drug delivery system for cisplatin (anticancer drug): a DFT approach. Biophys Chem. 2020;267:106461.
- Lu T, Chen F. Atomic dipole moment corrected Hirshfeld population method. J Theor Comput Chem. 2012;11(01):163–183.
- Wing-Bocanegra A, Tlahuice-Flores A. Effect of the charge state on bare monoicosahedral [Au13](z+) and diphosphine-protected Au13 clusters [Au13(dmpe)5Cl2](z+): structural, electronic and vibrational DFT studies. Phys Chem Chem Phys. 2019;21(43):23855–23864.
- Taherpour AA, Jamshidi M, Rezaei O. Recognition of switching on or off fluorescence emission spectrum on the Schiff-bases as a Mg2 + chemosensor: a first principle DFT and TD-DFT study. J Mol Struct. 2017;1147:815–820.
- De Silva AP. Combining luminescence, coordination and electron transfer for signalling purposes. Coord Chem Rev. 2000;205(1):41–57.
- Huang K-Y. Gold nanocluster-based fluorescence turn-off probe for sensing of doxorubicin by photoinduced electron transfer. Sens Actuat B Chem. 2019;296:126656.
- Kotzabasaki M. Multiscale simulations reveal IRMOF-74-III as a potent drug carrier for gemcitabine delivery. J Mater Chem B. 2017;5(18):3277–3282.