
Abstract
Near-surface geophysical techniques, (i.e. ground-penetrating radar (GPR) and electric resistivity tomography (ERT)), continue to enable great possibilities for 3-D visualization of fractures and cavities. An integrated survey, including GPR and ERT, was used for mapping and evaluating a complex subsurface fracture network in Eocene limestone at Al-Mokattam site, Egypt. While only GPR was available to investigate an engineering site of about 200 × 300 m, located in Riyadh city, Saudi Arabia, for cavity detection. At the Egyptian site, GPR data were acquired with a GSSI SIR2000 system using a 400 MHz shielded antenna with 0.2 m in-line spacing. GPR data visualized using an isosurface rendering combined with inverted ERT allowed us to identify and follow the fracture system, which was mainly filled with low-resistivity sediment; such fractured limestone may cause landslides. GPR data at the Riyadh site were acquired using the RAMAC system with a 100 MHz shielded antenna attached to a GPS with real-time kinematic total station equipment; GPR data confirmed the possible presence of cavities at different depths, which may cause severe damage during building construction. In this paper, we demonstrated the efficiency of each geophysical technique available for solving subsurface engineering problems, leading to future improvements in site safety. Additionally, we indicated the efficiency of an advanced 3-D GPR visualization technique (isosurface rendering) for improving fracture and cavity detection, characterization and interpretation.
1. Introduction
Ground-penetrating radar (GPR) is a high-resolution, non-destructive technique used for accurately probing near-surface structure. It is based on the principle that high-frequency electromagnetic (EM) waves may be reflected or refracted at subsurface features characterized by changes in their electrical properties [Citation1]. The GPR technique can reveal interfaces between different materials, if there is a sufficient contrast between the dielectric properties of these materials. The advantages of GPR surveys, especially for mapping and imaging subsurface geological features are well documented [Citation2–7]. The high horizontal and vertical resolution required for the detection of fractures and cavities makes GPR an effective technique for large-area surveys [Citation8–10]. Therefore, GPR is best suited for high-resolution geophysical and geological engineering investigations, particularly if it is combined with another geophysical technique such as electrical resistivity tomography (ERT). Defects in the subsurface rocks, such as fractures or cavities, create a challenge for imaging, especially fracture networks can produce an abundance of reflections, displacements, and hyperbolic diffractions in GPR profiles (Grasmueck et al. [Citation8]). GPR and ERT have been widely applied in the last decades for fracture and cavity detection (e.g. [Citation11–18]), while 3-D GPR visualization has been widely used for active fault imaging (e.g. [Citation4,Citation19–21]).
GPR anomalies can be easily identified and correlated throughout different adjacent profiles in the acquisition grid, from which we can follow the spatial extension of the target of interest. Conventional GPR used in subsurface exploration is mainly based on relatively widely spaced, parallel 2-D survey profiles with in-line spacing ranging from 0.5 to 1 m (0.5 m is the common in-line spacing in many case studies), with extensive interpolation used to fill in the shortage of data between adjacent profiles. The resulting subsurface images can be displayed as fence diagrams or highly interpolated pseudo 3-D image cubes [Citation22,Citation23].
Conventional time-slice presentation is the most popular and the most rapid method used to display 3-D GPR images from the relatively wide-spaced series of contiguous 2-D parallel profiles, in which amplitude reflections are mapped at a constant two-way travel time [Citation24]. However, time-slice imaging can be considered as a background filter, because GPR recorded traces can have significant horizontal banding noise caused by equipment design as well as reverberations from the ground surface [Citation25].
Horizontal time-slice, in many cases, may not be the suitable choice for subsurface a visualization tool in cases of great subsurface complexity such as structures buried or extended at different depths, and/or anomalies with an irregular morphology [Citation26]. To improve the efficiency and quality of subsurface target images, it is very important to use more advanced 3-D visualization techniques (e.g. the isosurface rendering technique), which has been considered a successful tool for such purpose.
Accurate subsurface imaging of the spatial variability fractures and cavities is essential when investigating land suitability for construction, and/or land use management based on limited subsurface soil information. GPR data analysis combined with ERT is a crucial technique to efficiently prioritize areas with cost-effective optimization of construction times, to efficiently implement hazard mitigation measures, and to design projects with appropriate and reliable foundation systems to compensate for geotechnical risks (e.g. [Citation27–29]). However, existing geotechnical investigations (traditional engineering techniques) that are widely performed to understand the potential problems of soils can be time-consuming, expensive, and limited. The limitations may include required depth of investigation, subsurface soil materials, etc.
Al-Mokattam plateau (Figure (a)) represents a serious danger problem, especially at the borders of the plateau, where at the southern part of the Al-Mokattam area there have been many landslides due to the fractured limestone. The landslides have caused damage to many houses and hotels around the area. The fractured limestone is underlain by a clay layer that causes most of the engineering problems because of volume changes in swelling clays resulting from human activities that modify the local environments [Citation30]. In the past few years, several rock failures have damaged houses, roads, and bridges, and caused loss of human life. For example, in September, 2008, a rockslide hits the nearby houses, killing 24 people and injuring over 300 persons [Citation31].
Figure 1. Google earth location maps for the geophysical survey sites. (a) Al-Mokattam survey site in Egypt, where ERT and GPR carried out, while (b) the location for Riyadh investigated site, KSA, where GPR was the only available technique used in the site.
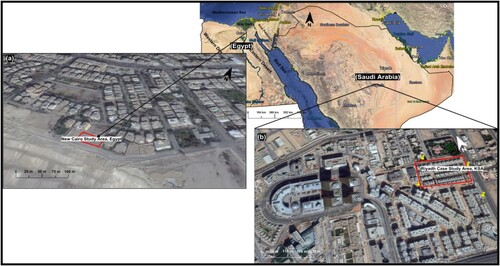
The Riyadh survey site (Figure (b)), is mainly characterized by limestone bedrock of the Sulaiy Formation that is considered as a critical hazard for construction safety because of fractures and cavities that occur in this limestone rock. These cavities developed in limestone as a result of the chemical leaching of the carbonate and evaporite formations by infiltrating water from nearby urban areas [Citation16,Citation32]. Section #2 will discuss in detail the geologic and geomorphologic setting of these two sites.
An objective of this study was to evaluate the potentiality of near-surface geophysical techniques available (GPR and ERT) to image out the fracture system running in the limestone plateau at the Al-Mokattam site, Cairo, Egypt, and to apply GPR survey to detect and define the shape and size of cavities in the limestone construction site in the Riyadh area, KSA. This research article introduces an application of 3-D visualization technique using isosurface rendering that is presented along with a comparison to conventional time-slice presentation. The results of this comparison have revealed an implication for easily imaging and tracking of subsurface fractures and cavities comparing with conventional methods used; herein we outline the main advantages of these isosurface techniques for target identification and characterization. We believe that results obtained in this paper will help to solve many future engineering geologic problems in complex situations or in challenging case studies like subsurface fracture and/or cavities.
2. Geological and geomorphological setting of the studied areas
2.1. Al-Mokattam site geological setting
The Al-Mokattam survey site is located between latitudes 29° 59′ 20″ and 30° 00′ 50″ and longitudes 31° 16′ 30″ and 31° 19′ 00″. The surface geology of the study area was described by the Geological Survey of Egypt [Citation33,Citation34] and the National Authority of Remote Sensing and Space Sciences [Citation35]. The area consists of two Upper Eocene formations. The first is the Maadi Formation, which consists of soft clastic rocks (clay, silt and sand) and hard dolomitic limestone; the second is the Giushi Formation, which consists of white fossiliferous limestone with marl intercalation.
Geomorphologically, the Al-Mokattam area consists of three plateaus. The upper plateau lies in the northern part and has high elevations ranging from 205 m in the south to about 170 m in the north; it is separated from the middle plateau by a steep cliff. The middle plateau has an elevation ranging from 110 to 150 m. The lower plateau has an elevation ranging from 50 to 80 m [Citation35]. The slopes of the Middle Eocene rocks that form the boundaries of the middle plateau of Gabal Al-Mokattam are unstable because of dissected fractured limestone with clay intercalation and represent potential areas of rock failure in many places [Citation36] (Figure ).
Figure 2. Diversity of fractures running in Al-Mokattam limestone Formation at Jabal Al-Mokattam Area.
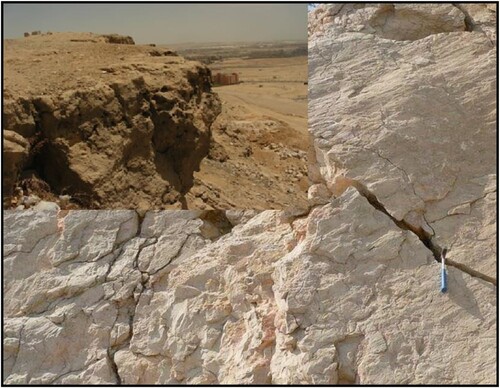
The foundation rock of the Al-Mokattam upper plateau is highly jointed, and the slopes of the south and south-west part have been affected by slope failures where several buildings were subjected to severe damage. In February, 2019 blocks of limestone fell down on the urban area at the northern part of the plateau (the Manshiyat Naser area just below Al-Mokattam hills), and more than 100 persons were injured according to local newspapers. GPR and ERT surveys were used to investigate the subsurface situation and to image fracture continuity, to avoid future rock collapse and to help preserve people’s life and property.
2.2. Riyadh site geological setting
The Riyadh area is located on the Najd plateau, in the central part of the Kingdom of Saudi Arabia, between longitude 24° 38' North and latitude 46° 43' East with an elevation of about 600 m above the mean sea level. Most of Riyadh city was built over a subsurface of carbonate rocks of the Jubaila formation from the Upper Jurassic era [Citation37]. The geology of the Riyadh site is mainly characterized by two different limestone bedrock units, both of which have high potential of developing karstic cavities, sinkholes, and open fractures [Citation38]. The first limestone unit is a NW-SW limestone belt on the eastern side of the Riyadh site and is known as the Sulaiy Limestone Formation of the Cretaceous age [Citation39]. The Sulaiy Formation is typically composed of compacted limestone with a few thin calcareous beds. On outcrops, this formation exhibits slumping features in its lower beds identical to the features found in the Arab Formation. The higher beds, however, are unaffected by slumping and are moderately strong, forming erosion-resistant, well-defined steep scarp slopes. Subsurface cavities and sinkholes are most frequently created in the lower limestone beds of the Sulaiy Formation at the contact with the Arab Formation rather than in the upper beds as they are (both the Sulaiy Formation and the Arab Formation) formed mainly of compacted limestone. The second karst unit belongs to the Jurassic limestone of the Arab Formation. This formation outcrops as an NW-SE trending of limestone belt at the western part of Riyadh, where our survey site is located (Figure (b)). This formation is mainly composed of limestone and evaporites, and it is considered as the most susceptible bedrock to develop soluble cavities in carbonate rocks. This could be attributed to either the dissolution of evaporites or to the nature of the limestone, which is probably composed of limestone boulders within an extremely soluble matrix of softer dolomitic limestone [Citation38]. In some locations, especially at the eastern part of Riyadh city, the highly fractured Sulaiy limestone formation is directly overlaid by the Arab Formation, due to the dissolution of the anhydrites of the Hith Formation [Citation40]. Solution-collapse of soft and porous breccia in the slumping carbonate beds is the main result of dissolution in the near-surface anhydrites [Citation41,Citation42] (Figure ).
Figure 3. (a) Typical subsurface cavities developed in limestone at Riyadh construction site, KSA. (b) The size and dimension of cavities in limestone bedrock of Sulaiy formation.
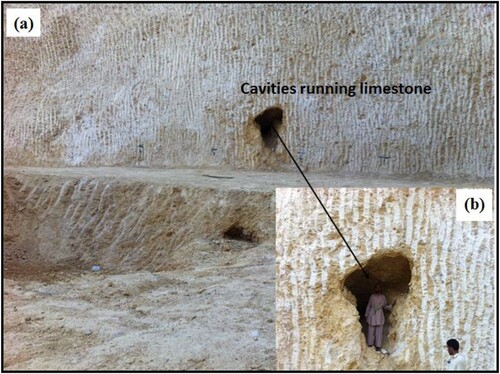
Such subsurface geological conditions at the Riyadh site, along with surface human activities, affect the ability of limestone to withstand construction and leave it significantly hazardous that may cause land subsidence, differential settlements and/or the collapse of buildings [Citation43].
3. Geophysical data acquisition
GPR data at the Al-Mokattam site was acquired with a SIR-2000 system from Geophysical Survey Systems Inc. (GSSI) using the 400 MHz shielded antenna (Figure ). Data were obtained using an odometer survey wheel with 0.2 m in-line spacing and 0.02 m cross-line spacing. GPR scan traces were recorded at every 2 cm with 512 samples/scan using a sampling rate interval of 0.2344 ns producing a two-way travel time with good reflection and penetration to about 120 ns corresponding to a depth of about 5 m based on a subsurface velocity of 0.1 m/ns. The scan area was about 8 m x 21 m at the cliff of a fractured limestone wall exposure (Figure (b)).
Figure 4. (a) Location map of the survey site. (b) The 400 MHz shielded antenna from GSSI used for acquisition of the relatively dense GPR data set at Al-Mokattam survey site in Egypt. String was used as guidelines for antenna movement, while measurement tape was used to place GPR antenna at each profile. (c) ERT measurement using Syscal-R2 multi-electrode system.
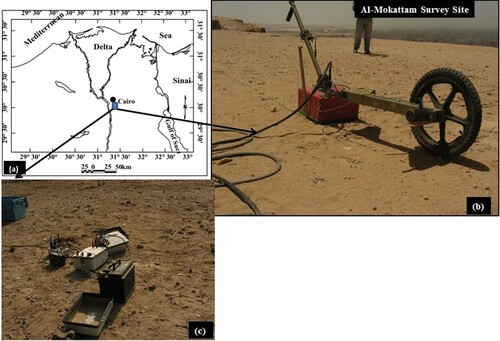
At the Al-Mokattam site, 2-D geoelectric resistivity survey was available and was used to investigate the subsurface resistivity distribution and geological setting in the site, to help interpretation of 3-D GPR data and image subsurface soil moisture content in the soil (Figure ). Electrical resistivity tomography (ERT) data were acquired using a SYSCAL-R2 multi-electrode system attached with 80 electrodes (connected to a network of intelligent nodes, which was used as an automatic multi-electrode switching system) using a Wenner-Schlumberger array, with 1.5 m electrode spacing, providing a depth of about 23 m with full subsurface data coverage to reach the expected target of interest for each study area. Each ERT measurement cycle required about 1.7 s, where the delay time was about 0.3 s. The intensity of the current injection during data acquisition was between about 150 and 230 mA (Figure (c)).
GPR data at the Riyadh site were acquired using a RAMAC system from MALA Geoscience with 1a 00 MHz shielded antenna attached to GPS real-time kinematic (RTK) total station equipment for position calculations (Figure ). The trace spacing was 0.05 m, which was used to determine the horizontal resolution. The total recorded time was about 311 ns, where this time is used for depth calculation, corresponding to the depth of about 15 m based on a subsurface velocity of 0.1 m/ns. Positioning data with RTK was acquired every 1 m using high-accuracy differential GPS (TRIMBLE GPS 5800 with TSC), where the x-coordinate and y-coordinate precision is about 1 cm and the z-coordinate precision is about 2 cm. Table presents the acquisition parameters for the RAMAC-100 MHz and the GSSI-400 MHz shielded antenna, GPR systems, respectively.
Figure 5. GPR data acquisition with 100 MHz shielded antenna using RAMAC system from MALA Geoscience. RTK was used to locate antenna positioning with high-accuracy differential GPS (TRIMBLE GPS 5800 with TSC).
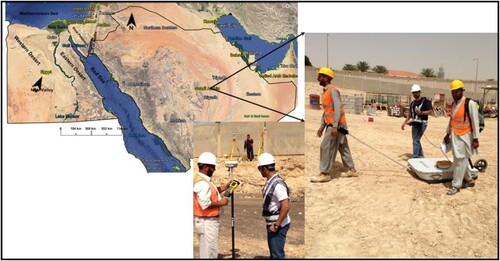
Table 1. Acquisition parameters for the RAMAC-100 MHz and the GSSI-400 MHz shielded antennas, GPR systems.
Unfortunately, an ERT survey was not available at the Riyadh site. Therefore, we used only GPR as an essential tool for subsurface investigation.
4. Geophysical data processing
The low conductivity of the subsurface limestone in both survey sites (Al-Mokattam & Riyadh sites) provides an exceptional GPR application for fractures and cavities detection. The GPR reflection data that are displayed directly after data acquisition in the field (Figures (a) and (a)) usually contain noise or interference, which make data interpretation difficult [Citation44]. To clean up the noise and correct the horizontal and vertical scales of the raw field data, they must be subjected to processing prior to interpretation.
All GPR data acquired with the 400 MHz and the 100 MHz shielded antennas were processed in exactly the same way (Figures and ) for each individual profile using the REFLEXW program [Citation45]. Table indicates the sequence of processing parameters applied to GPR data acquired with the RAMAC-100 MHz and GSSI-400 MHz shielded antennas. The processing steps were as following: (1) “Subtract DC removal” and “time-shift correction” compensates for zero time drift due to temperature changes affecting the GPR electronics, within a predefined time range the mean is calculated for each trace and is subsequently subtracted from all samples of each trace. In this processing step, we also remove zero time shifts (t0) between individually recorded data sets by aligning all first breaks to one common level throughout the GPR profile and also between repeat profiles. (2) The “dewow” [Citation46] step removes very low-frequency components of the data associated with either inductive phenomena or analog/digital conversion. (3) Automatic gain control (AGC): RAMAC profiles acquired with the 100 MHz antenna at the Riyadh site were subjected to AGC as one additional processing step. A fixed gain curve is normally applied in the field with the GSSI system but can be applied later during data processing for the RAMAC GPR system [Citation47]. (4) Background removal (average trace removal): This processing step is used to remove or decrease the effect of horizontal reflectors by calculating an averaged trace from the selected time/distance range of the actual GPR profile and subtracting it from every trace in the section. (5) Bandpass frequency: The filter bands are specified by the setting of four frequency values represented by a cosine window. Amplitude spectrum for every antenna in the two different systems was plotted and used to determine the signal frequency bandwidth for the 400 MHz antenna and the 100 MHz antenna, respectively. Therefore, frequency bands chosen for the 400 MHz shielded antenna were bands of about 230–295 to 550–615 MHz, while frequency filter bands of about 60–110 to 320–3370 MHz, were chosen for the 100 MHz antenna. The frequency spectrum below the low and above the high cut-off frequencies was set to be zero. (6) Running trace averaging was used to enhance the data in the horizontal direction and make the features more visible by taking the mean of a predefined number of traces in a window and subtract it from each individual trace in sequence for the entire GPR section [Citation48]. (7) Velocity estimation for time-depth calculations of the GPR data was based on diffraction hyperbola analysis with REFLEXW software [Citation45]. In addition, RAMAC GPR system with 100 MHz unshielded antenna was used in this part of the study (Riyadh site) to acquire common mid-point (CMP) radar data (Figure ). The transmitting and the receiving antenna for the 100 MHz unshielded antenna are separated and the CMP measurement can be carried out. Figure (a) shows the data of CMP profile along the survey site, where Figure (b) represents the velocity spectrum analysis derived from the CMP data. We can find that the root mean square (RMS) velocity is about 0.1 m/ns. Figure shows two different examples of 2-D GPR processed profiles at the Al-Mokattam site. Interpretation indicates vertical fractures and irregular displacement features appearing as strong reflection patterns in the 2-D GPR profiles. Figure indicates three different 2-D GPR profile examples at Riyadh site. The relatively large hyperbolic reflection signal was probably caused by relatively large cavity structure in the subsurface limestone. (8) The processed GPR profiles (Figures and ) were used to generate three-dimensional horizontal time-slices by spatially averaging the squared wave amplitudes of the recorded radar reflections over the time window (Figures and ). The interpolation process creates interpolated time-slices, which are normalized to 8 bit following the colour changes between different levels and not actual reflection values [Citation49]. The number of generated time-slices depends on the selected time window length, the slice thickness and the overlay between slices. Horizontal time-slice thickness is usually set to be at least one or two wavelengths of the radar pulse transmitted into the ground [Citation49]. Moreover, the thickness of the generated time-slice should not be thicker than the size of the smallest expected subsurface target (Figures and ), and in this case the selected window was about 25 ns. GPR-Slices v7.0 [Citation49] processing software was used to create the 3-D visualization with isosurface rendering, to improve interpretation of the GPR results and produce more readable images that can accurately define the dimensions of the target and its continuity (Figure ). Moreover, static topographic correction was not applied during data processing at either surveyed sites (Al-Mokattam & Riyadh areas), as the ground surface was smooth and flat and no elevation slope could be observed.
Figure 6. An example of GPR field data acquired with 400 MHz shielded antenna: (a) raw data, (b) data after dewowing, (c) data after signal processing, while (d) is the same profile with time cut after 80 ns to make fracture anomalies in subsurface more visible.
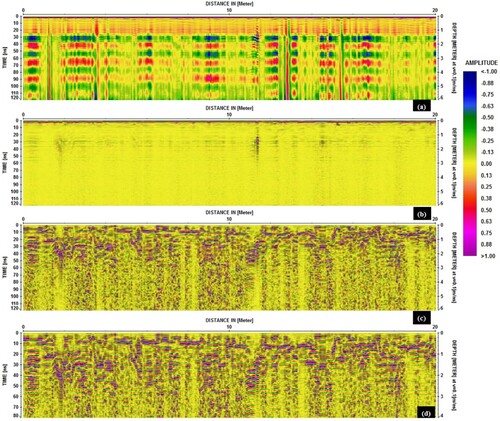
Figure 7. An example of GPR field data acquired with 100 MHz shielded antenna (RAMAC system): (a) raw data, (b) data after dewowing and AGC, (c) data after signal processing with background removal and bandpass filtering, (d) is the same profile with running average trace to smooth things up and make cavities features in subsurface more visible.
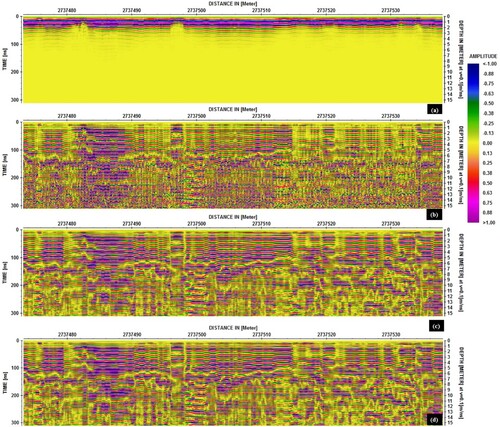
Figure 8. Common mid-point radar data acquired along Riyadh survey site using 100 MHz unshielded antenna: (a) CMP data collected and (b) velocity spectrum analysis obtained from (a) indicates that subsurface root mean square velocity is about 0.1 m/ns.
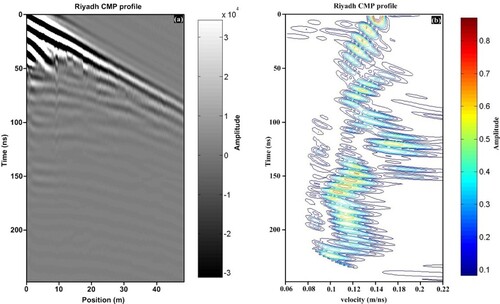
Figure 9. Two different examples of 2-D GPR processed profiles at Al-Mokattam site. The basic signal processing includes zero time-shift; background removal, bandpass filtering and running average trace. Interpretation indicates vertical fractures and irregular displacement features appearing as strong reflection patterns in 2-D GPR section.
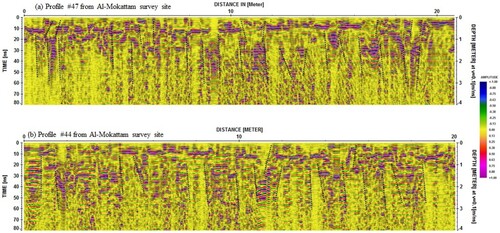
Figure 10. Three different examples of 2-D GPR processed profiles at Riyadh site. The basic signal processing includes zero time-shift; AGC, background removal, bandpass filtering and running average trace. Strong hyperbolic reflection signal probably caused by relatively large cavities structure running in subsurface rock.
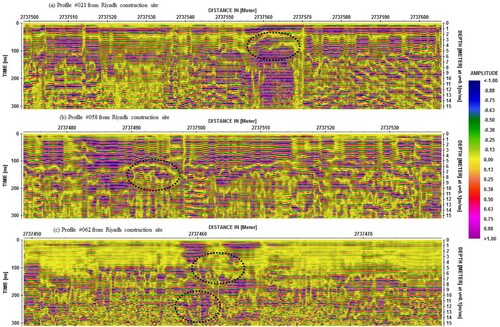
Figure 11. A composite set of time-slice images from surface to about 108 ns (corresponding to a depth of about 4.6 m). The strong reflection anomaly is related to subsurface fracture in limestone (Al-Mokattam site), where complexity and continuity of the fracture is not clearly visible in time-slice images.
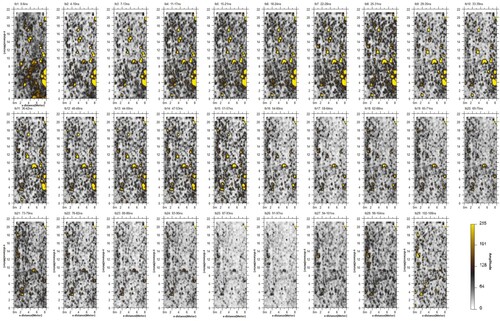
Figure 12. A composite set of time-slice images from surface to about 310 ns (corresponding to a depth of about 15 m). The strong reflection anomaly is related to subsurface cavities in limestone (Riyadh site).
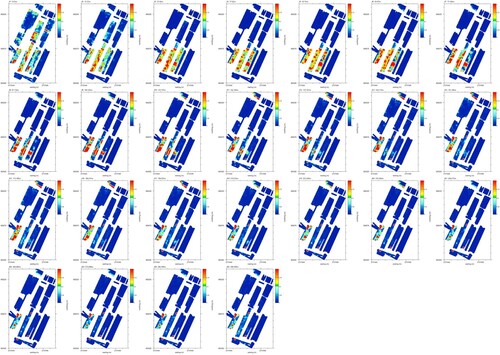
Figure 13. 3-D visualization by means of isosurface rendering technique of the trace analysis. (a) Al-Mokattam isosurface map illustrates the lateral continuity and intersection pattern of the steep fractures, where complex internal and geometry of fracture further enhanced in isosurface visualization. (b) Riyadh isosurface map, where expected subsurface cavities in limestone system cloud could be easily detected. The label (C1–C7) is given for the expected cavities location as the same in Table .
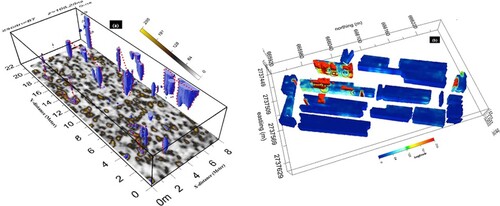
Table 2. Processing sequence applied to GPR data acquired with the RAMAC-100 MHz and the GSSI-400 MHz shielded antennas.
A geoelectric field dataset, in the form of 2-D electrical resistivity imaging, was processed using RES2DINV computer software [Citation50] (Figure ). The software generates a calculated model of the pseudo-section from the inverted model; the root mean square (RMS) error between the calculated and the measured pseudo-section is also computed during inversion sequences. A least-squares algorithm was used to reduce the RMS error between the measured and the calculated apparent resistivity in an iterative mode. Two inversion methods are available in the software package: the Gauss–Newton smoothness constrained least-squares [Citation51] and the Gauss–Newton robust model constrained [Citation52]; as a general rule, features depicted by both methods can be considered real [Citation53]. The Gauss–Newton smoothness constrained least-squares method was selected to reduce the RMS error between the measured and the inverted apparent resistivity [Citation53]. On the other hand, the non-linear least square optimization technique was used for the inversion routine [Citation50]. The number of iterations for data inversion was selected to be 5 iterations; this iterative process aims to reduce and minimize the difference between the measured ERT pseudo-section and the inverted pseudo-section based on the starting model.
Figure 14. 2-D electrical resistivity section acquired with Wenner-Schlumberger configuration (Cairo site). A set of 80 electrodes with 1.5 m electrode spacing generate a 120 m profile length with about 23 m depth of complete data coverage. (a) and (b) The measured and inverted model of the electric resistivity profile, (c) its interpretation are based on resistivity values and observed fracture in the adjacent outcrop.
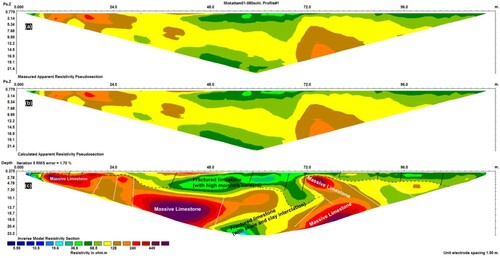
Subsurface interpretations for the inverted 2-D model of the electric resistivity profile are based on resistivity values and excellent limestone wall exposure, which facilitate the correlation between surface outcrops and ERT data as shown in Figure .
5. Results and interpretation
Instead of generating a large set of slices, an overlay between slices was applied to connect subsurface reflections that might have been recorded at slightly different depths as well as to improve image transitions between depths. The number of time-slices generated from GPR-Slice (Figures and ) depends mainly on the length of the time window selected, the slice thickness and the overlay between slices. The thickness of horizontal slices is often set to at least one or two wavelengths of the radar pulse that is sent into the ground [Citation49]. This processing step figured out a set of 30 horizontal slices at the Al-Mokattam site, using a 6 ns thick interval over a 120 ns time window (Figure ) and produced 26 horizontal slices for the Riyadh site using a 25 ns thick interval over a total two-way travel time of about 300 ns (Figure ).
Rather than following the conventional procedures of interpreting 3-D GPR subsurface reflection anomalies from multiple subsurface horizontal time-slices, we decided to detect the difference in object reflections on the basis of their 3-D isosurface rendering. Illumination is frequently added to the isosurface rendering presentation to highlight the features contained in the data volume (Figure ). This three-dimensional display of GPR data simulates the transmission and absorption of light through points inside the volume. Light rays are cast through the volume, where equal amplitudes within the volume may reflect or absorb light. The colour of an individual pixel on the screen is computed by combining contributions from each particle intersecting the ray. Colour-coding of the resulting structures significantly enhances the recognition of the relative position of the fractures and cavities and permits the viewing of homogeneity and heterogeneity within the objects with suitable adjustment of the opacity. As a final visualization step, the isosurface rendering technique was applied to extract a volumetric body that represents the shape of the target [Citation47]. Therefore, interpretation of the GPR data was based on the concept of these generated isosurface rendering volume.
Figures and demonstrate typical 2-D GPR vertical cross sections extracted from the two survey sites after data processing. Fracture in the subsurface is probably correlated with the high-amplitude reflections and vertical displacement in subsurface reflectors (Figure ), while cavities in limestone indicate relatively large hyperbolic features in the 2-D profiles (Figure ).
5.1. Joint interpretation for GPR and ERT results at Al-Mokattam site
The characterization of fractures with GPR in subsurface rocks depends on the type and size of the rock and the subsurface soil moisture content of the investigated materials. If the subsurface fractures are quite large and filled with materials with high electric conductivity and/or high electric permittivity (clay- or shale-filled fractures or high-moisture content filling), then a high amount of reflected radar energy will be scattered [Citation54]. Most subsurface fractures are too thin to be detected by GPR 2-D sections alone; therefore, we applied an isosurface rendering technique to visualize the continuity of the fracture and extract the volumetric distribution of the high-moisture content of the fracture filling material. The fractures could be observed in 2-D GPR sections by their semi-vertical displacement with openings reaching more than 0.5 m causing numerous relatively small diffraction hyperbolas in the area where they occurred (Figure ). Using these visualization approaches, a subsurface fracture network was created in the 3-D volume view (Figure (a)). Some of these fractures are confirmed by the surface exposures (Figure ). The 3-D isosurface visualization technique of volume rendering (Figure (a)) shows only the strongest amplitude reflection by setting the weak signals transparent. By using this visualization approach, a subsurface fracture network can be interpreted and followed in the 3-D GPR cubic volume. The 3-D GPR results in the form of isosurface rendering volume image approximately located the 3-D subsurface filling material of the fractures in limestone, helped to easily trace the complexity of the subsurface fractures, and simplified the location for a suitable future engineering solution. These sediment-filled fractures and displacements indicate high-amplitude features in the GPR isosurface rendering volume.
ERT was used at this site to investigate and reduce the ambiguity in GPR data interpretation. The ERT inverted image (Figure ) shows relatively low-resistivity values (from 36 Ωm to about 68 Ωm) interpreted as near-surface fractured limestone with relatively high-moisture content and/or shale and clay intercalation; various lateral changes in resistivity values within this layer could be related to water seepage from the nearby urban areas and/or heterogeneous solid materials filling the fractures in the limestone. At the lower part of the ERT section (Figure ), we can observe a highly resistive layer (between 120 Ωm to values greater than 449 Ωm) that may correspond to dolomitic limestone. The depth to the top surface of this layer is interpreted to vary between 7 m in some location to more than 10 m in other locations. This dolomitic limestone exhibits in some parts of the section a relatively low resistivity suggesting shale and clay intercalation in limestone related to the Maadi formation [Citation30]. In the ERT inverted model (Figure (c)), black dashed lines are assigned to the near-surface observed fractures running in limestone, while the white dashed lines at the lower part of the section indicate expected fractures in the dolomitic limestone layers. The ERT and 3-D GPR results are shown in Figure ; the overlapping ERT section and isosurface rendering volume in the first 24 m highlights the coherency between these two techniques used to image subsurface fracture.
Figure 15. Overlay view between 2D electrical resistivity section and the 3-D isosurface view for GPR data demonstrate the efficiency of integration between the two techniques to image subsurface fracture at Al-Mokattam site.
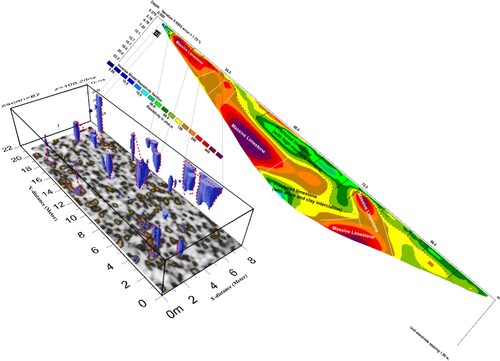
The low-resistivity zones between 1.5 and 4, 9 m and 12 m, and at about 24 m (Figure ) agree with the high-amplitude reflections in the GPR isosurface image at the same distance, implying a fractured limestone with high-moisture content filling visible in some parts of the survey site. This observation suggests that fractured and cracked rocks may be inter-connected to make the subsurface rock matrix more permeable; therefore, we put forth a plausible water infiltration model under a severely cracked and fractured subsurface rock condition [Citation55–57], which may lead relatively low-resistivity values in the study area.
5.2. 3-D GPR results at Riyadh site
In this dataset Figure , the 3-D images produced in the form of slice maps and isosurface rendering (Figure (b)) have been generated using GPR-Slice software [Citation49]; analysis of the multiple-reflection profiles indicates that the possible cavities of interest may be located in the subsurface limestone, and recorded in depth from 1.4 m to about 7 m in the surveyed region (Figure ). Therefore, suitable threshold values were chosen to improve reflection from the cavities and to remove the common GPR reflections produced by the surrounding homogenous limestone (reflections from host soil limestone are not included in the final isosurface images as they show only a relatively low amplitude reflection compared with reflection from the cavities) (Figure ). Integrated analysis of the individual GPR reflection profiles enables us to understand how the final 3-D images appear. Essential questions about GPR and what is being imaged in the subsurface should be raised during data analysis and processing. The most basic question is: What has produced the reflection? This can often only be determined from viewing reflections in profiles and understanding what produces radar reflections [Citation58]. Subsurface limestone at the Riyadh site shows a relatively weak reflection to radar wave, as it is composed of very homogenous white chalky aphanitic limestone of the Sulaiy formation [Citation59] (Figure ). Therefore, any subsurface interfaces between the cavities and surrounding limestone materials will reflect the radar waves transmitted from the surface and appear in the GPR sections as diffraction hyperbolas (Figure ). By analyzing the individual GPR sections, the reflective nature of the buried cavities of interest was distinguished and located in the standard amplitude slice map, where it becomes easy to follow and observe in the isosurface rendering image. At this site, isosurface rendering technique was able to image the detailed shape of subsurface cavities (Figure ); the shape of the cavities indicates a circular structure. Furthermore, combining conventional time-slice images with 3-D isosurface rendering maps (Figure (b)) shows us a relatively high-amplitude reflection, in which interpretation may be due to expected high-moisture content in the subsurface limestone near and around the expected position of cavities. This high-moisture content in the subsurface limestone is probably related to water seepage from nearby site urban areas due to bad sanitary systems. Groundwater seepage is unpredictably moving under many areas in the city of Riyadh, causing cavity formation in the carbonate soil, infrastructure damage, and/or landslides. Therefore, detection of these subsurface cavities is essential to prevent future building damage and loss of human lives.
Figure 16. An isosurface rendering of the 70% strongest reflecting surface in the 3-D data cube, allowing detailed interpretation for expected cavities location at Riyadh site.
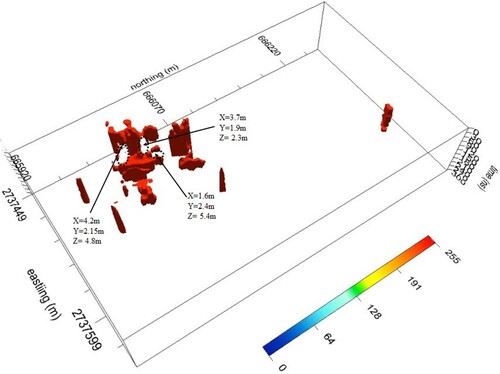
In this study area, drilled construction trenches confirmed the existence of subsurface cavities at various depths (Figure ), where complicated networks of subsurface cavities have developed as a result of limestone dissolution (Figure ). We have summarized in Table , the location and depth for the expected subsurface cavities anomalies at the Riyadh site. The large-amplitude reflection in the 3-D section (Figure (b)) around the cavities is probably correlated to limestone with high-moisture content due to water seepage from sanitary systems in nearby urban areas. The karst geomorphology is a distinctive terrain that occur in soluble rocks such as carbonates and evaporates limestone whose landforms are affected by underground seepage and drainage.
Table 3. Summary of expected location and depth for the subsurface cavities and anomalies at the Riyadh site, KSA.
6. Conclusions
In spite of the large fractured limestone wall exposure at our survey site, the subsurface fracture networks and especially the 3-D fracture continuity, in many cases are difficult to evaluate only from just the surface outcrop. Important information about the internal structures of the complex fractures and its continuity in the subsurface limestone rock recorded in 2-D profiles is not clearly visible in the conventional time-slices. Therefore, combining 3-D GPR in the form of isosurface rendering and 2-D ERT over such a fractured limestone is a major contribution toward tracking the fracture running in the Al-Mokattam limestone. This study shows that it is possible to map the soil filling the fracture, to indicate the lateral discontinuities and to identify the expected locations of future zones of collapse. Consequently, GPR in the form of isosurface rendering offers an unparalleled opportunity to determine sub-meter scale detail of fracture distributions, and possible locations of subsidence when it is integrated with the 2-D ERT, providing a well-constrained method for building fracture filling maps.
The study also shows that cavities developed along the Riyadh site are probably due to or associated with vertical water seepage from nearby urban areas. This supports the hypothesis that cavities develop in areas where groundwater is accumulated or temporarily retained. Moreover, in the Riyadh area as construction projects increase, this case study presents an appropriate and time-reducing way to plan the design and pre-evaluation of subsurface geo-engineering imaging for future projects running over formations characterized by cavities.
The proposed 3-D GPR visualization technique has shown its potential as a modern tool for GPR data interpretation. These techniques provide detailed information from different depths and facilitate the volumetric assessment of the underground fractures and cavities for engineering purposes.
Compared with the hazard and potential costs of damages caused by subsidence or rockslides in urban areas characterizing by unknown cavities or fractures, the cost and speed of execution of the discussed approaches (3-D GPR with advanced visualization techniques and ERT) for the geophysical prospection is definitely worth the effort. Moreover, we have shown that advanced 3D visualization by means of isosurface rendering procedures goes, beyond conventional time-slice imaging presentations, allowing for a comprehensive and more detailed interpretation of complex targets within the 3D GPR data volume. This 3-D visualization technique produced understandable images for fractured rock and cavity structures in great detail and provides engineers with information to guide future solution engineering developments technologies.
Acknowledgements
The authors would like to thank colleagues at NRIAG, Egypt for their help and support during field work. Moreover, we want to express our gratitude to Dr. Dean Goodman for helping to process the GPR data using GPR-Slice software.
Disclosure statement
No potential conflict of interest was reported by the author(s).
Additional information
Funding
References
- Daniels D. Ground penetrating radar. In: Daniels DJ, editor. IEE radar, sonar, navigation and avionics series. 2nd ed. London: Peter Peregrinus Ltd; 2004. p. 1–408.
- Grasmueck M. 3-D Ground-penetrating radar applied to fracture imaging in gneiss. Geophysics. 1996;61(4):1050–1064.
- Junck MB, Jol HM. Three-dimensional investigation of geomorphic environments using ground-penetrating radar. Int Soc Optic Eng (SPIE) Proc. 2000;4084:314–318.
- Christie M, Tsoflias GP, Stockli DF, et al. Assessing fault displacement and off-fault deformation in an extensional tectonic setting using 3-D ground-penetrating radar imaging. J Appl Geophy. 2009;68:9–16.
- Gaballah M, Goodman D, Magdy A, et al. Improving target identification and characterization from GPR data using isosurface renders technique. ICEG, UAEU, 15–18 November 2015, Al Ain, UAE, p. 102–105.
- Gaballah M, Grasmueck M, Sato M. Characterizing subsurface archaeological structures with full resolution 3D GPR at the early dynastic foundations of saqqara necropolis, Egypt. Sens Imaging. 2018;19(1):23.
- Gaballah M. GPR measurements with advanced isosurface rendering technique for accurately characterizing subsurface archaeological structure at Al-nadura roman temple in Egypt. Sens Imaging. 2019;20(1):40.
- Grasmueck M, Quintà MC, Pomar K, et al. Diffraction imaging of sub-vertical fractures and karst with full-resolution 3D ground-penetrating radar. Geophys Prospect. 2013;61(5):907–918.
- Theune U, Rokosh D, Sacchi MD, et al. Mapping fractures with GPR: a case study from turtle mountain. Geophysics. 2006;71(5):B139–B150.
- Nuzzo L, Leucci G, Negri S. GPR, VES and refraction seismic surveys in the karstic area “spedicaturo” near nociglia (Lecce, Italy). Near Surf Geophy. 2007;5(1):67–76.
- Tejero A, Chávez RE, Urbieta J, et al. Cavity detection in the southwestern hilly portion of Mexico city by resistivity imaging. J Environ Eng Geophy. 2002;7(3):130–139.
- El-Qady G, Hafez M, Abdalla MA, et al. Imaging subsurface cavities using geoelectric tomography and ground-penetrating radar. J Cave Karst Stud. 2005;67(3):174–181.
- Leucci G. Contribution of ground penetrating radar and electrical resistivity tomography to identify the cavity and fractures under the main Church in Botrugno (Lecce, Italy). J Archaeol Sci. 2006;33(9):1194–1204.
- Carpenter PJ, Ekberg DW. Identification of buried sinkholes, fractures and soil pipes using ground-penetrating radar and 2D electrical resistivity tomography. Proceedings of the 2006 highway geophysics-NDE conference; 2006. p. 437–449.
- Carriere SD, Chalikakis K, Sénéchal G, et al. Combining electrical resistivity tomography and ground penetrating radar to study geological structuring of karst unsaturated zone. J Appl Geophys. 2013;94:31–41.
- Abd El Aal A. Identification and characterization of near surface cavities in Tuwaiq Mountain Limestone, Riyadh, KSA, “detection and treatment”. Egyptian J Petrol. 2017;26(1):215–223.
- Cueto M, Olona J, Fernández-Viejo G, et al. Karst-induced sinkhole detection using an integrated geophysical survey: a case study along the Riyadh Metro Line 3 (Saudi Arabia). Near Surface Geophysics. 2018;16(3):270–281.
- Elawadi E, El-Qady G, Nigm A, et al. Integrated geophysical survey for site investigation at a new Dwelling Area, Egypt. J Environ Eng Geophy. 2006;11(4):249–259.
- Vanneste K, Verbeeck K, Petermans T. Pseudo-3D imaging of a low-sliprate, active normal fault using shallow geophysical methods; the Geleen Fault in the Belgian Maas River Valley. Geophysics. 2008;73(1):B1–B9.
- McClymont AF, Green AG, Streich R, et al. Visualization of active faults using geometric attributes of 3D GPR data: An example from the Alpine Fault Zone, New Zealand. Geophysics. 2008;73:B11–B23.
- Maurizio E, Cristina P, Francesca RC, et al. Imaging of an active fault: comparison between 3D GPR data and outcrops at the Castrovillari Fault, Calabria, Italy. Interpretation. 2015;3(3):SY57–SY66.
- Novo A, Lorenzo H, Rial FI, et al. Three-dimensional ground penetrating radar strategies over an indoor archaeological site: convent of Santo Domingo (Lugo, Spain). Archaeolog Prospect. 2010;17:213–222.
- Novo A, Grasmueck M, Viggiano D, et al. 3D GPR in archeology: what can be gained from dense data acquisition and processing? 12th international conference on ground penetrating radar, 2008, Birmingham, UK.
- Goodman D, Nishimura Y, Roger JD. GPR time slices in archaeological prospection. Archaeol Prospect. 1995;2:85–89.
- Boniger U, Tronicke J. Improving the interpretability of 3D GPR data using target–specific attributes: application to tomb detection. J Archaeol Sci. 2010;37:360–367.
- Nishimura Y, Kamei H. A study in the application of geophysical survey. In: Pernifka E, Wagner G, editor. Proceedings, archaeometry ‘90 conference; Heidelberg; 1990. p. 757–765.
- Parsons RL, Frost JD. Evaluating site investigation quality using GIS and geostatistics. J Geotechn Geoenviron Eng. 2002;128(6):451–461.
- Hack R, Orlic B, Ozmutlu S, et al. Three and more dimensional modelling in geoengineering. Bull Eng Geol Environ. 2006;65:143–153.
- De Rienzo F, Oreste P, Pelizza S. Subsurface geological–geotechnical modelling to sustain underground civil planning. Eng Geol. 2008;96:187–204.
- Sultan SA. Geophysical investigation for shallow subsurface geotechnical problems of Mokattam area, Cairo, Egypt. Environ Earth Sci. 2010;59:1195–1207.
- BBC News. Deadly rockslide hits Cairo homes; 2008. Available from: https://news.bbc.co.uk/2/hi/7601761.stm.
- Vaslet D, Al-Muallem MS, Maddah SS, et al. Geologic map of the ArRiyadh Quadrangle, sheet 24 I, Kingdom of Saudi Arabia (with text), Deputy Ministry for Mineral Resources, Jeddah, Geoscience Map GM-121; 1991.
- Geological Survey of Egypt (EGSMA). Geological and geophysical studies for Mokattam area, Cairo Government, internal report (in Arabic language); 1994.
- Geological Survey of Egypt (EGSMA). Geological and geophysical studies for Mokattam area (Phase II), Cairo Government, internal report (in Arabic); 2004.
- National Authority of Remote Sensing and Space Sciences (NARSS). Geological and geomorphological studies of the Mokattam plateau, Geological survey of Egypt, internal report (in Arabic language); 1997.
- Yousif MSM. Slope stability of the middle eocene rocks of Gebel Mokattam, ICEHM2000. Egypt: Cairo University; 2000; p. 14–22.
- Almadani S, Ibrahim E, Hafez M, et al. Geotechnical investigation of the El-Elb dam site, northwest Riyadh, Saudi Arabia, using 2D resistivity and ground-penetrating radar techniques. Arabian J Geosci. 2018;11(2):33.
- Abdeltawab S. Karst limestone geohazards in Egypt and Saudi Arabia. Int J Geoeng Case Histor. 2013;2(Issue 4):258–269. Available from: https://casehistories.geoengineer.org.
- Geological map of Riyadh Quadrangle; 1991, Sheet no. 241 scale of 1:250000.
- El Alfy M, ElSebaie I, Aguib A, et al. Assessing groundwater geospatial variation using microgravity investigation in the Arid Riyadh metropolitan Area, Saudi Arabia: a case study. Water Resour Manage. 2016;30(11):3845–3860.
- Rahim KSA. Strength and formation characteristics of sedimentary rocks. Proc Symp Geotech Prob Saudi Arabia. 1981;2:169–200.
- Masoud AA, Abdel Aal AKA. Three-dimensional geotechnical modeling of the soils in Riyadh city, KSA. Bull Eng Geol Environ. 2019;78(1):1–17.
- Stavridakis EI, Al-Rawas AA, Goosen ZFA. Assessment of anisotropic behavior of swelling soils on ground and construction work. In: Expansive soils: recent advances in characterization and treatment. London: Taylor and Francis; 2006. p. 371–384.
- Conyers LB, Goodman D. Ground- penetrating radar – an introduction for archaeologists. Lanham: AltaMira Press, A Division of Sage Publications, Inc.; 1997. p. 77.
- Sandmeier J. (2013). ReflexW software package. [cited Jun 2013]. Available from: https://www.sandmeier-geo.de/reflexw.html.
- Annan AP. Ground penetrating radar principles, procedures and applications. Mississauga (ON): Sensors and Software; 2003. p. 278.
- Leckebusch J. Ground-penetrating radar: a modern three-dimensional prospection method. Archaeol Prospect. 2003;10:213–240.
- Harry MJ. Ground penetrating radar: theory and applications, first edition, chapter 1 – electromagnetic principles of ground penetrating radar. Amsterdam: Elsevier Science; 2009. 544 p.
- Goodman D. GPR-SLICE v7.0 manual; January 2013. Available from: https://www.gpr-survey.com.
- Loke MH, Barker RD. Rapid least squares inversion of apparent resistivity pseudosections by a quasi-Newton method. Geophys Prospect. 1996;44:131–152.
- deGroot-Hedlin C, Constable S. Occam's inversion to generate smooth, two-dimensional model from magnetotelluric data. Geophysics. 1990;55:1613–1624.
- Claerbout JF, Muir F. Robust modeling with erratic data. Geophysics. 1973;38:826–844.
- Loke MH. Electrical imaging surveys for environmental and engineering studies. A Practical Guide to 2-D and 3-D Surveys: RES2DINV Manual, IRIS Instruments; 2001. Available from: www.iris-instruments.com.
- Grandjean G, Gourry JG. GPR data processing for 3D fracture mapping in a marble quarry (Thassos, Greece). J Appl Geophys. 1996;36:19–30.
- Mishra OP, Singh AP, Kumar D, et al. An insight into crack density, saturation rate, and porosity model of the 2001 Bhuj earthquake in the stable continental region of western India. J Asian Earth Sci. 2014;83:48–59.
- Singh AP, Mishra OP. Seismological evidence for monsoon induced micro to moderate earthquake sequence beneath the 2011 Talala, Saurashtra earthquake, Gujarat, India. Tectonophysics. 2015;661:38–48.
- Singh AP, Koulakov I, Kumar MR, et al. Seismic velocity structure and intraplate seismicity beneath the Deccan Volcanic Province of Western India. Phys Earth Planet Inter. 2019;287:21–36.
- Conyers LB. Interpreting ground-penetrating radar for archaeology. Walnut Creek, CA: Left Coast Press; 2012.
- Powers RW, Ramirez LF, Redmond CD, et al. Geology of the Arabian peninsula. Geolog Surv Prof Paper. 1966;560:1–147.