
Abstract
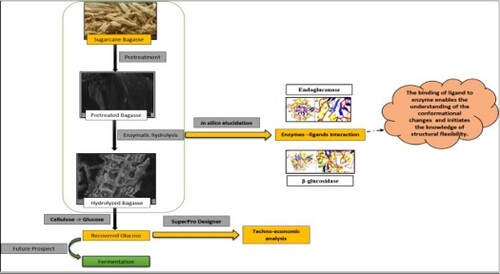
A technological scheme was developed to produce 2G fermentable sugar from sugarcane bagasse and was assessed for the process feasibility. This paper describes recovery of fermentable sugar, characterization of pretreated hydrolysed bagasse, in-silico elucidation of enzymatic hydrolysis and techno-economic analysis of the recovery of sugar from bagasse. The in-silico approach included characterization of both the enzymes, estimation of physiochemical and functional properties through ProtParam. Secondary structures of enzymes were represented using SOPMA. Modelling of enzymes was done using MODELLER 9.24. The developed model was validated through PROCHECK and was evaluated using Verify3D. The active sites of both the enzymes were predicted using 3D LigandSite – Ligand binding site prediction server and molecular docking of the predicted Models were performed using Swiss Dock. The techno-economic analysis showed 0.516 kg (2G fermentable sugar)/kg bagasse).
GRAPHICAL ABSTRACT
1. Introduction
Environmental issues aimed at reducing pollution have motivated the search for “Clean Technologies” to be used in the production of commercially important commodities. Usage of alternative materials demands less energy and reduces pollutants in industrial effluents. Industrial processes that use biomass and carbon dioxide as raw materials are an important alternative to mitigate the effects of pollution. Biomass as alternative materials are also cost-effective and hence more economical. Considering the scenario, the use of agricultural, forest residues has aroused the interest of scientific community to valorize the wastes from these industries. The utilization of such materials as sources of fermentable sugars that can be used as carbon source substrates for microbial cultivation intended to produce several industrially important compounds and are being researched extensively worldwide [Citation1].
Several agro-industrial wastes, such as sugarcane bagasse, wheat bran, corn cob and straw, rice straw and husk, and coffee husk, are commonly used for this purpose. Also, vegetable and fruits peel wastes from food processing industries are being researched to serve as feed stock to recover 2G sugars to serve as raw material in fermentation industries. India is an agro-based country, generates about 350 million tons of agricultural waste annually, as per the estimates given by the ministry of new and renewable energy. Several kinds of agro-wastes can be integrated to a common platform, and valuable compounds such as 2G sugar can be recovered from it [Citation2].
The need to achieve sustainable usage of resources and eco-friendly industrial process is in demand. A multilevel framework of research study is reported to develop a comprehensive method. This study presents the biotechnological route to produce fermentable sugar from the low-cost feedstock. Fermentation industries utilize sugar as one of the primary carbon sources in the fermentation process. Sugarcane bagasse is the commonly used agro-waste for the recovery of fermentable sugar as India is one of the largest sugarcane producers. However, currently, it is used primarily as fuel for the sugarcane mill cogeneration system [Citation3] and as fibre for reinforcements in composites. This low-cost waste comprises of a substantial number of saccharides with the potential to be used in industrially important chemicals production [Citation4]. Biomass recalcitrance is the major obstacle towards the transformation of lignocellulosic materials into valuable products. In order to overcome this barrier, several biological, chemical, physical and physicochemical pretreatments have been made available for different goals [Citation5]. The conversion of cellulosic materials into simple sugars via enzymatic hydrolysis is one of the most viable technologies towards the bio-refinery concept. The enzymatic hydrolysis of cellulose is a heterogeneous reaction that normally starts with the rapid adsorption of cellulases onto readily accessible regions of the substrate surface, which characterizes a relatively fast initial hydrolysis rate. However, an intermediate phase with a moderate reaction rate is achieved when about 50%–70% of the original substrate has been hydrolysed. Cellulosic materials for bioconversion are very diverse, and these may include energy crops and agricultural, agro-industrial and forestry residues, all of which are with different properties and susceptibility to pretreatment and enzymatic hydrolysis [Citation6,Citation7].
Cellulose is the major structural polysaccharide of lignocellulose and is a significant source of numerous value-added commodity chemicals. It is an unbranched polymer of glucose comprised of D-glucose units linked through a 1, 4-β-D glycosidic linkage [Citation8]. Cellulose, being an entirely stable polymer, requires the synergistic action of numerous enzymes to have complete hydrolysis; the enzymes include endoglucanases or cellulases and β-glucosidases [Citation9]. Exocellulase hydrolyses β-1, 4 glucocidyl linkages at either the non-reducing or reducing ends of cellulose forming cellobiose. The cellobiose are the disaccharides classified as reducing sugar, which are derived from the condensation of a pair of β glucose and creating a β bond. It can be directly hydrolysed to glucose by enzymatic hydrolysis unlike cellulose, as cellulose is rigid and has a compact structure; therefore, it is recalcitrant to enzymatic or microbial degradation.
Chemical technology route to produce sugars from sugarcane bagasse is a conventional established technology but is not eco-friendly due to the use of harsh chemicals. The enzymatic conversion of lignocellulosic biomass into fermentable sugars is a promising, eco-friendly approach for producing renewable fuels and chemicals. However, the cost and efficiency of the bioprocess remain as a significant bottleneck. There are not many reports on the enzymatic pathway processes’ challenges, and the techno-economic analysis reports on the recovery of second-generation (2G) sugars from bagasse. Hence, the industrialization of recovery of 2G sugar from bagasse remains unexplored.
In the current study, the sugarcane bagasse was pretreated and hydrolysed using Cellulase (endoglucanase) obtained from Trichoderma viride and β-glucosidase obtained from Sweet almond (Prunus dulcis). A standard plot was used to determine the concentration of sugar recovered. The structural change in the recovered fermentable sugar and the untreated bagasse was characterized through Field Emission Scanning Electron Microscope (FESEM). The conformational changes were characterized through FTIR spectra. The number of elements present in the untreated, pretreated and hydrolysed bagasse were characterized using Elemental Analyzer. The stability of the untreated, pretreated, and hydrolysed sugarcane bagasse in terms of the weight loss was analysed through the technique Thermo Gravimetric Analysis (TGA). The measurement of the heat difference for untreated, treated and hydrolysed bagasse was performed using Differential Thermal Analysis (DTA). The techno-economic analysis was performed, and the sugar recovered from lignocellulosic biomass was evaluated using SuperPro designer, a process simulator marketed by Intelligen, Inc. (Scotch Plains, NJ, USA). Experimental data were used to conduct a techno-economic assessment of the production of 2G sugar from sugarcane bagasse feedstock, and the cost of fermentable sugar production is evaluated. The goal is to summarize the estimated capital investment and production costs for producing sugars from biomass. The obtained biomass will be used as a resource for further developing industrial biotechnology applications. Further, an attempt was made to understand the binding efficiency of endoglucanase and β-glucosidase enzyme with cellulose and glucose through an in-silico approach. The in-silico studies help to overcome the laborious, time-consuming wet-lab trials for understanding the enzymes’ catalytic activity, computational physiochemical and functional characterization of the catalytic enzymes, thus saving time and laboratory resources. The in-silico approach included characterization of both the enzymes. The structure of enzymes was characterized by estimating the physiochemical and the functional properties through a tool of ExPasy (Expert Protein Analysis system) – ProtParam. ProtParam allows the computation of chemical and physical parameters for a stored protein sequence. The secondary structures were represented using Self-Optimized Prediction Method with alignment (SOPMA). The structure of the enzymes was modelled using MODELLER 9.24. The model validation of the predicated models was done through a European Molecular Biology Laboratory-European Bioinformatics Institute (EMBL-EBI) software, PROCHECK. PROCHECK checks the stereo-chemical quality of a protein structure, producing a number of PostScript plots analysing its overall and residue-by-residue geometry. The model was evaluated using Verify3D. The active sites of both the enzymes were predicted using 3D LigandSite – Ligand binding site prediction server, and the molecular docking of the predicted enzyme model was performed using Swiss Dock.
2. Materials & methods
2.1. Raw material and chemicals
Sugarcane bagasse was collected from the local juice vendor (Ranchi, Jharkhand; 23°24′51.0″N 85°26′18.9″E). The collected sample was sun-dried for 7 days and later it was crushed using a ball mill, crushed into small powder (500 µm) and stored in an airtight container for further experiments. All the chemicals and enzymes were procured from HiMedia (India).
2.2. Pretreatment and enzymatic hydrolysis
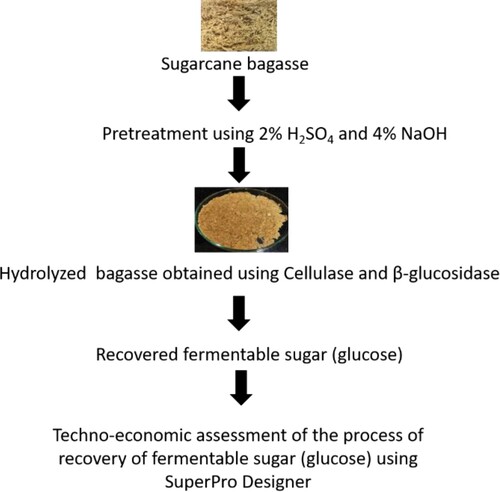
The crushed powder of sugarcane bagasse was pretreated using alkali and acid [Citation10], and 20% bagasse (w/v) was heated at 100°C with 2% H2SO4 (v/v) for 60 min. Further, it was washed until the pH reached 7, then the washed bagasse was reheated with 4% NaOH (v/v) and rewashed until the pH becomes neutral. The pretreated biomass was air-dried and weighed for further study. Later, the enzymatic hydrolysis was performed using 0.15% (w/w)-pretreated bagasse with (0.065 U/g) cellulase (source – Trichoderma viride), whose initial activity was a minimum of 10 U/mg solid, and (0.26 U/g) β-glucosidase (source – Prunus dulcis), whose initial activity was ≥10 U/mg solid [Citation11]. The enzyme mixture was prepared in the ratio of 1:2 (cellulose: β-glucosidase) in 0.05 M 4.8 pH citrate buffer, and the enzyme–substrate mixture was heated at 100°C for 10 mins to enhance the activity. It was centrifuged at 10,000 RPM for 30 min using Mini spin, Eppendorf (RCF: 14,100× g). The supernatant was filtered through a 0.22 µm filter and stored for further analysis. The concentration of recovered sugar was estimated using a Glucose (HiMedia) standard plot (concentration range: 0.2–1.0 mg/ml) obtained using UV–Vis Spectrophotometer (Systronics India Ltd.; Model number: 117) at 540 nm.
2.3. Characterization
Field Emission Scanning Electron Microscope (FESEM) analysis of the sugarcane bagasse was performed using ZEISS SIGMA 300 FESEM to visualize sugarcane’s topographical details of bagasse before and after hydrolysis. The FTIR spectra of untreated and hydrolysed bagasse were recorded using Shimadzu Corporation, Japan, IR-Prestige 21 Fourier transform infrared (FTIR) spectrometer; the dried powders were characterized in the range 450–3600 cm−1. Elemental Analyzer (Elementar, Germany, Vario EL III) was used to characterize the number of elements present in the untreated, pretreated and hydrolysed bagasse. Thermo Gravimetric Analyzer (Shimadzu, Japan, DTG-60) was used to characterize the stability of the untreated, pretreated and hydrolysed sugarcane bagasse in terms of the weight loss. The samples were heated at a temperature range of 32°C–800°C for approximately 4600 s, and a Differential Thermal Analysis (DTA) was also performed to measure the heat difference among the samples at a temperature range of over 35°C–800°C.
2.4. Feedstock representation
A mixture of various carbohydrates was created in SuperPro to represent the dry mass of sugarcane bagasse. The process flow sheet was designed for the pretreatment and the enzymatic hydrolysis of the sugarcane bagasse with the end product as sugar (glucose). A 50% moisture level was assumed for wet sugarcane bagasse. Accordingly, the feedstock stream of the flow sheet contains equal amounts of bagasse and water. The overall process is divided into the storage section, pretreatment section and hydrolysis section. Procedure B represents the storage of sugarcane bagasse, procedure P-2 represents the pretreatment of the bagasse and procedure P-1 represents the enzymatic hydrolysis of cellulose and hemicellulose. The heat is provided by the water vapour obtained during the process of heating in pretreatment at 80°C. The pretreatment is carried out in a reactor (P-2/R-101) using 1.013 bar pressure. The pretreatments’ main objective is to break down the lignin structure and dislocate the crystalline structure of cellulose for improving enzyme accessibility to the cellulose during the hydrolysis step [Citation12]. The usual structure of lignocellulosic material is tremendously recalcitrant to enzymatic hydrolysis.
The pretreated material, which is under high pressure and temperature, is adiabatically flashed to atmospheric pressure and is transferred to enzymatic hydrolysis reactor. The enzymatic hydrolysis was carried out in reactor (P-1/R-102) at 80°C temperature and 1.013 bar pressure. The process of enzymatic hydrolysis is one of the most important steps in sugar platform and it helps in utilizing renewable lignocellulosic biomass to produce fuels and chemicals. The processing steps of pretreatment followed by enzymatic hydrolysis can be used to depolymerize biomass cell wall carbohydrates, cellulose and hemicellulose to simple sugars. The sugar is separated at the end of the enzymatic hydrolysis step. Figure shows the overall steps involved in the study.
Figure 1. Overall steps considered for the study.
2.5. Template search, in silico physiochemical and functional characterization
The FASTA sequence of Endoglucanase III [Trichoderma viride] (Accession no. AAQ21383.1) (https://www.ncbi.nlm.nih.gov/protein/AAQ21383.1) and of Beta-glucosidase 42 [Prunus dulcis] (Accession no. XP_034219878.1) (https://www.ncbi.nlm.nih.gov/protein/XP_034219878.1) were retrieved from NCBI. The ProtParam tool of Expasy [Citation13] was used for the estimation of molecular mass, total number of positively and negatively charged residues, theoretical isoelectric point, instability index [Citation14] and extinction coefficients [Citation15]. SOPMA (Self Optimized Prediction Method from Alignment) was used for the prediction of Secondary structural features [Citation16].
2.6. Model generation & validation
The protein–protein BLAST [Citation17] was performed through NCBI to identify the homologous sequence using Protein Data Bank proteins (PDB) database search set [Citation18]. The crystal structure of CeI5A (EG2) from Hypocrea jecorina [Trichoderma reesei] (PDB ID: 3QR3, Chain: A) and Rice Os3BGlu6 Beta-glucosidase E178Q mutant [Oryza sativa Japonica group] (PDB ID: 3WBE, Chain: A) were selected as a template for the homology modelling [Citation19]. The atomic coordinate file of the template along with target and template file was used to build the Model using the homology modelling tool MODELLER 9.24. MODELLER is a well-known comparative modelling methodology that generates a 3D homology model of a protein sequence automatically, based on a given sequence alignment to a known 3D protein structure. A set of models are generated and the best Model with high DOPE Score was selected. The quality of the generated Model was assessed by checking the stereo-chemical parameters using PROCHECK [Citation20], and fitness of the Model’s sequence in their current 3D environment was evaluated by Verfiy3D [Citation21]. The bond angle, bond length and residue properties of the Model were analysed using protein report, and a Ramachandran plot was also obtained.
2.7. Active site prediction and molecular docking
The prominent active sites of modelled cellulase were predicted using an online software 3D LigandSite – Ligand binding site prediction server (http://www.sbg.bio.ic.ac.uk/3dligandsite/), and the obtained residues and amino acids were presented in a tabular form, further molecular docking was performed based on the predicted active sites of the protein molecule [Citation22]. The structures of cellulose (CID: 16211032) and glucose (CID: 5793) were retrieved from the PubChem database as ligand molecule (https://pubchem.ncbi.nlm.nih.gov/). SDF format of ligand structures was converted to PDB format for docking procedure. Swiss Dock server (http://www.swissdock.ch/) was used for the docking of obtained Model. The PBD files of ligand and the enzymes were uploaded to Swiss Dock for docking analysis. All the visualization was performed using Chimera 1.14 [Citation23].
3. Results & discussion
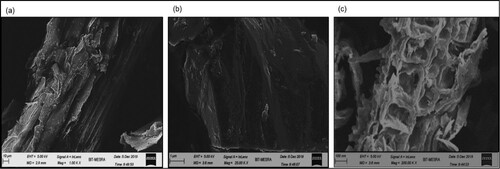
The sugarcane was milled for the juice extraction, and the bagasse was obtained as a residue, which corresponds to about 25% of the total weight and contains 60%–80% of carbohydrates. The significance of pretreatment on lignocellulosic biomass is to decrease the recalcitrance and it helps to improve the yield of fermentable sugars that are recovered by enzymatic hydrolysis [Citation24]. The moderate alkaline treatment method removes lignin selectively and keeps the polysaccharide intact as much as possible. The pretreatment was followed by enzymatic hydrolysis, and it breaks down the cellulosic biomass to monomeric sugar. The structural changes in the bagasse after pretreatment and hydrolysis were observed using FESEM (Figure ). The structure of the untreated bagasse is rough and compact, and thick-walled fibre cells as can be observed (Figure (a)). The effect of H2SO4 and NaOH pretreatment shows the separation in fibres and thereby loosening of the network. H2SO4 removed the hemicellulose from bagasse by rupturing the cell wall, and NaOH removed the lignin, making the surface of the substrate smooth [Citation25] (Figure (b)). The cellulose was totally destructed by enzymatic hydrolysis of the pretreated bagasse, and it showed an unstructured biomass (Figure (c)).
Figure 2. Structural morphology of sugarcane bagasse: (a) before hydrolysis, (b) after pretreatment and (c) after hydrolysis.
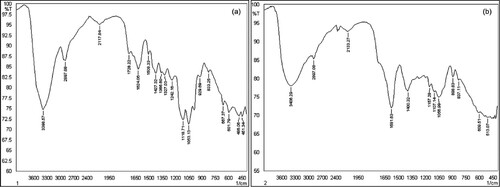
The confirmation of breaking of lignocellulose into its components was further attained by FTIR spectra (Figure ). The spectra obtained showed that a band at 833.25 cm−1 is a characteristic of the glycosidic bond β-(1 → 4) cellulose [Citation26]. The region between 1200 and 1000 cm−1 has a huge contribution for hemicellulose and cellulose, it exhibits a maximum value of 1053.13 cm−1 due to stretching of C–O bond and 1118.71 cm−1 due to distorted stretching of C–O–C bond [Citation27]. C–O bond stretching showed peak around 1242.16 cm−1 which is a characteristic feature of hemicellulose as well as lignin (Figure (a)). A band around 2133.27 cm−1 is due to C=O bond, a characteristic of unconjugated hemicellulose [Citation28]. The peaks at 2133.27 and 2897.08 cm−1 show the alterations in the cellulose chain due to the chemical treatment [Citation29] (Figure (b)).
Figure 3. FTIR spectra of sugarcane bagasse: (a) before hydrolysis and (b) after hydrolysis.
The initial weight loss of the untreated bagasse started at the temperature range of 35°C–180°C (5.973%) followed by 74.232% weight loss at 180°C–400°C; at around 400°C–620°C, the weight loss was 19.71% and the overall weight loss of untreated bagasse was 99.95%. The acid–alkali-pretreated bagasse showed increased initial weight loss of 7.653% at 32°C–200°C, followed by heating at the temperature range of 200°C–400°C to observe 48.071% weight loss; at 400°C–650°C, the weight loss was 16.635%, and the overall weight loss was 72.359%. In the case of cellulose, the slightly higher moisture content might be attributed to the absorption in the vacant spaces during the removal of hemicellulose and lignin [Citation30]. The weight loss of enzymatically hydrolysed bagasse was 6.162% at 35°C–200°C, it was 50.78% at 200°C–500°C and it was observed to be 37.207% at 500°C–800°C, which sums up to an overall weight loss of 94.15% (Figure (a)).
Figure 4. (a) TGA curve (b) DTA curve of sugarcane bagasse [BP – before pretreatment; AP – after pretreatment; AH – after hydrolysis].
![Figure 4. (a) TGA curve (b) DTA curve of sugarcane bagasse [BP – before pretreatment; AP – after pretreatment; AH – after hydrolysis].](/cms/asset/f05a3b4d-c23a-4074-b554-69e88abf06cb/tusc_a_2040243_f0004_oc.jpg)
The peak for the degradation of untreated bagasse was observed at 102.16°C (heat – 322.41 J/g) and 357.36°C (heat – 2.85 KJ/g), while the peak was observed at 313.82°C (heat – 327.56 J/g) for acid–alkali-pretreated bagasse, and the enzymatically hydrolysed bagasse showed peaks at 276.9°C (heat – 512.4 J/g) and 632.54°C (heat – 14.36 KJ/g) (Figure (b)). It can be expected that the decomposition of the bagasse at low temperature is due to the presence of hemicellulose, lignin and other non-cellulosic components and it supports the early onset of degradation [Citation31].
The TG curve of sugarcane bagasse was analysed to compare the weight loss of the untreated bagasse with the pretreated bagasse (using Acid–Alkali Pretreatment) and hydrolysed bagasse (using enzymatic hydrolysis – cellulase and β-glucosidase) (Figure (a)). The DTA curve (Figure (b)) shows the rate of degradation of untreated, pretreated and hydrolysed bagasse.
The elemental analysis performed for the untreated, pretreated and hydrolysed bagasse showed the weight to be 5.231, 4.84 and 4.426 mg, respectively. The percentage of carbon, hydrogen, nitrogen and sulphur are represented in Table .
Table 1. Elemental analysis of sugarcane bagasse.
The composition of the untreated bagasse was 35% cellulose, 25% hemicellulose and 22% lignin. The composition of the treated bagasse was 1.52% cellulose, 2.16% hemicellulose and 30.72% glucose (fermentable sugar). The efficiency of the pretreated biomass and enzymatic hydrolysis to produce fermentable sugars was assessed by the measurement of the total amount of recovered glucose from the sample after the enzymatic hydrolysis. The percentage of cellulose converted to fermentable sugar or the yield of enzymatic hydrolysis was estimated for both pretreatment i.e. partial hydrolysis and enzymatic hydrolysis i.e. total process yield. In the initial case, the total recovered glucose was divided by the amount of cellulose, while in the other case, the partial hydrolysis yield was multiplied by the pretreatment yield. Hydrolysis efficiency showed that the cellulose conversion is highly improved as the samples undergo the two-step pretreatment used in this work. Twenty-two per cent of cellulose was converted to glucose in an untreated bagasse sample and the total cellulose conversion was 90% after complete hydrolysis. The recovery of sugar suggests the cellulose percentage recovered from sugarcane bagasse as monosaccharide and oligosaccharides using combined pretreatment and enzymatic hydrolysis. A standard curve was plotted for the estimation of recovered sugar concentration, and the concentration obtained was 0.897 mg/ml. So, the recovery of fermentable sugar from sugarcane bagasse is 89.7% (w/v).
The crushed sugarcane bagasse is stored in the solid storage chamber (B/Storage), then through S-103 stream, it is subjected to the pretreatment section (P-2/R-101) and through stream S-104, water is provided in the reactor (R-101). The pretreated bagasse is sent to the enzymatic hydrolysis chamber (P-1/R-102) through stream S-105. The enzymatic hydrolysis is performed in the presence of enzymes, Cellulase and beta-glucosidase, and the final recovered sugar is collected at the end of the process. In the flow sheet, at the output destination, the component flow rates (Kg/Batch) were 1.52 for cellulose, 2.16 for hemicellulose, 30.72 for glucose (fermentable sugar), etc., giving a total of 84.53, and the overall components were balanced.
The composition of the sugarcane bagasse which was pretreated and hydrolysed is 49% (w/w) cellulose, 29% (w/w) hemicellulose and 20% (w/w) lignin. The plant scale for the base has a feedstock flow rate of 0.0595 MT/day of dry mass of bagasse (equivalent to 0.0598 MT/day of wet biomass). It is the same as the scale of a similar process analysed by engineers at NREL [Citation32]. The plant generates 0.0307 MT/h sugar, which is equivalent to 0.975 gal/h and 0.008541 million gallons per year (MGY). The conversion of cellulose to glucose after the pretreatment step was represented using a stoichiometric reaction that yields a 5.49% recovery of sugar, and the final conversion efficiency after the enzymatic hydrolysis is 90%.
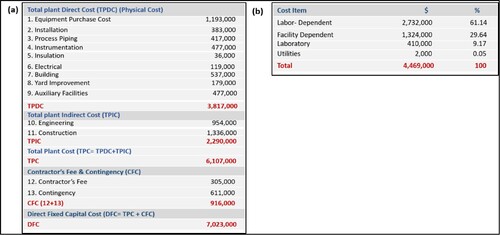
To estimate the capital and operational costs of fermentable sugar production from sugarcane bagasse using the software SuperPro Designer for the production process of fermentable sugar production from sugarcane bagasse, three main stages can be distinguished. The flow sheet obtained using SuperPro Designer (Figure ) shows the overall process of sugar recovery from sugarcane bagasse. The overall cost analysis was studied to perform the design and economic analysis of the fermentable sugar production process from sugarcane bagasse, and the complete technological scheme is presented in Figure . Based on the technological scheme for fermentable sugar production, the process simulation was done.
Figure 5. Flow sheet for sugar recovery from sugarcane bagasse using SuperPro Designer.
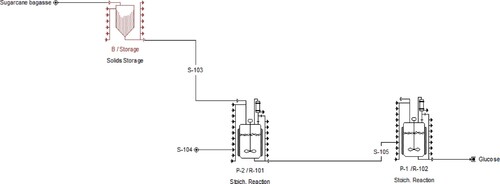
Figure 6. Cost analysis of the process obtained using SuperPro Design: (a) overall cost and (b) item cost.
To overcome the difficulties in time-consuming wet-lab trials of unnecessary trial experiments, for understanding the catalytic activity of the enzymes, computational physiochemical and functional characterization, in-silico studies including model generation and validation, active site prediction and docking analysis were extensively studied. In this study, the analysis of cellulase structure and β-glucosidase enzymes were performed to recognize the enzyme interactions with the lignocellulose of sugarcane bagasse. The physiochemical properties of the selected sequence of endoglucanase (amino acids: 418, mol. mass: 44154.81, pI: 4.96 pI, extinction coefficient: 83600 M−1 cm−1 and instability index: 36.01) and beta-glucosidase (amino acids: 489, mol. mass: 55311.25, pI: 6.38, extinction coefficient: 110950 M−1 cm−1 and instability index: 22.19) were obtained from ProtParam tool. The sequence of endoglucanase has 6050 atoms – 1928 carbon, 2946 hydrogen, 532 nitrogen, 627 oxygen and 17 sulphur, while β-glucosidase has 7663 number of atoms – 2510 carbon, 3747 hydrogen, 669 nitrogen, 723 oxygen and 14 sulphur. The calculated extinction coefficient gives an extent of the amount of light captivated by the protein at a 280 nm wavelength. The computed instability index (II) inferred that both the proteins are stable, and it relies upon the rate of dipeptides along with the length of the enzyme. The secondary structures of both the enzymes were obtained using SOPMA, the sequence length of endoglucanase is 418 and it has 31.82% of alpha helix, 13.40% of extended strands, 5.50% beta turn and 49.28% of random coils, while the sequence length of β-glucosidase is 489 and it has 35.17% alpha helix, 19.43% extended strand, 6.75% beta turn and 38.65% random coils.
The homology modelling was attempted using MODELLER9.24 and it is used for either comparative or homology modelling of 3D structures of protein molecule [Citation33] (Figure (i)) (Table ). The maximum negative DOPE value represents highly accurate generated Model from MODELLER (Table ), and it scrutinized the quality of the protein structure in terms of stereo-chemical properties, and the parameters were checked through the obtained Ramachandran plot which showed that Endoglucanase III has 91.4% residues in the favoured region, 8.6% in additional allowed region, and β-glucosidase has 91.9% residues in the favoured region, 7.2% in additional allowed region and 0.2% in disallowed region. It was apparent from the statistics that the structure of Endoglucanase III and β-glucosidase have >90% residues in the favoured region. It is reported that a good quality model should be expected to have >90% residues in the most favoured regions [Citation34]. The Verify3D inferred that both the generated models passed the test; Endoglucanase III model showed that 80.86% of the residues have averaged 3D-1D score ≥ 0.2; and β-glucosidase Model showed that 90.80% of the residues have averaged 3D-1D ≥ 0.2 and it represents that the obtained models are fit in their current 3D environment.
Figure 7. Cartoon representation of PBD structure: (i) Generated model viewed in Chimera (a) Endoglucanase and (b) β-glucosidase, (ii) Ligands (a) Cellulose and (b) Glucose [Yellow: Hydrogen, Blue: Oxygen, Red: Carbon], (iii) Endoglucanase (a) Chain A of 3QX3 structure for cluster 1 after docking of a molecule with the ligand using Swiss Dock and (b) The magnified image of the interaction of molecule with ligand; (iv) Beta-glucosidase (a) Chain A of 3WBE structure for cluster 5 after docking of a molecule with the ligand using Swiss Dock and (b) The magnified image of the interaction of molecule with ligand [Red colour: Coil, Yellow colour: Helix, Blue colour: Strand, Cyan colour: Ligand] obtained by Swiss Dock after docking.
![Figure 7. Cartoon representation of PBD structure: (i) Generated model viewed in Chimera (a) Endoglucanase and (b) β-glucosidase, (ii) Ligands (a) Cellulose and (b) Glucose [Yellow: Hydrogen, Blue: Oxygen, Red: Carbon], (iii) Endoglucanase (a) Chain A of 3QX3 structure for cluster 1 after docking of a molecule with the ligand using Swiss Dock and (b) The magnified image of the interaction of molecule with ligand; (iv) Beta-glucosidase (a) Chain A of 3WBE structure for cluster 5 after docking of a molecule with the ligand using Swiss Dock and (b) The magnified image of the interaction of molecule with ligand [Red colour: Coil, Yellow colour: Helix, Blue colour: Strand, Cyan colour: Ligand] obtained by Swiss Dock after docking.](/cms/asset/0ef248d4-084d-409f-83fe-6fcd61fe3095/tusc_a_2040243_f0007_oc.jpg)
Table 2. Summary of successfully produced models for endoglucanase and β-glucosidase.
Table 3. Plot statistics of the generated models using PROCHECK [A: Endoglucanase III and B: β-glucosidase].
The quality of the Model generated from MODELLER 9.24 was evaluated using PROCHECK to understand the stereo-chemical quality of the generated protein models. To understand the interaction of Endoglucanase and Beta-glucosidase with the ligands, the structure of cellulose and glucose were retrieved from PubChem database and were visualized in Chimera 1.14. It uses the prediction of protein structure to deliver protein models that have not been elucidated. The development of numerous protein sequences and their evidence related to the structural Model helps in the estimation of the efficient properties of the protein and the active sites. The documentation of catalytic residues is deliberated to be the key step for accepting the functions related to the enzyme. The process of docking a ligand to an active site efforts to reproduce the usual evolution of the ligand interaction with the receptor by the lowest energy pathway.
3DLigandSite was used for the prediction of binding sites of ligand with the enzyme. The predicted ligand binding sites of both the models are represented using 3DLigandSite (Figure (ii)), through specific amino acid with their residues: Endoglucanase- ASN238, GLU239, TYR311, GLU350 and TRP383; Beta-glucosidase- GLU393, ASP486, GLU482 and ALA250. Lastly, the molecular docking was performed successfully for the predicted active sites with models generated for Endoglucanase and Beta-glucosidase using Swiss Dock, and the resultant docked structure was analysed based on the following parameters: Cluster, Full fitness, H bond, Energy and ΔG. The lowest score (ΔG) i.e. suitable for docking was observed to be −6.624 Kcal/mol at cluster 1 having 2 H bond for endoglucanase and −5.516 Kcal/mol at cluster 5 having 2 H bond for beta-glucosidase (Table ).
Table 4. Poses obtained through molecular modelling using Swiss Dock.
Further, the complexes that were docked through Swiss Dock were visualized using Chimera 1.14 to illustrate several interfaces involved in the docking of target and ligand. The binding of cellulase to endoglucanase after docking was observed at GLU239 (Figure (iii)) and that of glucose to beta-glucosidase was observed at GLU393 (Figure (iv)).
4. Conclusion
Sugarcane bagasse are a potential promising lignocellulosic biomass candidate to produce fermentable sugars. Since the biomass is complex and rigid, it is vital to overcome the complexity and the rigidity. The acid–alkali pretreatment of the sugarcane bagasse helped in the separation of hemicellulose and lignin, hence increased the accessibility of cellulose to cellulase (Endoglucanase) enzyme including the actions of beta-glucosidase enzyme to facilitate the conversion into 2G sugar i.e. glucose. The microscopic technique (FESEM), the spectroscopic technique (FTIR), thermal degradation (DTA) and weight loss (TGA) used in the current work added a baseline for further studying the catalytic interaction of the enzymes with the ligands to provide an in-depth investigation of chemical changes and the binding properties of the enzymes. The techno-economic analysis performed on the recovery of 2G sugar from bagasse showed 0.516 kg fermentable sugar/kg bagasse recoverable from the waste bagasse. The obtained cost analysis report throws light on the basic information required for consideration of establishing an integrated sugar recovery unit. Transport costs are not considered here as the bagasse processing units could be set up as an integrated unit in any agro-processing industry. Thus, the improvement of key parameters, such as sugar yield, pretreatment time and sterilization requirements, are necessary to improve the techno-economic performance of the process.
Acknowledgements
The authors are thankful to TEQIP III under World Bank Scheme for financial support and Central Instrumentation Facility (CIF), Birla Institute of Technology Mesra, Ranchi, Jharkhand for providing all the facilities to carry out this work.
Disclosure statement
No potential conflict of interest was reported by the author(s).
References
- Manzanares P. The role of biorefinering research in the development of a modern bioeconomy. Acta Innov. 2020;37:47–56.
- Hingsame M, Jungmeier G. Biorefineries. In: Lago C, Caldes N, Lechon Y, editors. The role of bioenergy in the bioeconomy. Spain: Academic Press; 2019. p. 179–222.
- Hofsetz K, Silva MA. Brazilian sugarcane bagasse: energy and non-energy consumption. Biomass Bioenergy 2012;46:564–573.
- Mesa L, Nancy L, Cristóbal C, et al. Techno-economic evaluation of strategies based on two steps organosolv pre-treatment and enzymatic hydrolysis of sugarcane bagasse for ethanol production. Renew Energy. 2016;86:270–279.
- Silveira MHL, Morais ARC, da Costa Lopes AM, et al. Current pretreatment technologies for the development of cellulosic ethanol and biorefineries. Chem Sus Chem. 2015;8(20):3366–3390.
- Cherubini F, Ulgiati S. Crop residues as raw materials for biorefinery systems – a LCA case study. Appl Energy. 2010;87(1):47–57.
- Ramos LP, Suota MJ, Fockink DH, et al. Enzymes and biomass pretreatment. In: Filho E.X.F., Moreira l.R.de S., Ximenes E. de A., et al., editors. Recent advances in bioconversion of lignocellulose to biofuels and value-added chemicals within the biorefinery concept. Elsevier; 2020. p. 61–100.
- Gama FM, Teixeira JA, Mota M. Cellulose morphology and enzymatic reactivity: a modified solute exclusion technique. Biotechnol Bioeng. 1994;43:381–387.
- Tanaka M, Makoto I, Ryuichi M, et al. Effect of pore size in substrate and diffusion of enzyme on hydrolysis of cellulosic materials with cellulases. Biotechnol Bioeng. 1988;32:698–706.
- Wang M, Dayun Z, Yanqin W, et al. Bioethanol production from cotton stalk: a comparative study of various pre-treatments. Fuel. 2016;184:527–532.
- Mendes FM, Germano S, Walter C, et al. Enzymatic hydrolysis of chemithermomechanically pretreated sugarcane bagasse and samples with reduced initial lignin content. Biotechnol Prog. 2011;27:395–401.
- Mosier N, Wyman C, Dale B, et al. Features of promising technologies for pre-treatment of lignocellulosic biomass. Bioresour Technol. 2005;96:673–686.
- Gasteiger E, Christine H, Alexandre G, et al. Protein identification and analysis tools on the ExPASy server. In: Walker J.M., editor. The proteomics protocols handbook. Totowa,NJ: Humana Press; 2005. p. 571–607.
- Ikai A. Thermostability and aliphatic index of globular proteins. J Biochem. 1980;88:1895–1898.
- Guruprasad K, Reddy B, Madhusudan WP. Correlation between stability of a protein and its dipeptide composition: a novel approach for predicting in vivo stability of a protein from its primary sequence. Protein Eng Des Sel. 1990;4:155–116.
- Geourjon C, Gilbert D. SOPMA: significant improvements in protein secondary structure prediction by consensus prediction from multiple alignments. Bioinformatics. 1995;11:681–684.
- Altschul SF, Thomas LM, Alejandro AS, et al. Gapped BLAST and PSI-BLAST: a new generation of protein database search programs. Nucleic Acids Res. 1997;25:3389–3402.
- Berman HM, John W, Zukang F, et al. The protein data bank. Nucleic Acids Res. 2000;28:235–242.
- Mazur O, Jochen Z. Apo-and cellopentaose-bound structures of the bacterial cellulose synthase subunit BcsZ. J Biol Chem. 2011;286:17601–17606.
- Laskowski RA, Malcolm WM, David SM, et al. PROCHECK: a program to check the stereochemical quality of protein structures. J Appl Crystallogr. 1993;26:283–291.
- Bowie JU, Roland L, David E. A method to identify protein sequences that fold into a known three-dimensional structure. Science. 1991;253:164–170.
- Wass MN, Lawrence AK, Michael JES. 3DLigandSite: predicting ligand-binding sites using similar structures. Nucleic Acids Res. 2010;38:W469–W473.
- Pettersen EF, Thomas DG, Conrad CH, et al. UCSF chimera – a visualization system for exploratory research and analysis. J Comput Chem. 2004;25:1605–1612.
- Yan Z, Jihong L, Sandra C, et al. Lignin relocation contributed to the alkaline pre-treatment efficiency of sweet sorghum bagasse. Fuel. 2015;158:152–158.
- Rezende CA, Marisa AL, Priscila M, et al. Chemical and morphological characterization of sugarcane bagasse submitted to a delignification process for enhanced enzymatic digestibility. Biotechnol Biofuels. 2011;4:54.
- Pandey KK, Pitman JA. FTIR studies of the changes in wood chemistry following decay by brown-rot and white-rot fungi. Int Biodeterior Biodegrad. 2003;52:151–160.
- Colom X, Carrillo F, Nogués F, et al. Structural analysis of photodegraded wood by means of FTIR spectroscopy. Polym Degrad Stab. 2003;80:543–549.
- Hinterstoisser B, Lennart S. Two-dimensional step-scan FTIR: a tool to unravel the OH-valency-range of the spectrum of cellulose I. Cellulose. 1999;6:251–263.
- Cao Y, Huimin T. Structural characterization of cellulose with enzymatic treatment. J Mol Struct. 2004;705:189–193.
- Mandal A, Chakrabarty D. Isolation of nanocellulose from waste sugarcane bagasse (SCB) and its characterization. Carbohydr Polym. 2011;86:1291–1299.
- Sun JX, Sun XF, Sun RC, et al. Fractional extraction and structural characterization of sugarcane bagasse hemicelluloses. Carbohydr Polym. 2004;56:195–204.
- Marbach D, Thomas S, Claudio M, et al. Generating realistic in silico gene networks for performance assessment of reverse engineering methods. J Comput Biol. 2009;16:229–239.
- Fiser A, Richard KGD, Andrej S. Modeling of loops in protein structures. Protein Sci. 2000;9:1753–1773.
- Martí-Renom MA, Ashley CS, András F, et al. Comparative protein structure modeling of genes and genomes. Annu Rev Biophys Biomol Struct. 2000;29:291–325.