
Abstract
Creatinine, a final product of metabolism released in the blood and removed by kidneys. The improper functioning of kidneys causes its higher accumulation in blood. In this study, a facile strategy was designed for artificial kidneys by using magnetic chitosan membrane. The membrane was synthesized by phase conversion process. The synthesized membrane was characterized by fourier transform infrared spectroscopy, elemental diffraction spectroscopy, scanning electron microscopy, and thermogravimetric analysis. Different factors were optimized for creatinine removal by membrane such as concentrations of creatinine, pH, time, interfering species. The linear response was obtained in the concentration range from 10 to 70 µM of creatinine. The results showed the limit of detection 7.33 µM and the limit of quantification 22.82 µM at optimized conditions. The magnetic chitosan membrane facilitates the development of the ecofriendly and cost effective method for the removal of biological toxins from real samples.
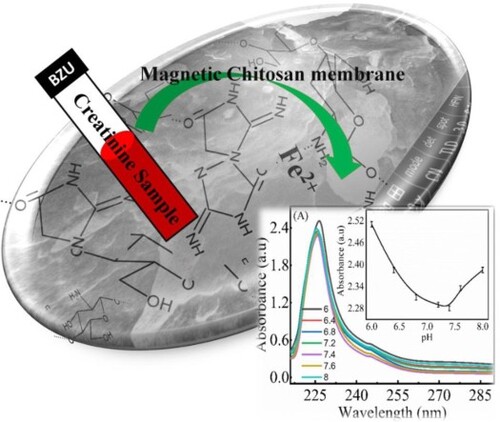
GRAPHICAL ABSTRACT
1. Introduction
Currently, more than three million people are suffering due to end-stage renal diseases [Citation1], haemodialysis is the most effective method and common method to save the life of these patients. In this method blood is purified by a membrane that adsorbs the toxic contents present in it. The patients need a three-time dialysis process that consumes 120 L of water in each session [Citation2]. The consumption of a large amount of water demands a miniaturization process that leads to the requirement of artificial kidney. The dialysates regeneration systems, containing various sorbents, reduce the volume of the dialysate. These sorbents include activated carbon, zirconium-modified salts, and chitosan that can eliminate the urea, creatinine, uric acid, and salts of phosphorous and potassium [Citation3]. Among these toxins, creatinine removal is comparably difficult due to its small size and solubility in water. The use of natural, biocompatible, and eco-friendly materials can minimize the production of these toxins. A wide range of biopolymers including polysaccharides and proteins can be used as sorbent materials for the generation of less toxic substances [Citation4]. Chitosan is an abundantly used sorbent material for biomedical applications [Citation5]. It is a natural amino-containing versatile material with unique chemical stability, non-toxicity, biocompatibility, biodegradability, porosity, hydrophilicity, and large surface area [Citation6]. Chitosan contains different functional groups such as amino group, and hydroxyl groups at C-2, and C-6 positions, respectively [Citation7]. These functional groups provide the platform for the physical and chemical modifications of chitosan by organic [Citation6] as well as inorganic compounds; hence, the efficiency of biopolymers can be improved [Citation8].
Nanomaterials especially MFe2O3 (M = Co, Mg, Zn, Cu, or Ni) are widely used for sensing, water treatment, medical applications, drug release, magnetic hyperthermia, and as a biocatalysts due to their chemical and thermal stability, non-toxic nature, and magnetic properties [Citation9]. The large surface area, particle size, and hydroxyl groups of magnetic nanoparticles enabled their use as an excellent adsorbent [Citation10]. These magnetic nanoparticles efficiently remove the uremic toxins that cannot be removed by the conventional haemodialysis technique [Citation11]. The nanoparticles can be synthesized by sol–gel [Citation12], microemulsions [Citation13], co-precipitations [Citation14], thermal decomposition [Citation15], and solvothermal processes [Citation16]. The sol–gel method is the most commonly used procedure used worldwide for the synthesis of magnetic nanoparticles from solutions, inorganic salts, and organometallic precursors in aqueous and non-aqueous media. It produces uniform, and homogeneous nanoparticles in shape and size with defined morphology [Citation17].
Creatinine, a natural organic compound, is made up of three amino acids, L-methionine, L-glycine, and arginine [Citation18]. It contains two functional groups, acidic groups, and guanidine. These functional groups facilitate its derivatization with organic compounds [Citation19]. The presence of creatinine in biological fluids is an indicator that reflects the index of renal function. Its accumulation in the body causes diabetes, gigantism, hypothyroidism, and chronic renal diseases. It provides energy and maintains the overall health of skeletal muscles [Citation20].
In the present work, an effective and biocompatible adsorbent membrane was prepared for the removal of toxin from the biological fluid. The magnetic chitosan membrane was prepared by a phase conversion process. The morphological characteristics of the as-prepared material were investigated with scanning electron microscopy, thermal gravimetric analysis, Fourier transform infrared spectroscopy, and elemental diffraction spectroscopy. The different factors such as pH, contact time, the effect of concentration of adsorbent, detection of creatinine, effect of concentration of creatinine, interference were performed to optimize the conditions. The applicability of the membrane was tested in a real biological sample. The membrane showed good adsorption behaviour towards the removal of the creatinine from the serum sample at optimized conditions.
2. Experimental section
2.1 Chemicals and instruments
Low molecular weight chitosan (75-85% deacetylated), ethylene glycol (C2H6O2, 99.8%), iron(III) chloride hexahydrate (FeCl3·6H2O), iron(II) chloride (FeCl2), ammonium hydroxide (NH4OH), ethanol (C2H5OH, 99.5%), potassium dihydrogen phosphate (KH2PO4, 99%), dipotassium hydrogen phosphate (K2HPO4, 98%), potassium nitrate (KNO3), urea (CO(NH2)2), glucose (C6H12O6), glutathione, ammonia (NH3, 99%), cobalt sulphate (CoSO4·6H2O), and creatinine (C4H7N3O,98%) were purchased from Sigma Aldrich. All the chemicals were used without any purification, other than mentioned. All the chemicals were saved at 4oC. Experimental work was performed at room temperature. The phosphate buffer (PBS) solution was used to maintain the pH of the solution in experiments. The double distilled water was used in all the experiments.
The UV–visible experiments were performed on the PROVE 600 Spectrophotometer at room temperature (25oC). Quartz UV-cells (3.5 mL, PTFE) were used for sample analysis. UV–visible spectrophotometer response before and after adsorption of creatinine was observed in the range of 200–800 nm. The functionalization of as-prepared material was observed by Fourier Transform Infrared (Equinox 55 FT-IR Spectrometer- Bruker, Bremen, Germany) Spectroscopy. Elemental composition was performed by X-ray diffraction (PANalyticalX’pert Pro diffractometer) spectroscopy in the reflection mode at room temperature. Measurements were taken at X-ray wavelength λ = 1.5406 Å, Cu Kα radiation at 40 keV. The scanning electron microscopy was performed at Nova NanoSEM, FEI. Thermogravimetric analysis was conducted to check the thermal stability of the magnetic chitosan membrane in the temperature range of 0–600 °C by using TGA-SDT 2960.
3. Synthesis and fabrication of magnetic chitosan membrane
Magnetic nanoparticles (Fe3O4 NPs) were prepared according to earlier methods with slight modifications [Citation27]. Briefly, chlorides of ferrous and ferric were dissolved in double distilled water and stirred in a three-neck flask at 70°C in N2 atmosphere. Then ammonium hydroxide solution was added to maintain pH 10 under vigorous stirring. The final precipitates were washed successively with distilled water and methanol several times dried in an oven at 50°C, and stored at room temperature for further experiments. Magnetic chitosan membrane (Fe3O4 NPs –chitosan membrane) was prepared by the phase conversion process through the dispersion of Fe3O4 nanoparticles in a solution of 2 g chitosan dissolved in ethylene glycol (70 mL). The solution was sonicated to remove the air bubbles. The magnetic chitosan membrane was prepared by the casting method. The transparent solution obtained was evenly casted on a plain surface of petri dish, dried at room temperature under cover for one day. The residual material was removed by washing with deionized water several times. The magnetic nanoparticles modified chitosan membrane was cut into different pieces as required (1 × 1 cm to 7 × 7 cm), and stored at room temperature for further studies in a desiccator.
4. General procedure for detection and quantitation of creatinine
Detection and quantification of creatinine were performed through UV–visible spectroscopy.. PBS buffer solution (0.1 M) was used to maintain the pH throughout the whole study. Various concentrations of creatinine (10–70 µ L) were added to the magnetic chitosan membrane. After an incubation time of at least 30 min, the magnetic chitosan membrane was separated from the creatinine solution. The concentration of the analyte solution before and after adsorption onto the magnetic chitosan membrane was analysed by a UV–visible spectrophotometer. The removal efficiency of the magnetic chitosan membrane for creatinine at different pH values and time intervals was observed. All the calculations and graphs were plotted in Origin Pro8 software and in Excell 2007. The images were modified and drawn in PowerPoint 2007. All the experiments were performed in triplicate. All the sample solutions were prepared fresh.
5. Results and discussion
5.1 Synthesis and characterization of magnetic chitosan membrane
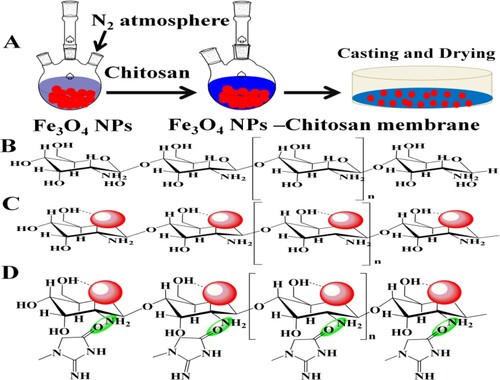
The magnetic–chitosan membrane was synthesized for the sorption of the creatinine from biological fluid. The detailed schematic illustration for the preparation of Fe3O4 magnetic nanoparticles, magnetic nanoparticles incorporated chitosan membrane, and interaction of creatinine from biological fluid is given in Scheme 1.
FTIR spectra of chitosan and magnetic chitosan membrane were examined to determine the functional groups and binding of magnetic nanoparticles on chitosan (Figure ). The IR spectrum of the chitosan membrane (Figure (A)) shows a broad peak at 3366 cm-1 relates to the –OH stretching vibration and –NH extension vibration which is attributed to the intermolecular hydrogen bonding within the biopolymer. The peak at 2880 cm-1 depicts the stretching vibrations of the methyl C–H bond. Peaks at 1641, 1390, and 1043 cm-1 can be assigned to the C = C stretching vibrations, C–N, and C–O in alcoholic groups present in the chitosan network. After modification (Figure (B)) with magnetic nanoparticles, the broad peak at 3366 cm-1 and small peaks at 2880 cm1- shifted towards more higher wavenumber of 3431 and 2921 cm-1, respectively, due to stretching vibrations of O–H and C–H of methyl groups, similarly the modification of chitosan with magnetic NPs shifted the C = C stretching vibrations, C–N, and C–O peaks towards lower wavenumber at 1631, 1388, and 1027 cm-1 as compared to chitosan alone. The peaks related to that appearing in the fingerprint region at 559 and 635 cm-1 are attributed to the presence of the Fe–O bond modified membrane as compared to the unmodified membrane. Thus, the FTIR analysis shows a successful cross-linkage of magnetic nanoparticles with chitosan.
Figure 1. FTIR spectra and thermogravimetric analysis of (A,C) chitosan membrane (B,D) magnetic chitosan membrane.
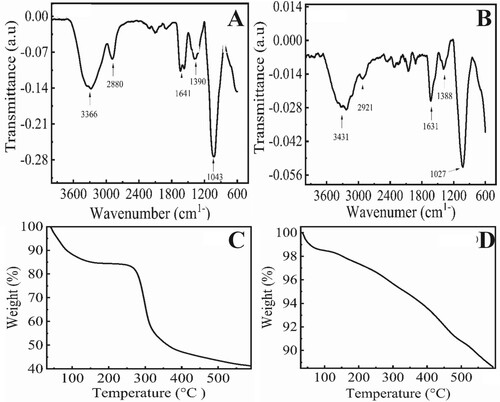
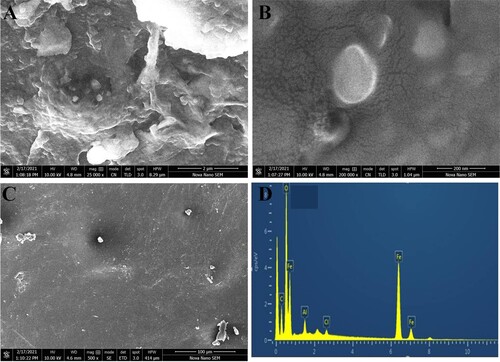
Thermogravimetric analysis of chitosan and magnetic chitosan membrane is shown in Figure (C,D). The weight loss (%) for the chitosan membrane is observed with respect to the temperature in the range of 0–600°C (Figure (C)). Below 300°C weight loss is about 25%. However, as the temperature was increased, a significant and rapid weight loss was observed. On the other hand, chitosan modified with magnetic nanoparticles (Figure (D)) showed a small amount of initial weight loss of 10% only. Weight loss is quite small which may be due to the loss of water chemically and physically attached with chitosan. The surface morphology of as-synthesized chitosan membrane and magnetic chitosan membrane was analysed by SEM micrographs (Figure ). The SEM images in Figure (A,B) showed the presence of magnetic nanoparticles as spherical shape, densely packed within the network structure of the chitosan membrane. The membrane shows a porous structure as well. Figure (C) shows the flat, uniform and homogenous surface, smooth surface of the chitosan membrane. The EDX analysis was performed to confirm the formation of the magnetic chitosan membrane. Different areas were focused and the EDX spectrum shows the peaks of C, O, Al, Fe, and Cl (Figure (D)). The elements C, O, Cl, and Fe are the main constituents of the magnetic chitosan membrane that are about 11.61, 30.54, 0.72, and 55.31 in weight per cent, respectively.
Figure 2. Chracterization of magnetic chitosan memebrane: SEM images (A, B, C) and EDX spectra (D).
5.2 Effect of concentration of creatinine on efficiency of magnetic chitosan membrane
The adsorption efficiency of the magnetic chitosan membrane was observed at various concentrations of creatinine solutions (10–70 µM). The solutions were incubated with the magnetic chitosan membrane (1 cm × 1 cm) for 30 min at pH 7.4. The concentrations of the creatinine solutions were examined before and after the incubation into the membrane as shown in Figure (A,B). Insets in the figure show the linear calibration plot for the corresponding response. The results showed that as the concentration of creatinine increases, absorbance also increases. As the creatinine moves out from the membrane, absorbance decreased which shows the adsorption of creatinine at the network of the magnetic chitosan membrane. Before incubation of creatinine, there was maximum absorbance of 2.1 which decreases to 0.64 for the same amount of creatinine (70 µM) after treatment. The linear regression equation was A (a.u) = 0.00733 C (μM) + 0.170 with R2 = 0.88 value. The calculated values of LOD, and LOQ were 7.32, and 22.82 μM, respectively, which are comparable with previously reported methods summarized in Table . The as prepared magnetic chitosan membrane shows higher sensitivity and a lower limit of detection with a wider range of response.
Figure 3. Sensing of creatinine onto magnetic chitosan membrane (A) before adsorption and (B) after adsorption, Inset shows the linear calibration plot for the corresponding response. Experimental conditions: creatinine 10–70 µM, 0.1 M PBS (pH 7.4), magnetic membrane (1 cm × 1 cm), wavelength range 200–800 nm. The errors bars are added for N = 3 replicates (SD± 0.05).
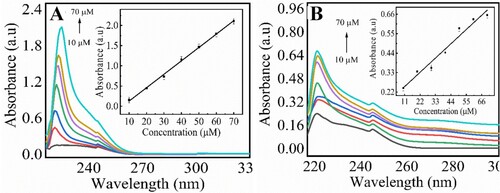
Table 1. Comparison of repsorted methods for removal of creatinine from biological samples.
5.3 Effect of size of magnetic chitosan membrane on creatinine removal
The effect of the size of the magnetic chitosan membrane for the removal of creatinine from solution was observed at optimized conditions. The different sizes of magnetic chitosan membranes from 1 cm × 1 cm to 7 cm × 7 cm were incubated with creatinine solution (70 µM) . The UV–visible responses of creatinine solution after incubation in magnetic chitosan membrane are shown in Figure . The results revealed that an increase in the size of the membrane gradually decreases the absorbance indicating an increased adsorption of creatinine from solution. The results indicate that from 1 cm × 1 cm to 6 cm × 6 cm membrane size, absorbance decreased sharply; however, from 6 cm × 6 cm to 7 cm × 7 cm it was almost constant. Figure (B) shows the linear response between the absorbance and membrane size.
Figure 4. Effect of magnetic chitosan membrane for removal of creatinine; UV–visible spectra response (A) and linear calibration plot for the corresponding response (B). Experimetal conditions: creatinine 70 µM, magnetic chitosan membrane 1 cm × 1 cm to 7 cm ×7 cm, 0.1 M PBS (pH 7.4), incubation time 30 min, wavelength range 200–800 nm. Errors bars are added for N = 3 replicates (SD± 0.05).
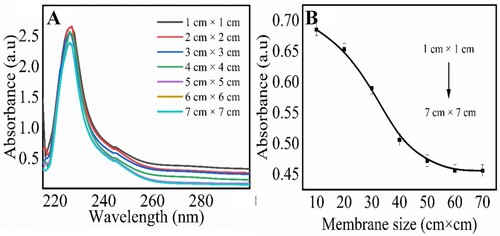
Figure 5. Optimization of analytical paprametrs for removal of creatinine at magnetic chitosan membrane: pH optimization from 6.0 to 8.0 (A), time optimization from 30 to 150 min (B). Experimetal conditions: creatinine 70 µM, magnetic chitosan membrane 6 cm × 6 cm, 0.1 M PBS, pH (6.0, 6.4, 6.8, 7.2, 7.4, 7.6, 8.0), wavelength range 200–800 nm. Errors bars are added for N = 3 replicates (SD± 0.05). Inset shows the linear calibration plot for the corresponding parameter.
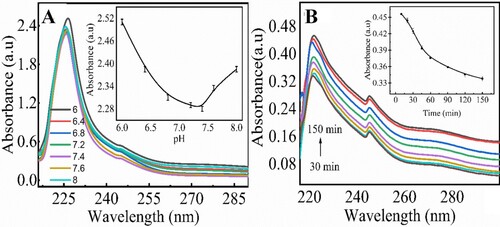
Figure 6. Interference effect for creatinine; UV–visible spectra response (A) and corresponding bar graphs for interfering species (B). Creatinine 30 µM, magnetic chitosan membrane 6 cm × 6 cm, 0.1 M PBS (pH 7.4), the time required 30 min, wavelength range 200–800 nm, interfering species (cobalt sulphate, ammonia, glutathione, glucose, potassium nitrate, urea). Experimetal conditions: creatinine 70 µM, magnetic chitosan membrane 1 cm × 1 cm to 7 cm ×7 cm, 0.1 M PBS (pH 7.4), incubation Time 30 min, wavelength range 200–800 nm. Errors bars are added for N = 3 replicates (SD± 0.05).
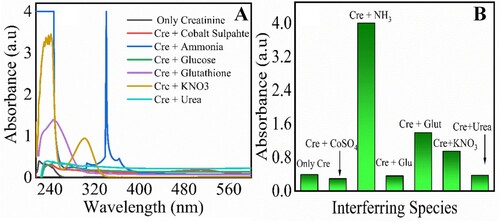
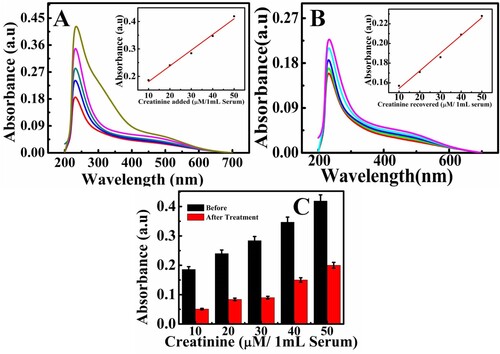
Figure 7. Analysis of creatinine spiked serum sample; before membrane reatment (A) after treatment with membrance (B), and comparison bar graph before and after treatment. Error bars are added at N = 3, S.D = 0.05. Inset linear graph shows the relationship between the creatinine amount added and recovered from serum samples.
Scheme 1. Schematic Illustration for synthesis of magnetic chitosan membrane; chistosan (A), Fe3O4-Chitosan (B), and interaction of creatinine with Fe3O4 –chitosan memebrane.
5.4 Optimization of other analytical parameters for removal of creatinine
The factors such as pH and time were also optimized to check the removal of creatinine from solution. The removal of creatinine from solutions at different pH values from 6 to 8 was studied at optimized conditions using magnetic chitosan membrane (6 cm × 6 cm). The results (Figure (A)) showed that an increase in pH of solution from 6 to 7.4 decreases the absorbance, demonstrating the maximum adsorption of creatinine at pH 7.4. The inset (Figure (A)) shows the relationship between absorbance vs. pH. However, an increase of pH from 7.4 to 8 shows the increase in absorbance, indicating less adsorption. pH 7.4 was considered as the optimized value.
The effect of time for creatinine removal was studied by incubating the magnetic chitosan membrane in creatinine solution from 30 to 150 min at optimized conditions. The results (Figure (B) and inset) showed that as the incubation time was increased, the absorbance decreased showing more removal of creatinine from solution. From 30 to 90 min absorbance decreased rapidly, but from 120 to 150 min absorbance was almost linear, showing the maximum adsorption at 120 min.
5.5 Interference effect
Here, the interference was examined against organic and inorganic interfering species that include cobalt sulphate, ammonia, glucose, glutathione, potassium nitrate, and urea. The solution of each species was prepared in a buffer solution of pH 7.4 and diluted with deionized water. Incubation of these species in combination with creatinine (1:1 ratio) in a magnetic membrane for 30 min was performed. The UV–visible spectra were taken for the adsorption studies on the membrane. Under these conditions, none of the species was observed at the wavelength of 222 nm at which creatinine is detected. Figure (A) shows the UV–visible spectra for creatinine and other interfering species, while Figure (B) shows the bar graph of these interfering species. In this study, creatinine in a combination with cobalt sulphate was adsorbed more significantly, while the least adsorption was for ammonia with creatinine.
5.6 Analysis of creatinine in serum samples
Potential applicability and feasibility of synthetic magnetic chitosan membrane were employed to determine creatinine in the serum sample. The serum sample was obtained from the clinical laboratory with the permission of the patient following ethical protocols and were analysed by the proposed method. The obtained serum was diluted 10-fold and experiments were performed by spiking of 1 mL serum sample to different concentrations of creatinine. The obtained results in Figure indicated a very good linear correlation with the concentration of the creatinine. The analytical recovery of creatinine was evaluated by spiking the serum sample with creatinine solution and analysing the concentration recovered. Table summarizes the maximum recoveries with an RSD of 1.71–3.04%, confirming the applicability of designed membrane for creatinine detection in serum samples.
Table 2. A recovery study carried out in serum samples for creatinine determination by magnetic chitosan membrane (N = 5).
6 Conclusion
The magnetic chitosan membrane was prepared by using chitosan and Fe3O4 for the analysis of creatinine. The determination and quantification of the creatinine were carried out by the spectrophotometric method. The different optimization parameters such as concentration, time, pH, and amount of membrane were taken into account for the analysis. Absorbance behaviour shows that an increase of concentration of magnetic membrane affects the absorbance hence changes adsorption. The absorbance study shows the detection limit of creatinine to be 7.32 µM. The LOD data showed that the creatinine can be determined at trace levels from samples. The potential applicability of the proposed membrane was investigated though the recovery experiments by spiking the serum samples with creatinine. The results showed excellent recoveries without any interference from the matrix. All the reagents used in the present study were economical, safe, non-toxic, biocompatible and shows absorbance in the UV–visible region. Moreover, all the experiments can be carried out at room temperature. Thus, the membrane can be applied as a ecofriendly material for the development of membrane for the removal of creatinine and other waste products from the body.
Acknowledgements
The authors are grateful to HEC, Pakistan, Women University Multan, Pakistan, and Bahauddin Zakariya University Multan Pakistan for providing laboratory facilities.
Disclosure statement
No potential conflict of interest was reported by the author(s).
Additional information
Funding
References
- Meng F, Seredych M, Chen C, et al. MXene sorbents for removal of urea from dialysate: a step toward the wearable artificial kidney. ACS Nano. 2018;12(10):10518–10528.
- Gura V, Rivara MB, Bieber S, et al. A wearable artificial kidney for patients with end-stage renal disease. JCI Insight. 2016;1:8.
- Tharpa K, Mahabala P, Gurunath C, et al. New chemistry supporting portable solutions for end-stage renal disease dialysis treatment. J Artif Organs. 2020;23(1):47–53.
- Maleki A, Ghamari N, Kamalzare MJRA. Chitosan-supported Fe3 O4 nanoparticles: a magnetically recyclable heterogeneous nanocatalyst for the syntheses of multifunctional benzimidazoles and benzodiazepines. RSC Adv. 2014;4(19):9416–9423.
- Eivazzadeh-Keihan R, Maleki A, De La Guardia M, et al. Carbon based nanomaterials for tissue engineering of bone: building new bone on small black scaffolds: A review. J Adv Res. 2019;18:185–201.
- Maleki A, Aghaei M, Ghamari NJCL. Synthesis of benzimidazolo [2, 3–b] quinazolinone derivatives via a one-pot multicomponent reaction promoted by a chitosan-based composite magnetic nanocatalyst. Chem Lett. 2015;44(3):259–261.
- Zarnegar Z, Safari JJ. The novel synthesis of magnetically chitosan/carbon nanotube composites and their catalytic applications. Int J Biol Macromol. 2015;75:21–31.
- Lee M, Chen B-Y, Den WJAS. Chitosan as a natural polymer for heterogeneous catalysts support: a short review on its applications. Appl Sci. 2015;5(4):1272–1283.
- Manohar A, Krishnamoorthi CJMC. Low Curie-transition temperature and superparamagnetic nature of Fe3O4 nanoparticles prepared by colloidal nanocrystal synthesis. Mater Chem Phys. 2017;192:235–243.
- Reddy DHK, Yun Y-S. Spinel ferrite magnetic adsorbents: alternative future materials for water purification? Coord Chem Rev. 2016;315:90–111.
- Popławska M, Krawczyk H. Uraemic toxins generated in the presence of fullerene C60, carbon-encapsulated magnetic nanoparticles, and multiwalled carbon nanotubes. BioMed Res Int. 2013.
- Albuquerque AS, Ardisson JD, Macedo W. A study of nanocrystalline NiZn-ferrite–SiO2 synthesized by sol–gel. J Magn Magn Mater. 1999;192(2):277–280.
- Shen K, Wang J, Li Y, et al. Preparation of magnetite core–shell nanoparticles of Fe3O4 and carbon with aryl sulfonyl acetic acid. Mater Res Bull. 2013;48(11):4655–4660.
- Amighian J, Karimzadeh E, Mozaffari M. The effect of Mn2+ substitution on magnetic properties of MnxFe3−xO4 nanoparticles prepared by coprecipitation method. J Magn Magn Mater. 2013;332:157–162.
- Zhao F, Zhang B, Feng LJML. Preparation and magnetic properties of magnetite nanoparticles. Mater Lett. 2012;68:112–114.
- Manohar A, Vijayakanth V, Hong R. Solvothermal reflux synthesis of NiFe2O4 nanocrystals dielectric and magnetic hyperthermia properties. J Mater Sci: Mater Electron. 2020;31(1):799–806.
- Hasany S, Ahmed I, Rajan J, et al. Systematic review of the preparation techniques of iron oxide magnetic nanoparticles. Nanosci Nanotechnol. 2012;2(6):148–158.
- Podstawka E, Światłowska M, Borowiec E, et al. Food additives characterization by infrared, Raman, and surface-enhanced Raman spectroscopies. J Raman Spectrosc. 2007;38(3):356–363.
- Cooper R, Naclerio F, Allgrove J, et al. Creatine supplementation with specific view to exercise/sports performance: an update. J Int Soc Sports Nutr. 2012;9(1):1–11.
- Zhang Z, Xian J, Zhang C, et al. Degradation of creatinine using boron-doped diamond electrode: statistical modeling and degradation mechanism. Chemosphere. 2017;182:441–449.
- Chen J-C, Kumar A, Chung H-H, et al. An enzymeless electrochemical sensor for the selective determination of creatinine in human urine. Sens Actuators, B. 2006;115(1):473–480.
- Castro RMB. (2013). Desenvolvimento e aplicação de um biossensor para monitorização de creatinina, um biomarcador associado a doenças emergentes.
- He Y, Zhang X, Yu H. Gold nanoparticles-based colorimetric and visual creatinine assay. Microchim Acta. 2015;182(11):2037–2043.
- Subrahmanyam S, Piletsky SA, Piletska EV, et al. Bite-and-Switch’approach using computationally designed molecularly imprinted polymers for sensing of creatinine. Biosens Bioelectron. 2001;16(9-12):631–637.
- Debus B, Kirsanov D, Yaroshenko I, et al. Two low-cost digital camera-based platforms for quantitative creatinine analysis in urine. Anal Chim Acta. 2015;895:71–79.
- Mădăraş MB, Popescu IC, Ufer S, et al. Microfabricated amperometric creatine and creatinine biosensors. Anal Chim Acta. 1996;319(3):335–345.
- Mai TTT, Ha PT, Pham HN, et al. Chitosan and O-carboxymethyl chitosan modified Fe3O4 for hyperthermic treatment. Adv Nat Sci: Nanosci Nanotechnol. 2012;3(1):015006.